7.3.1 State and trends
Threatened flora and fauna species
Why is this indicator important?
The extent and abundance of threatened flora and fauna species provide a measure of biodiversity. In addition, movement in statutory species listings – for example, if a species moves from vulnerable to endangered – raises concerns about potential biodiversity loss (although the listing process is also influenced by other factors, such as effort and attention given to different species by government, researchers and interest groups). Population changes are also one of the best indirect measures currently available for assessing the effectiveness of management actions.
Current monitoring status and interpretation issues
The flora and fauna species described in this indicator are all prescribed as threatened under s. 63 of the Nature Conservation Act 2014. To be eligible for inclusion on the list, the status of the species must comply with prescribed criteria and be one of:
- extinct
- extinct in the wild
- critically endangered
- endangered
- vulnerable
- conservation dependent
- provisional.
Threatened species in the ACT are currently listed as either endangered or vulnerable. Species that may be threatened for which we have little information are addressed under the indicator ‘Rare and insufficiently known species and ecological communities’. See also ‘Current monitoring and interpretation issues’ in ‘Rare and insufficiently known species and ecological communities’ for information on new statutory categories for rare and data-deficient species.
The species currently prescribed as threatened under the Nature Conservation Act are:
- endangered species
- Brush-Tailed Rock-Wallaby (Petrogale penicillata)
- Smoky Mouse (Pseudomys fumeus)
- Regent Honeyeater (Xanthomyza phrygia)
- Grassland Earless Dragon (Tympanocryptis pinguicolla)
- Northern Corroboree Frog (Pseudophryne pengilleyi)
- Macquarie Perch (Macquaria australasica)
- Silver Perch (Bidyanus bidyanus)
- Trout Cod (Maccullochella macquariensis)
- Golden Sun Moth (Synemon plana)
- Baeuerlen’s Gentian (Gentiana baeuerlenii)
- Brindabella Midge Orchid (Corunastylis ectopa)
- Button Wrinklewort (Rutidosis leptorrhynchoides)
- Canberra Spider Orchid (Arachnorchis actensis)
- Ginninderra Peppercress (Lepidium ginninderrense)
- Murrumbidgee Bossiaea (Bossiaea grayi)
- Small Purple Pea (Swainsona recta)
- Tarengo Leek Orchid (Prasophyllum petilum)
- Tuggeranong Lignum (Muehlenbeckia tuggeranong)
- vulnerable species
- Spotted-Tailed Quoll (Dasyurus maculatus)
- Brown Treecreeper (Climacteris picumnus)
- Glossy Black Cockatoo (Calyptorhynchus lathami)
- Hooded Robin (Melanodryas cucullata)
- Little Eagle (Hieraaetus morphnoides)
- Painted Honeyeater (Grantiella picta)
- Scarlet Robin (Petroica multicolor)
- Superb Parrot (Polytelis swainsonii)
- Swift Parrot (Lathamus discolor)
- Varied Sitella (Daphoenositta chrysoptera)
- White-Winged Triller (Lalage sueurii)
- Pink-Tailed Worm Lizard (Aprasia parapulchella)
- Striped Legless Lizard (Delma impar)
- Murray River Crayfish (Euastacus armatus)
- Two-Spined Blackfish (Gadopsis bispinosus)
- Perunga Grasshopper (Perunga ochracea).
This indicator reports on the state and trend of the extent and, where possible, the abundance of each listed threatened species. The quality and quantity of the reporting are commensurate with the monitoring data available in the reporting period.
What does this indicator tell us?
Vulnerable species
A native species is eligible to be included in the vulnerable category on the threatened native species list if it is not critically endangered or endangered, but is facing a high risk of extinction in the wild in the medium-term future.
Spotted-Tailed Quoll
Spotted-Tailed Quoll sightings in the ACT are mainly unplanned, especially in the Gudgenby area of Namadgi National Park, and those that have met with misadventure (eg killed on roads or driven up backyard trees by dogs). Two individuals were seen living in unsuitable urban habitat (eg roadside drains). No deliberate survey has ever detected the species in the ACT, although scats were found at Gudgenby during a search for quoll latrines in 2005.
In 2013, using an improved survey method, the Gudgenby Catchment was surveyed down to Glendale Crossing. The survey provided no evidence of quolls.16 Fox scats were found on the quoll latrine sites identified in previous years and were common elsewhere in the area.
Brown Treecreeper
In 2014, the Canberra Ornithologists Group (COG) recorded 64 sightings of Brown Treecreeper, a 30% drop from 2013.17 This is the second drop in annual records after a very gradual rise from 20 in 1998 to 138 in 2012. One breeding pair was recorded in 2014, well down on 11 records in 1989 and 10 in 2011.17 Brown Treecreepers are possibly in decline (Scientific Committee State of the Environment Report reviewer, pers comm by email, 1 October 2015).
Glossy Black Cockatoo
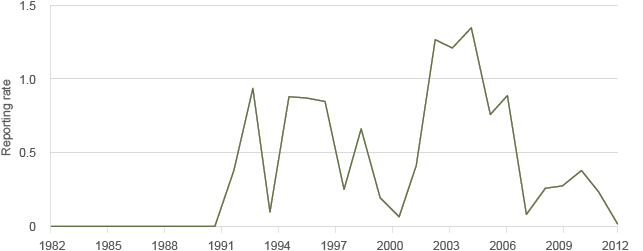
The Glossy Black Cockatoo is an uncommon visitor to the ACT. The species is occasionally seen in Casuarina trees (used as a food source) on Mounts Ainslie and Majura. Cockatoo sightings, as reported by COG, have declined from a peak in 2003–2005 (Figure 7.2); however, the Scientific Committee states that Glossy Black Cockatoos show no long-term declining trend.18
Source: Canberra Ornithologists Group, http://canberrabirds.org.au/wp-content/uploads/2015/02/Glossy-Black-Cockatoo.pdf
Figure 7.2 Percentage of datasheets reporting Glossy Black Cockatoo, 1981–2013
Conservation and Planning Research (CPR) reports that the Glossy Black Cockatoo has recently been found to breed on Mount Majura.
Hooded Robin
In 2014, Hooded Robin recorded sightings were 50% higher than in 2013, which was the lowest since 1985. Until 2014, there was a steady decline since the high numbers of sightings in 2009. The majority of sightings were in summer (46%). This is different to the long-term seasonal distribution, which is fairly even across the seasons, and different to the previous year, when the majority of records were in autumn. One breeding pair was recorded in 2014.19
The majority of known Hooded Robin habitat is protected in conservation areas (Mulligans Flat, Goorooyarroo, Namadgi, Jarramlee), but habitat also occurs on land managed by the Australian Government Department of Defence (Majura Army Firing Area), and in the Naas and Murrumbidgee valleys. The population in Mulligans Flat appears to have recently become extinct.20
Little Eagle
Each year, many sightings are recorded of nonbreeding Little Eagles, which could tend to obscure the true status of the species in the ACT. Only three breeding pairs of Little Eagles are known, all in peri-urban areas. Retaining this species in the ACT (ie as a breeding population) is a challenge. Although nonbreeding individuals visit the upland parts of the ACT and the Murrumbidgee River Corridor, the breeding habitat corresponds to areas planned for urban development. The foraging and territorial area required by a pair of Little Eagles is unknown, but it appears to be so large that no existing urban reserve could meet the needs of a pair. The first tracking studies of the species are planned for 2015–2017 in areas proposed for development. The project will seek ways to accommodate the apparently competing goals of retaining the species and accommodating urban expansion.
In addition, there is a working theory that rabbits (which form the main contemporary diet of the Little Eagle) baited with pindone may disable or be fatal to the Little Eagle. Retaining foraging habitat without this control may be important to the survival of this species.21
Painted Honeyeater
The Painted Honeyeater is a rare visitor to the ACT. There was a significant increase in Painted Honeyeater numbers observed in the ACT in the early 2000s.22,23 Numbers appear to have declined since then.23
Scarlet Robin
There has been a significant long-term decline in Scarlet Robin occupancy rates in the ACT since 1999.24 In 2015, the ACT Scientific Committee identified the Scarlet Robin as vulnerable, meaning that the species is at risk of premature extinction in the ACT region in the next 25–50 years.25
Superb Parrot
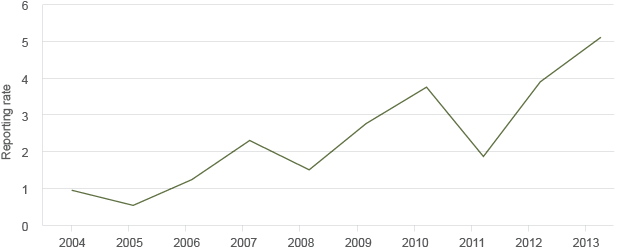
Until the summer of 2005–06, the Superb Parrot was known as a rare visitor to the ACT. Since then, small flocks have been regularly observed feeding on ovals and street trees in Belconnen and parts of Gungahlin from September to March (Figure 7.3). Numbers appeared to decrease in 2011–12, but the reason for this is unknown and the recording is thought to be an outlier.
Source: Canberra Ornithologists Group28
Figure 7.3 Superb Parrot reporting rates
Targeted surveys have located three areas in which breeding is concentrated, with 15–20 pairs of breeding birds nesting at each of the Throsby Ridge and Central Molonglo sites, and a further location confirmed in 2014 at Spring Valley Farm south of the Molonglo River.26 The occasional pair also nests within Mulligans Flat and Goorooyarroo nature reserves. Birds may also be breeding south of the Molonglo River in the Pine Ridge area, but this has to be confirmed. In 2013, Superb Parrots appeared to overwinter in Canberra for the first time (S Henderson, COG, pers comm, 1 August 2013).
However, it should be noted that retired Commonwealth Scientific and Industrial Research Organisation (CSIRO) scientist and long-serving COG member Chris Davey indicated that seeing more birds does not necessarily mean an increase in numbers. It may indicate that their distribution has changed because of climate change or other factors.27
Swift Parrot
The Swift Parrot is an occasional nonbreeding winter migrant to the ACT from Tasmania. It has been recorded in eucalypt forest and woodland, mainly in the Majura–Mount Ainslie area. There were nine recorded sightings in 2013–14.29
Varied Sittella
Sightings of Varied Sittella were relatively consistent for 2013 and 2014, although well below both the 10- and 30-year averages. Records of breeding pairs have been consistently between five and seven for the past three years.30
White-Winged Triller
The White-Winged Triller migrates to the ACT each summer, where it is widely distributed in woodlands. A large proportion of sightings are from reserves (Mulligans Flat, Goorooyarroo, the Pinnacle, Black Mountain, Gigerline) and Defence land (Campbell Park).
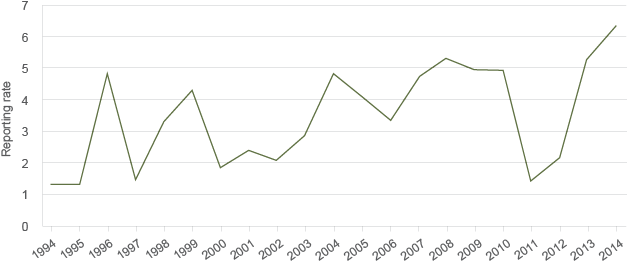
Reporting rates have increased slowly for a long period, with the exception of a sharp dip in 2010–11 and 2011–12 (Figure 7.4). Figures have shown a strong recovery since 2012. There were 17 breeding records in 2013, more than the 10- and 30-year averages for the species.
Source: Canberra Ornithologists Group31
Figure 7.4 White-Winged Triller reporting rates, 1994–2014
Pink-Tailed Worm Lizard
In the ACT, the Pink-Tailed Worm Lizard is mainly distributed along the Murrumbidgee and Molonglo river corridors, as well as in some of the hills within Canberra Nature Park. Although widespread, the species is patchily distributed and is absent from some suitable habitat within larger habitat mosaics. Records have been made in Canberra Nature Park (Mount Taylor, Cooleman Ridge, Urambi Hills, the Pinnacle, Farrer Ridge, Mount Arawang, Oakey Hill, McQuoids Hill, Kama Nature Reserve and Black Mountain), the Murrumbidgee River Corridor (Woodstock, Stony Creek, Bullen Range and Gingerline reserves), some leasehold land and some natural remnants within land managed for forestry. Historical records also exist from within or close to the Ainslie–Majura complex, Tuggeranong Hill and Red Hill.32
The survey results during 2011–2015 are as follows:
- In spring 2012, a detailed survey across the western part of Gungahlin found three live animals and two sloughed skins close to each other in the Kinlyside–Casey area. The Pink-Tailed Worm Lizard was not recorded in any of the pit or tile surveys undertaken for the Striped Legless Lizard across Gungahlin, and was not found in a targeted rock-rolling survey in Moncrieff, Jacka or Taylor. Suitable rocky habitat for this species is generally uncommon in Gungahlin.33
- In 2012, researchers conducted an extensive on-ground confirmatory survey of the current distribution of the Pink-Tailed Worm Lizard within the Mount Taylor Nature Reserve. The study found that Mount Taylor reserve still supports a very substantial and regionally important population of Pink-Tailed Worm Lizards, and this population appears to have changed little in distribution and abundance since the previous comprehensive surveys done 20 years ago.34 Potential habitat for the species in the reserve was found to be widespread and is mostly in good condition – most being mapped as being either moderate (27 ha) or high (20 ha) quality (Figure 7.5).
- A 2013 study of habitat for the Pink-Tailed Worm Lizard was conducted in the Belconnen – Ginninderra Creek area. Habitat within the study area contributes greatly to the potential dispersal corridor for Pink-Tailed Worm Lizard and other wildlife species (Figure 7.6). The main corridor in this area is associated with the steeper slopes close to the Murrumbidgee River. The rocky corridor through this part of the ACT and New South Wales (NSW) provides an important link between the biologically diverse Ginninderra Falls area in NSW and the important Molonglo River Corridor in the ACT, where there are many records of Pink-Tailed Worm Lizard along the full extent of the corridor.35
- A 2013 study on a 28-ha rural lease in Pialligo found live lizards, evidence of skins and extensive areas of habitat.36 However, it has recently been confirmed that this habitat is heavily invaded by African Lovegrass.18
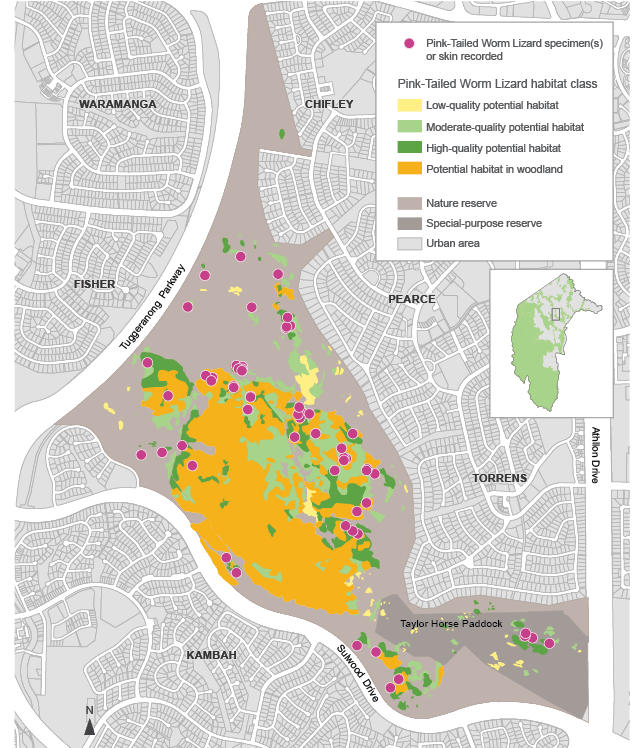
Figure 7.5 Locations of Pink-Tailed Worm Lizards in the Mount Taylor reserve plotted in relation to mapped habitat quality, 2012
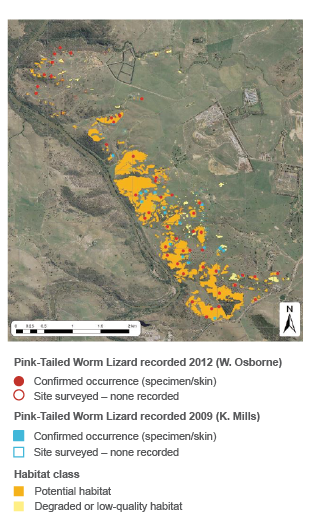
Figure 7.6 Confirmed location records for Pink-Tailed Worm Lizard overlaid on map of potential habitat, 2013
Striped Legless Lizard
A series of targeted surveys was undertaken between October and December 2012 to provide information on the distribution and density of the Striped Legless Lizard in Crace, Mulangarri and Gungaderra Grassland nature reserves, and adjoining open space. The surveys used an artificial shelter (roof tiles) method with two different grid formations to determine the presence of the species across the three grassland reserve areas.
All reserves support abundant populations of Striped Legless Lizard (Table 7.1). A total of 251 individual animals were identified from a total of 323 captures (including recaptures of the same individual) from the three grassland reserves. Gungaderra recorded the highest number of captures, and the highest density recorded at a single grid was also observed at Gungaderra. With a few exceptions, all grids recorded at least one Striped Legless Lizard capture.
Table 7.1 Summary of Striped Legless Lizard captures in targeted surveys, 2012
| Grassland | Total individuals | Total captures | Capture rate | Number of tiles | Population estimate |
|---|---|---|---|---|---|
|
Crace |
60 |
84 |
1.7% |
4900 |
1000–3000 |
|
Mulangarri |
90 |
110 |
2.2% |
4900 |
2000–4000 |
|
Gungaderra |
101 |
129 |
2.7% |
4800 |
3000–9000 |
There were 71 recaptures, and most of these were under the same tile, with 84.5% of recaptures within 5 metres (m) of the original capture location. One lizard moved 80 m, while only six recaptures were further than 10 m, suggesting that a 10-m buffer around tile arrays is probably a reasonable indication of the area from which lizards may have been drawn to a tile.
Targeted surveys were conducted in Symonston and Jerrabomberra Valley in 2011. The study area covered four properties totalling 540 ha: Callum Brae, Cookanalla, Bonshaw and Wendover. A small part of the study area also occurred in the Jerrabomberra Grasslands Reserve.
The surveys recorded Striped Legless Lizard individuals at a number of locations. This species predominantly occurred in areas of native grassland dominated by Tall Spear Grass. The estimated density of the lizard within the study area was approximately 19 individuals per hectare. The main population within the study area (east of the Monaro Highway) is considered likely to be contiguous with areas of potential habitat in the adjacent Department of Defence property HMAS Harman and lands to the south-east.37
Murray River Crayfish
An initial survey of this species in 1988 revealed that, despite evidence of distribution throughout the length of the Murrumbidgee River within the ACT, catch rates were patchy and low in comparison with other parts of its range. In response to these findings, the ACT Government banned fishing of Murray River Crayfish in 1993 and put in place a monitoring program. The low number of crayfish captured longitudinally through this monitoring indicates that the species remains at risk (Table 7.2).38
Table 7.2 Murray River Crayfish captured in the ACT region, 1988–2013
| Area | 1988 | 1989 | 1994 | 1996 | 1998 | 2005 | 2008 | 2013 |
|---|---|---|---|---|---|---|---|---|
|
Angle Crossing |
0 |
NA |
36 |
5 |
3 |
6 |
NA |
0 |
|
Tharwa Sandwash |
0 |
NA |
18 |
2 |
2 |
0 |
NA |
NA |
|
Lanyon |
0 |
NA |
NA |
NA |
1 |
0 |
NA |
NA |
|
Lambrigg |
0 |
NA |
NA |
NA |
0 |
0 |
NA |
NA |
|
Pine Island (upper) |
1 |
NA |
NA |
NA |
2 |
30 |
2 |
0 |
|
Pine Island (lower) |
NA |
0 |
NA |
NA |
NA |
NA |
5 |
NA |
|
Allens Creek (upper) |
1 |
2 |
NA |
NA |
NA |
NA |
NA |
NA |
|
Allens Creek (lower) |
6 |
2 |
NA |
NA |
22 |
4 |
0 |
8 |
|
Kambah Pool |
1 |
NA |
1 |
5 |
4 |
0 |
0 |
NA |
|
Jews Corner |
5 |
NA |
na |
na |
4 |
0 |
0 |
NA |
|
Casuarina Sands |
0 |
NA |
8 |
2 |
1 |
0 |
5 |
28 |
|
Huntly |
0 |
NA |
NA |
NA |
0 |
0 |
NA |
NA |
|
Uriarra Sandwash |
0 |
NA |
NA |
NA |
NA |
NA |
1 |
NA |
|
Total |
14 |
4 |
63 |
14 |
39 |
40 |
13 |
36 |
NA = not available
Note: Numbers in the table should be interpreted with some caution. Anomalous components of the program have affected confidence in the results and make it difficult to compare trends over time. This is because sampling methods and timing of sampling were not always consistent from year to year. Notwithstanding these issues, Murray River Crayfish is unambiguously a threatened species.
Two-Spined Blackfish
Two-Spined Blackfish are restricted to the Cotter River Catchment within the ACT, and systematic monitoring of the species is undertaken each year.
The monitoring found low numbers of this species in 2009–2012 at both regulated sites (subject to government-controlled Environmental Flow Guidelines) and unregulated sites (upstream of Corin Reservoir). This is likely to be due to drought, followed by extreme high flows during the breeding season.16
The 2013 sampling found that numbers had increased. In 2014, nine Cotter River sites were surveyed. A total of 215 blackfish were caught: 106 from the six sites in the regulated section of the Cotter River and 109 from the three sites in the unregulated section. Two reference sites from outside the Cotter River Catchment were also sampled, where 25 blackfish were caught from Mountain Creek and three from Micalong Creek.
Under the 2013 Environmental Flow Guidelines,39 there are two management indicators for Two-Spined Blackfish populations:
- The first indicator value (40% or more of population at regulated sites being either age 0+ or 1+) was achieved in 2014: 47 of the 106 (44.3%) Two-Spined Blackfish captured from the regulated reach were aged 0+ or 1+.
- The second indicator value (greater than 80 individual blackfish at regulated sites) was also met in 2014, with 106 captured from sites within the regulated reach.
The summarised conclusions from the Two-Spined Blackfish monitoring program in 2014 are as follows:
- The mean number of Two-Spined Blackfish recorded in the regulated reach in 2014 was lower than 2013 but higher than 2012.
- Two-Spined Blackfish resilience to previous flood events is evident, but patterns of response are not consistent among reach types.
- The average abundance of young-of-year (those fish hatched within the current year) appears to have declined; more young-of-year were captured in the regulated than unregulated reach, although the majority of the young in the regulated waterway came from one site (M Beitzel, Aquatic Ecologist, Environment and Planning Directorate [EPD], pers comm, 31 August 2015).
In addition to the 2014 monitoring results for the nine sites presented above, a 2012 study conducted primarily to ascertain the effects of the enlarged Cotter Dam on Macquarie Perch found, for the first time in more than 30 years, Two-Spined Blackfish to be present in the Cotter Reservoir. It is believed that the individuals captured may have been displaced by high flow and/or colonised the backed-up waters of the Cotter Reservoir during the 2011 floods. This provides some indication of how the species may respond to the enlargement of the Cotter Dam.40
As part of assessing the potential impacts on threatened fish from the construction, filling and operation of the enlarged Cotter Dam, sampling for a three-year period (2010–2012) captured 5554 fish from 13 species. Two-Spined Blackfish was the most abundant species captured in the Cotter River.
Perunga Grasshopper
The flightless Perunga Grasshopper is a cryptic species (species that are physically similar but reproductively isolated from each other) that is difficult to detect in grasslands. There have been few detailed studies of this species and, hence, relatively little is known about its habitat requirements or distribution.41 Information on the distribution of this species has generally been collected opportunistically and incidentally while undertaking surveys for plants and other grassland fauna.
The findings of these surveys for 2011–2015 are as follows:
- In 2011, the grasshopper was opportunistically sighted at three different locations within the proposed Molonglo River Corridor Park. It is probable that most of its habitat is within the Molonglo River Corridor, and that measures to improve Pink-Tailed Worm Lizard habitat will also favour this vulnerable grasshopper.42
- Surveys undertaken at lands in Symonston and Jerrabomberra Valley during 2011–12 recorded 14 grasshoppers across three sites.41
- A 2012 survey found two females in the Crace Grassland Reserve.43
Endangered species
A native species is eligible to be included in the endangered category on the threatened native species list if it is not critically endangered, but it is facing a very high risk of extinction in the wild in the near future.
Brush-Tailed Rock-Wallaby
The last recorded sighting of the Brush-Tailed Rock-Wallaby in the wild in the ACT was more than 50 years ago, at Tidbinbilla in 1959.44 There is currently a captive breeding colony at Tidbinbilla Nature Reserve,45 which successfully breeds animals for reintroduction in Victoria and NSW. This program also enables ACT Government ecologists to develop expertise in the ecology and management of the species based on physiological, behavioural and reproductive biology studies of the Tidbinbilla population.
In 2015, a revised version of the action plan for the Brush-Tailed Rock-Wallaby was released in response to new information about the conservation needs of this species.45,46
In addition, the ACT Government is investigating the suitability of possible reintroduction sites within the ACT and the feasibility of re-establishing wild populations that can be maintained in perpetuity at low cost.
However, before a species can be successfully reintroduced to an area, the factors that caused the initial loss must be dealt with. Recent experience in NSW and Victoria suggests that the Brush-Tailed Rock-Wallaby is highly sensitive to low densities of foxes, which means that any reintroduction of this endangered wallaby to the ACT will need a long-term commitment to fox control (Scientific Committee State of the Environment Report reviewer, pers comm by email, 1 October 2015).
Smoky Mouse
In the ACT, there have been only two confirmed sightings (trapped individuals) and a hair record of the endangered Smoky Mouse, all obtained in the 1980s from Namadgi National Park. Follow-up surveys using trapping and hair-sample tubes in the 1990s failed to find the species. Surveys for other small mammal species between 2002 and 2010 also did not record the Smoky Mouse. In 2014, around 40 sites were surveyed using cameras, and the Smoky Mouse was not detected. It is unknown whether this elusive species still persists in the ACT.
Regent Honeyeater
The Regent Honeyeater is a rare visitor to the woodlands of the ACT region, usually attracted by the flowering Yellow Box or suburban ironbarks. It also feeds on nectar from grevilleas and mistletoes, but must compete with the larger and more aggressive Red Wattlebirds and Noisy Friarbirds.
The Regent Honeyeater population is decreasing throughout much of the species’ range, and its range is also contracting. This conclusion, sourced from Australian Government data, is based on a decline in reporting frequency, and the reduced size and occurrence of flocks.47 The ACT Scientific Committee states that the long-term trend does not appear to be towards decline; rather, the data suggest infrequent, unpredictable use of ACT habitat (Scientific Committee State of the Environment Report reviewer, pers comm by email, 1 October 2015).
The few records for this bird in the ACT are spread throughout the year and are insufficient to suggest any trend (Figure 7.7).
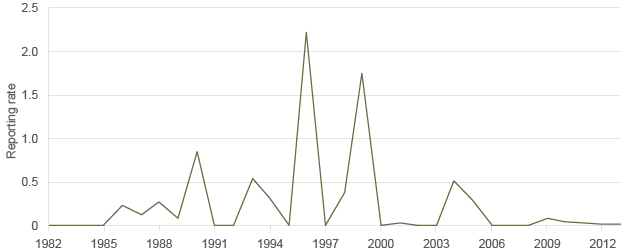
Source: Canberra Ornithologists Group, http://canberrabirds.org.au/wp-content/uploads/2015/02/Regent-Honeyeater.pdf
Figure 7.7 Regent Honeyeater reporting, 1983–2013
Grassland Earless Dragon
The Grassland Earless Dragon is a nationally endangered species, with populations located only near Canberra and parts of the Monaro region near Cooma.
In 2002, a long-term monitoring program using artificial burrows between February and April in each year was set up at Jerrabomberra to:
- determine long-term population trends at key sites
- refine knowledge of the species’ habitat requirements.
The program has found that the species has suffered a serious decline in the past decade (Table 7.3),48 likely due to drought and exacerbated by increased herbivore pressure.
Table 7.3 Grassland Earless Dragons found at Jerrabomberra, 2006–2013
| Age and sex | 2006 | 2007 | 2008 | 2009 | 2010 | 2011 | 2012 | 2013 |
|---|---|---|---|---|---|---|---|---|
|
Adult males |
24 |
13 |
11 |
6 |
1 |
1 |
1 |
1 |
|
Adult females |
18 |
4 |
2 |
2 |
1 |
0 |
1 |
1 |
|
Adult unknown sex |
1 |
0 |
0 |
0 |
0 |
0 |
0 |
0 |
|
Juveniles |
165 |
11 |
21 |
22 |
3 |
1 |
0 |
16 |
|
Total |
208 |
28 |
34 |
30 |
5 |
2 |
2 |
18 |
However, since then, numbers have increased at most monitored sites, including Majura Training Area (a Department of Defence site), and East and West Jerrabomberra reserves (Figure 7.8).
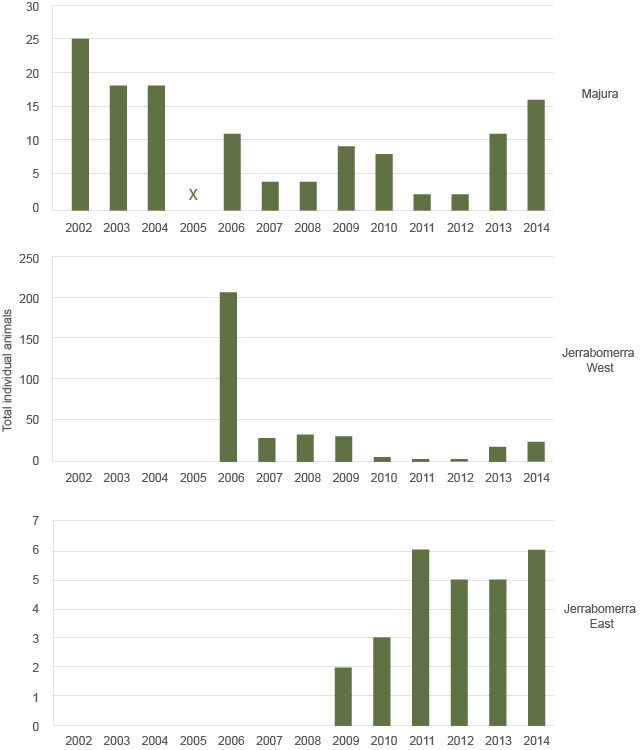
Source: ACT Government (Hunting Dragons presentation by the ACT Government to Friends of Grasslands, August 2014)
Figure 7.8 Grassland Earless Dragons found at Majura, Jerrabomberra West and Jerrabomberra East, 2002–2014
With the breaking of the millennium drought in 2010, Grassland Earless Dragon numbers appear to have stabilised and may be recovering.
Northern Corroboree Frog
The Northern Corroboree Frog occurs in two isolated populations: one in the Bogong Mountains (Fiery Range, NSW), and the other in the Brindabella Ranges (ACT). The Brindabella Range population occupies the area from California Flats to Mount Bimberi at 1090–1840 m above sea level, and is made up of two subpopulations, each represented by frogs that are slightly genetically different.
The Northern Corroboree Frog disappeared from 40% of its range in the 2000s; declines in the Brindabella Range were more severe.49 There are currently estimated to be fewer than 50 individuals remaining in the wild in this area.16
The decline in the population is due to the spread of the introduced amphibian chytrid fungus, a pathogen that has caused declines, and in some cases extinction, of frogs worldwide.
Corroboree Frog monitoring occurs in February each year. The frogs are monitored by counting the number of calling males at breeding sites (sphagnum moss bogs and other wet areas) during the annual summer breeding season (January–March) in Namadgi National Park. Monitoring is done at key breeding sites in the ACT, which include Ginini Flats, Cheyenne Flats and Snowy Flats. In 1985, there were more than 500 males calling at Ginini Flat West (Figure 7.9), but, since 2002, there have been fewer than five males calling during the surveys.
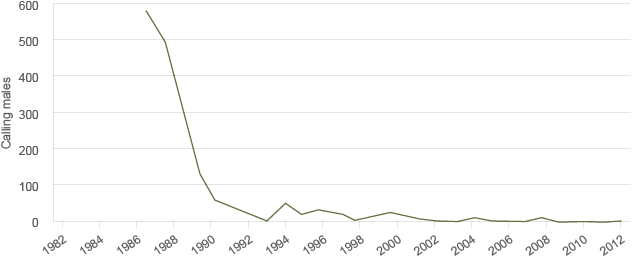
Figure 7.9 Northern Corroboree Frog abundance at Ginini Flat West in Namadgi National Park, 1982–2012
There are now too few Northern Corroboree Frogs remaining in Namadgi National Park to breed and maintain wild populations. For this reason, CPR (ACT Government) established a captive population of Northern Corroboree Frogs from eggs collected in the wild in 2003. The captive population is located at Tidbinbilla and currently houses around 500 frogs.
Juvenile Northern Corroboree Frogs bred in captivity were released back to sphagnum moss bogs in Namadgi National Park in 2011 and 2012 to determine whether such releases can bolster wild populations, and promote breeding and development of natural resistance to chytrid fungus.
Field monitoring in February 2015 showed that some of the captive-bred individuals released in 2011 to the wild have survived to breeding age.
Macquarie Perch
The Australian Government Species Profile and Threats Database reports that, in the ACT, Macquarie Perch is restricted to the Murrumbidgee, Paddys and Cotter rivers. It was previously known to occur in the Molonglo River, but was last recorded in the river in about 1980.50
The Macquarie Perch has evolved in riverine systems and requires access to flowing water to breed. This has meant that lack of access to the Queanbeyan River following filling of Googong Reservoir has led to the near-extinction of an impoundment population of Macquarie Perch. The Queanbeyan River/Googong population was translocated above the Googong Reservoir – it survived for a while, but after the drought it has not been recaptured and is presumed extinct.
Adult Macquarie Perch usually remain within Cotter Reservoir and had previously not been observed in the Cotter River during an annual cycle. However, there is now a resident population of the species in the river.
The mechanisms underpinning the adult occupation of Cotter Reservoir, and the avoidance of river habitat for much of the year, are poorly understood. Potential reasons include dominance of alien salmonids in the river upstream, differential predation by avian predators in the river relative to the reservoir, thermal conditions, in-stream barriers as a result of a relatively steep gradient riverbed coupled with low and regulated flows, or angling pressure.51
Sampling during a three-year period (2010–2012) shows that, from a total of 5554 fish from 13 species captured, Macquarie Perch was the most abundant species captured in Cotter Reservoir.
Silver Perch
The once-strong Silver Perch population in Burrinjuck Reservoir (NSW) collapsed in the 1980s. There was a concomitant collapse of that population’s annual summer migrations into the ACT reaches of the Murrumbidgee River. This collapse was captured in data from a fish-monitoring trap on the Murrumbidgee River at Casuarina Sands, in which Silver Perch captures declined from 252 specimens in 1984, to 4 in 1988 and none in 1989. (Severe drought also impeded fish movement in the first three years of the trap’s operation.) Since 1990, no Silver Perch have been recorded in the ACT reaches of the Murrumbidgee River in fish surveys and monitoring. Similarly, monitoring at two sites in Burrinjuck Reservoir in 2004 failed to locate any specimens.52 Silver Perch is now functionally extinct in the ACT (L Evans, Senior Aquatic Ecologist, Conservation Research, EPD, pers comm, 17 June 2015 ).
Trout Cod
Trout Cod died out in the Canberra region in the 1970s. Conservation stocking has been undertaken in a number of waterways as part of the National Recovery Plan for Trout Cod in an effort to re-establish the species in its former range.16
Historically, Trout Cod occurred throughout the entire length of the lower Murrumbidgee River and 200 kilometres (km) of the upper Murrumbidgee; the species was last recorded from the river in 1976. In an attempt to restore Trout Cod populations, both the upper and mid-reaches of the Murrumbidgee River have been stocked. In excess of 326 000 Trout Cod fingerlings have been stocked across eight sites in the upper Murrumbidgee River since 1988. Regular monitoring at some sites has demonstrated survival and growth of stocked individuals, but no recruitment or establishment of self-sustaining populations has occurred. Detection of stocked individuals 3+ years old at riverine sites has been unsuccessful, except at one site where 3-year-old Trout Cod are being regularly recorded.
Angle Crossing received the greatest stocking effort (99 500 fingerlings over nine years to 2005), and the collection of a single small fish in 2011 (six years after stocking ceased) may be an indication that some breeding by stocked fish has occurred. Stocking of 8740 fingerlings over two years in Bendora Reservoir on the Cotter River has resulted in recruitment from stocked fish more than a decade after stocking, and these recruits now dominate the population.18,53
Golden Sun Moth
Surveys of Golden Sun Moth show that there is a total of 1800 ha of moth habitat in the ACT.54 Of this, 47% is within existing or proposed nature reserves, or existing or proposed offset areas; 21% is approved or proposed for clearance; and 23% occurs on Commonwealth land and has an uncertain future.
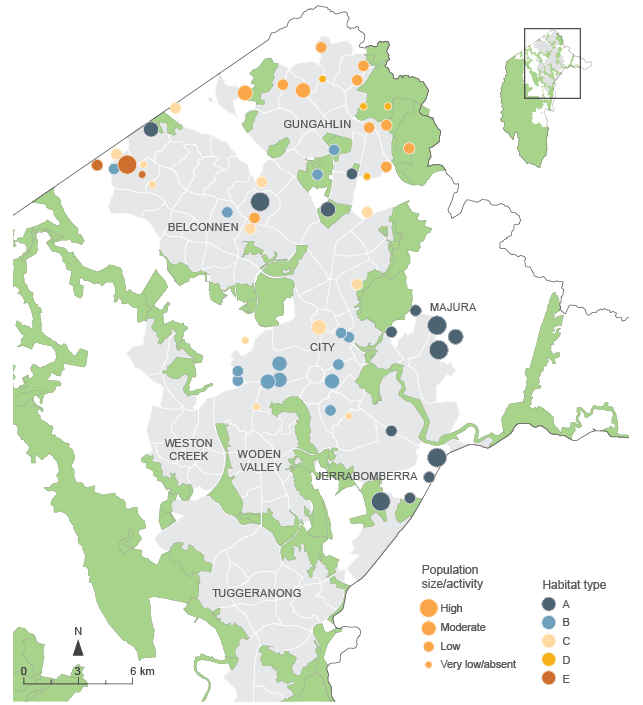
Potential moth habitat includes areas of Natural Temperate Grassland and nearby open woodlands (medium probability), and native grassland containing significant Wallaby Grass and/or stipa cover (high probability). There are 73 habitat sites identified in the ACT (Figure 7.10), but most sites are fragmented and isolated. This is important for the long-term protection and conservation of the species; given the moth’s poor flying ability, populations separated by distances of greater than 200 m can be considered effectively isolated.
Notes:
1. Habitat type A. Natural Temperate Grassland/high-quality native pasture – large area.
2. Habitat type B. Natural Temperate Grassland/high-quality native pasture – smaller remnant.
3. Habitat type C. Mixed native and exotic grasses in former Natural Temperate Grassland.
4. Habitat type D. Secondary grassland (Box–Gum Woodland community).
5. Habitat type E. Chilean Needlegrass or other exotic grasses.
Source: Adapted from Hogg & Moore56 in Mulvaney,33 p 58
Figure 7.10 Distribution, habitat type, population size and activity of Golden Sun Moth across the ACT, 2012
Gunghalin contains 45% of the ACT’s moth habitat, but only 9% of the population (as recorded by maximum moth counts; Table 7.4). In terms of number of sites, habitat area and moths supported, the Jerrabomberra Valley appears to be the least important of the five valleys in which the Golden Sun Moth occurs. However, the Commonwealth land in Jerrabomberra is perhaps the last large high-potential habitat area yet to be surveyed – which, if surveyed, may change the figures.
The ACT Strategic Conservation Management Plan for Golden Sun Moth was released in 2012.55
Table 7.4 Golden Sun Moth sites, habitat and numbers in ACT valleys
| District | No. of sites | Habitat area (ha) | Percentage of habitat | Max no. of moths | Percentage of moths |
|---|---|---|---|---|---|
|
Belconnen |
9 |
355 |
20 |
3083 |
27 |
|
Central Canberra |
25 |
110 |
6 |
1484 |
13 |
|
Gungahlin |
32 |
812 |
45 |
991 |
9 |
|
Jerrabomberra |
7 |
60 |
3 |
502 |
4 |
|
Majura |
5 |
466 |
26 |
5444 |
47 |
ha = hectare
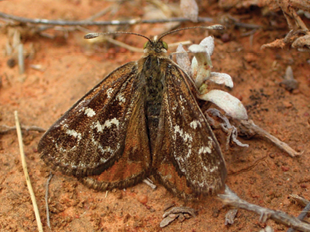
The Golden Sun Moth is an endangered species in the ACTPhoto: ACT Government
Baeuerlen’s Gentian
The only confirmed site of Baeuerlen’s Gentian – a small annual subalpine herb – is in the Orroral Valley in Namadgi National Park. In 1992, the ACT subpopulation had 20 plants; in 1994, it had 4 plants. The species has not been seen in the ACT since 1998, and annual surveys in the Orroral Valley between 2002 and 2013 have failed to detect the species.57
Brindabella Midge Orchid
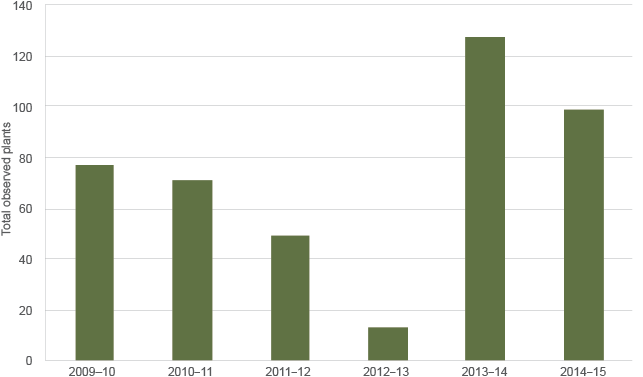
Since 2009, CPR has conducted annual monitoring of the Brindabella Midge Orchid population in late summer to early winter. In 2013, the survey methodology was changed to account for the recent finding that the orchid flowers nearly all year round.
After four years of decline, a large number of individuals were observed in 2014 and 2015 (Figure 7.11). This is consistent with reports that emergence and flowering of many orchid species vary widely from year to year, including threatened Australian orchids and overseas species. Climatic factors, as well as past flowering history of individual plants, may play a role in this interannual variability. However, little is known about the ecology, lifecycle and preferred conditions of this species.
Note: In 2012–13, the monitoring methodology was changed, and data from that year on represent the minimum number observed. Numbers for other years have been adjusted to include only plants observed over the same survey area.
Figure 7.11 Total count of Brindabella Midge Orchids, 2009–2015
The minimum number of plants known to have emerged in 2014 was 127; in 2015, it was 99, representing the largest number of emerging plants observed across the survey zone since annual monitoring began in 2009–10. Individuals were observed along the length of the monitored transect.
Button Wrinklewort
In December 2012, CPR qualitatively surveyed the habitat conditions of the known Button Wrinklewort populations, and identified any threats and mitigation actions that were required (Table 7.5).16 Although estimates provide a representation of the true population size at each location, estimates are often inaccurate by an order of magnitude when compared with counts of individuals. Resource constraints do not currently permit an individual count of this species, so estimates continue to be used to estimate population health.16
Table 7.5 Known Button Wrinklewort populations, threats and required mitigation actions, 2012
| Location | Observation | Threats | Recommended action |
|---|---|---|---|
|
Kintore Street |
No plants found; good native forb, and grass cover and diversity |
Mowing |
Resurvey December 2013 |
|
Baptist Church, Kingstona |
At least 71 plants, most flowering and healthy |
Car parking, mowing |
Improved management of car park |
|
St Marks, Bartona |
At least 31 plants, most carrying seed |
Biomass accumulation, woody weeds |
Burning of site, weed removal |
|
Campbell offices |
Estimated 80–90 plants found in 6 extant subpopulations; no plants found in one previously recorded small subpopulation |
Weeds (St John’s Wort) |
Weed control |
|
Tennant Street, Fyshwicka |
>400 plants counted; many seedlings observed and most plants carrying seed; site in good condition |
Minor weeds |
Weed control |
|
Woods Lanea |
At least 150 plants found across the 3 subpopulations; >38 plants counted in the northernmost population where no plants were seen in 2012 (3 of the 6 subpopulations were burnt in 2014 to reduce biomass) |
Road construction, infrastructure development, rubbish dumping (especially at the central site), weeds (St John’s Wort, wild oats) |
Improved roadside signage, weed control, rubbish control |
|
Stirling Ridge |
Estimated 1500–2000 plants, noting difficulty in estimating large populations over such a big area; overall, this site is in good condition with some weed issues |
Weeds |
Weed control |
|
Attunga Point |
Estimated 40–50 plants in fenced-off location with good native species cover |
None recorded |
None |
|
Blue Gum Point |
Estimated 250–300 plants; area is affected by regular mowing and weeds |
Mowing, weeds |
Weed control, improved mowing regime |
|
State Circle |
At least 20 plants |
Weeds (St John’s Wort, Cootamundra Wattle) |
Weed control |
|
Crace |
Site in good condition; no estimate of population size available |
None recorded |
None |
|
Jerrabomberra East Nature Reserve |
Translocated population in good condition; no estimate of population size available |
None recorded |
None |
|
Red Hill |
Sites in good condition with little change in population size; no estimate of population size available |
None recorded |
None |
|
HMAS Harman |
Site not monitored by ACT Government |
None |
None |
|
Majura Training Area |
Site not monitored by ACT Government |
None |
None |
a Updated 2015.
Canberra Spider Orchid
The Canberra Spider Orchid is a small terrestrial orchid that flowers sporadically along the slopes of Mounts Ainslie and Majura, and within the Majura Valley on land managed by the Australian Government Department of Defence at the Majura Training Area. A third and most recently discovered population is to the east of the Majura Valley in the Kowen Escarpment Nature Reserve. There are two other records of the species in the suburbs of Campbell and Aranda before their development; however, it has not been recorded in these areas for more than a decade. The species is not known to occur outside of the ACT.
The species is monitored on Mounts Majura and Ainslie during the flowering season by counting plants occurring in the known population areas. Details recorded include numbers of fertile flowers, pollination rates and incidence of grazing.
During the prolonged drought conditions in the early 2000s, very few individuals were recorded. In the past six years, there have been clear signs of recovery, and numbers appear stable with expected fluctuations due to seasonal conditions. More individuals were recorded in 2014 than in any previous year since 2012 (Figure 7.12).
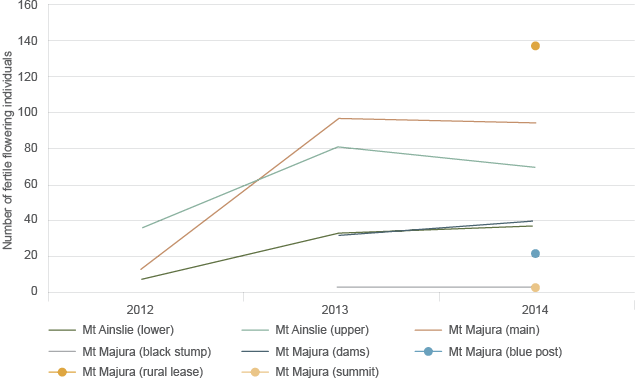
Figure 7.12 Canberra Spider Orchids recorded, number and location, 2012–2014
Two new subpopulations were discovered during the flowering season in 2014 by members of the public: on Mount Majura outside of the nature reserve and in the eastern foothills of Mount Ainslie. Another small new population was also located by a member of the public in the Kowen Escarpment Nature Reserve. The Mount Majura subpopulation was inspected by CPR staff in September 2014, and they recorded 138 plants across a 10 m × 10 m area. The remaining subpopulations consist of only a few plants each, and will be visited and inspected by CPR staff in spring 2015.
Habitat conditions are monitored annually, and threatening processes are addressed through management actions. Two fenced enclosures and a new set of small cages have been successfully used to reduce damage caused by kangaroos and rabbits on Mounts Majura and Ainslie. CPR has written a translocation plan as part of an Environment Protection and Biodiversity Conservation Act 1999 (Cwlth) (EPBC Act) assessment to prepare to translocate this species. However, further work is required to determine pollinator distribution and habitat characteristics before planting occurs. Translocation of the Canberra Spider Orchid is used in conjunction with threat management to improve the ecological resilience of the species.
Ginninderra Peppercress
Ginninderra Peppercress is endemic to the ACT and was first described in 1970 from a single collection in the suburb of Reid, but has not been seen in Reid since then. The plant was not seen again until 1993 when it was found on the floodplain of Ginninderra Creek in the Belconnen Naval Transmission Station. In 2001, the species was formally described. In October 2013, a small population was located by Nicki Taws (Greening Australia) in an area of Special Purpose Reserve in Mitchell.
The Naval Station is managed by the Australian Government Department of Defence, which monitors this species. The population has varied considerably, from a minimum of fewer than 50 plants in 1997 to a maximum of 3523 in 2006. The most recent estimate is 1137 in 2009.
At the Mitchell site, CPR staff conducted a population census in October 2012, and 50 plants were counted. All of these were tagged to help determine lifecycle characteristics of the species. In 2013–14, additional subpopulations were found by various local botanists, some of whom collected information about its abundance. For example, in 2014, Rob Armstrong reported counting four subpopulations, including the plants tagged by CPR. He located 32 individuals in the tagged subpopulation (a decline of 18 plants) and another 72 plants scattered across three additional subpopulations. In 2015, CPR undertook a more comprehensive survey of the north Mitchell grasslands. A total of 377 plants from five separate subpopulations were found. Seedlings were observed, and many plants were carrying seed. It is apparent from the variance in survey results across years at both sites that the number of individuals may vary greatly depending on site conditions (R Armstrong, Senior Ecologist, Umwelt [Australia], pers comm by email, 2 October 2015).
Between 2002 and 2008, seed was collected by the Australian National Botanic Gardens (ANBG) from the Lawson population and has been successfully germinated. By 2013, the ANBG seed bank contained more than 99 750 Ginninderra Peppercress seeds. Additions to the seed bank were made in 2015 from CPR collections at the north Mitchell population.
In the spring of 2013, Greening Australian, CPR, the ANBG and the ACT Parks and Conservation Service (PCS) translocated plants grown from seed collected or originating from the Lawson population into Crace (1050 plants) and Dunlop Nature Reserve (500 plants). Unfortunately, despite follow-up watering by Greening Australia, it appears that both translocation attempts failed. No live plants have been observed at either site since the end of summer in 2013. A number of factors could have contributed to this failure, including potting mix that may have become hydrophobic after planting, an especially hot summer (47 days reached 30 °C or more), and a very dry February and March. Further translocation efforts may test other ways of establishing new populations of the species.
Murrumbidgee Bossiaea
Murrumbidgee Bossiaea (B. grayi) was first described in 2009 when B. bracteosa was taxonomically divided into four new species (Scientific Committee State of the Environment Report reviewer, pers comm, 1 October 2015). In 2012, Murrumbidgee Bossiaea was declared a threatened plant species in the ACT under the Nature Conservation Act. Accordingly, Action Plan 34 was created to define conservation measures for the species, which include surveying and monitoring the ACT population. In spring 2013, the plants were surveyed to confirm the presence and size of Murrumbidgee Bossiaea populations at a number of ACT locations. Information was also collected on critical habitat parameters and any perceivable threatening processes. This will be used to inform management of the species in the ACT, as well as to inform the development of a long-term monitoring strategy.
These surveys identified 10 discrete population clusters in the ACT, with an estimated total population size of 2700–2900 individuals. Five distinct population clusters occur on the Murrumbidgee River, four distinct populations on Paddys River and one plant on the lower Cotter River. The species was recorded at elevations of 445–575 m. Landscape position and soil type seem to be the main drivers of where population clusters appear; all sites are located within incised river valleys, mostly on steep, rocky and skeletal soils.
The overall population size of Murrumbidgee Bossiaea suggests that immediate loss of the species is unlikely except in the event of an unforeseen impact. However, there are a number of small disjunct population clusters on the Paddys and Cotter rivers that are highly vulnerable, and their loss could lead to a range reduction. Given that all population clusters are disjunct, it is not clear if any genetic separation has occurred.
Most population clusters occur on reserved land, although three (including the two largest groups) are outside of reserve area within land designated as ‘mountains’ and ‘bushland’ under the ACT Territory Plan (see Chapter 5: Land). The major identified threats to the species include competition from native shrubs, low numbers and the isolation of some population clusters.
In 2014, CPR, the ANBG and volunteers collected seeds from 120 individuals from the two largest populations along Paddys River. A total of 21 965 seeds are held in storage at the National Seed Bank.
In 2015, seed germination trials were conducted by the Australian Native Plants Society. Preliminary results indicate that treatment of seed by either microwave heating, immersion in 95 °C water for two minutes or scarification with sandpaper significantly increases the proportion of seed germinating compared with untreated seed. Further germination and propagation trials will be conducted to increase knowledge on conservation options for this species.
Small Purple Pea
Five sites within the urban areas of Canberra have been known to support populations of the endangered Small Purple Pea. The largest of these populations occurs in the Mount Taylor Nature Reserve, with more than 300 plants recorded since surveying began in 2001. This site was severely burnt in the 2003 bushfires. A small population of approximately 10 plants exists on a vacant urban block in the suburb of Kambah, which has been fenced to protect the population. Small numbers of plants have also been recorded in the past at sites on Long Gully Road, at a rural block on Caswell Drive and at Farrer Ridge.
Monitoring of the Mount Taylor site indicates that – although this population has been stable, with numbers steadily increasing since plants were first tagged in 2001 – in 2011 there was a 53% decrease in abundance from the previous year. This increased to 68% in 2012. A number of factors may have influenced these declines, including rainfall, predation, ground temperatures, moisture levels and intraspecific competition. It is also likely that both the decreases and increases in abundance are, in part, due to natural population fluctuation, because the species is known to have dormancy periods of anywhere from one to nine years.58 In 2004, to avoid overly trampling the site and new regrowth after the fire in 2003, a full survey was not carried out, and only untagged plants were recorded and tagged (Figure 7.13). Recruitment levels have steadily dropped since the peak abundance in 2009.
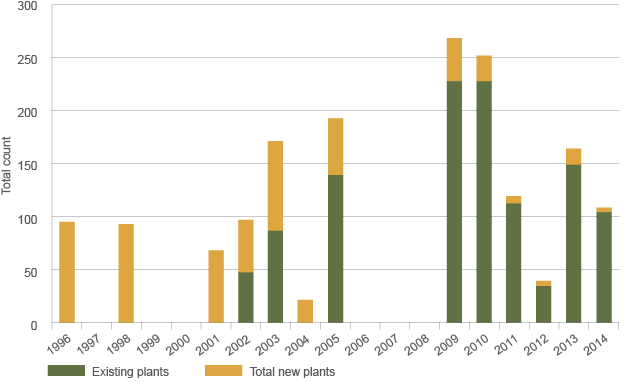
Figure 7.13 Small Purple Pea recordings at Mount Taylor, 1996–2014
The population at McTaggart Street in Kambah appears stable despite no increase in annual flowering plants since surveying began in 2002 (Table 7.6). It should be noted that in 2012 only one plant was recorded, and it suffered grazing after initial observation. General site condition and diversity are very good, with large numbers of disturbance-sensitive forbs present in the spring of 2013. It would appear that there has been a positive response to the most recent burn, with widespread flowering and growth of native species, and limited spread of broadleaf and woody weeds. A total of 23 plants have been tagged at this site. Many of these individuals have not been recorded for a number of years, and no new plants have been identified since 2003.
Table 7.6 Small Purple Pea abundance, McTaggart Street, Kambah, 2000–2014
| Year | 2000 | 2001 | 2002 | 2003 | 2004 | 2009 | 2010 | 2011a | 2012 | 2013 a | 2014 |
|---|---|---|---|---|---|---|---|---|---|---|---|
|
Total plants |
10 |
7 |
10 |
7 |
10 |
7 |
8 |
8 |
1 |
9 |
8 |
a Ecological burn in June of this year.
The Caswell Drive population was thoroughly searched by ecological consultants from Biosis. The same two plants from 2013 were located, with developed flowers and pods.
Tarengo Leek Orchid
This small orchid only occurs at a site in Hall in the ACT, along with five other sites with small populations in NSW. CPR monitors the Tarengo Leek Orchid each year.59 The abundance of this species fluctuates each year, with a very weak, positive trend (Figure 7.14). Population fluctuations do not appear to be correlated with weather patterns. Given the large fluctuations in numbers, it is imperative to continue monitoring this species every year, and for researchers to work closely with site managers.
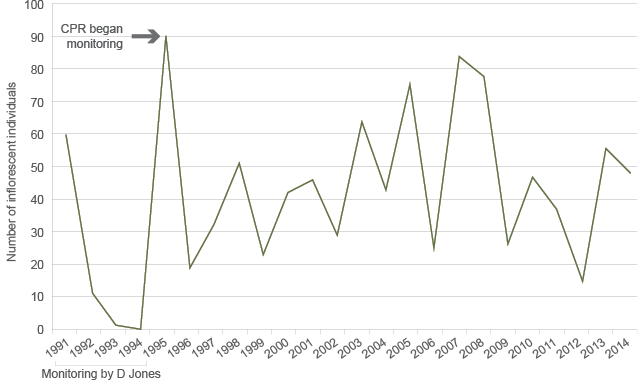
CPR = Conservation and Planning Research
Figure 7.14 Tarengo Leek Orchid abundance, Hall Cemetery, 1991–2014
Tuggeranong Lignum
Since 1999, a series of surveys and opportunistic sightings have identified a total of 13 individuals of Tuggeranong Lignum – a sprawling woody shrub – on the eastern bank of the Murrumbidgee River. In 2013, all of these plants were still alive. No plants are known to persist on the western bank of the river. A survey in February 2015 found that 12 of the plants were still alive. A male plant, first observed in 1997 on the banks of the Murrumbidgee, appears to have died. This plant was in an area subject to a great deal of disturbance from flooding and sand movement, and was also being encroached upon by Blackberry.
Translocation of clonally grown Tuggeranong Lignum has been attempted on a number of occasions since 2010. Initially, 93 plants were translocated into the Murrumbidgee River Corridor in locations close to the wild plants. None of these plants are known to have survived; there are a number of possible causes for this failure, including extensive flooding and heavy weed infestation at the site. In 2013, CPR staff translocated 19 plants into suitable habitat on Point Hut Hill and another 17 plants into Bullen Range Nature Reserve near the old record from Red Rocks Gorge. All of the plants translocated into Bullen Range have since died. However, as of February 2015, 10 plants still persist at Point Hut Hill. Anecdotal observations of these plantings indicate that plants on sheltered southerly aspects appear to survive longer than on other aspects.
In 2013, CSIRO performed genetic testing to identify how many wild individuals there were (plants sprawl across each other in some sites, making it difficult to determine numbers by observation) and how many of these genotypes are reflected in the surviving translocated plants. Unfortunately, the results were inconclusive due to the limited number of loci that could be used in the analysis.
Following the loss of one of the wild individuals, CPR and the ANBG decided to collect material from all 12 wild plants and 10 translocated plants so that the species could be propagated. This project is designed to secure the current genetic diversity of the species by having at least one representative of each plant growing in the permanent collection at the ANBG. Additional material grown by ANBG may be made available for future translocation attempts.
Threatened ecological communities
Why is this indicator important?
An ecological community is defined as a naturally occurring group of native plants, animals and other organisms that are interacting in a unique habitat. The community’s structure, composition and distribution are determined by environmental factors such as soil type, position in the landscape, altitude, climate and water availability.
The native plants and animals within an ecological community have different roles and relationships that, together, contribute to the healthy functioning of the environment and to the provision of ecosystem services.
Current monitoring status and interpretation issues
Reporting for this indicator focuses on the ecological communities listed as threatened under the ACT Nature Conservation Act or the EPBC Act. The ecological communities are generally described in terms of the main vegetation type (eg Yellow Box – Blakely’s Red Gum grassy woodland, Natural Temperate Grassland). This indicator reports on the state and/or trend of the extent and, where possible, the condition of each listed threatened ecological community. Although the indicator focuses on the extent and condition of the main vegetation type, it is assumed that this also indicates the state of the ecological community as a whole.
The quality and quantity of the reporting are commensurate with the monitoring data available in the reporting period.
Where data are available, the extent and condition of nonlisted communities are reported under ‘Other ecological communities’.
Vegetation condition can be assessed from a number of different perspectives, such as degree of land cover or degradation, ecological productivity and regeneration capacity, production capacity for economic goods, extent and type of past disturbance, presence of different plant species, or important habitat features for wildlife. Vegetation in good condition from one perspective (eg grazing) may be in poor condition from another (eg supporting native biodiversity conservation). In the ACT, there does not appear to be any consistency in the use of different vegetation condition monitoring systems.
There are also significant challenges involved in the analysis and presentation of data for this indicator. This is because the relevant reports and data all contain different methods for classifying (and therefore surveying and mapping) ecological communities, particularly woodlands. The report by Maguire and Mulvaney60 provides a reasonable estimate (based on best available data at the time of publication) of the extent of EPBC Act condition and ACT-listed woodland across the ACT (figures are in the report). There are no comparable figures for other woodland types or open forest. This issue has been compounded by the lack of consistent vegetation classification or mapping within the ACT. These anomalies mean that it has not been possible to accurately report on the extent and condition of ecological communities in the ACT in this reporting period.
Significantly, this matter is in the process of redress. Using a standard classification system, the ACT vegetation and ecological communities are currently in the process of being mapped, based on the methods described in Armstrong et al.61
What does this indicator tell us?
Section 101 of the Nature Conservation Act requires the Conservator of Flora and Fauna to prepare an action plan for each species or ecological community that has been declared vulnerable, critically endangered or endangered. Action plans must contain proposals for the identification, protection and survival of the community or species, including the identification of any critical habitat.
The ACT has three broad strategic action plans, which include action plans for ecological communities and individual action plans for species:
- The ACT Lowland Woodland Conservation Strategy (Action Plan 27) contains nine individual plans (Brown Treecreeper, Hooded Robin, Painted Honeyeater, Regent Honeyeater, Small Purple Pea, Superb Parrot, Swift Parrot, Tarengo Leek Orchid, Yellow Box – Blakely’s Red Gum grassy woodland).
- The ACT Lowland Native Grassland Conservation Strategy (Action Plan 28) contains six individual plans (Grassland Earless Dragon, Striped Legless Lizard, Golden Sun Moth, Perunga Grasshopper, Button Wrinklewort, Natural Temperate Grassland).
- The ACT Aquatic Species and Riparian Zone Conservation Strategy (Action Plan 29) contains five individual plans (Macquarie Perch, Murray River Crayfish, Trout Cod, Two-Spined Blackfish, Tuggeranong Lignum).
This indicator reports on the subjects of the three broad action plans.
Woodlands
Extent of ACT-listed woodlands
In 2011, mapping was completed of the extent of Yellow Box – Blakely’s Red Gum grassy woodland (Box–Gum Woodland) listed under Australian Government and ACT legislation. This reinterpreted data collected in 1995–97 and 2001–05.60
Across the ACT, 13 765 ha of Box–Gum Woodland was mapped. The current nature reserve network contains 5699 ha of Box–Gum Woodland, including 3364 ha of woodland that meets the listing criteria under the EPBC Act. For both the total remaining extent of Box–Gum Woodland listed under ACT legislation and that component of the ACT total listed under the EPBC Act, a little more than 40% is within the ACT conservation reserve network.
Since the previous mapping in 2004, about 1206 ha (including 933 ha of woodland listed under the EPBC Act) has been added to the reserve network, and around 192 ha of woodland has been lost to urban development (Table 7.7).
Table 7.7 Extent of listed Yellow Box – Blakely’s Red Gum grassy woodland in the ACT
| Box–Gum Woodland | Total extent mapped in 2004 (ha) | Total extent mapped in 2011 (ha) | Woodland lost to urban development since 2004 (ha) | Woodland in conservation reserves (ha) | Woodland added to reserve network since 2004 (ha) |
|---|---|---|---|---|---|
|
ACT-listed |
12 034 |
13 765 |
192 |
5 699 |
1 206 |
|
Commonwealth-listed |
Not mapped |
8 151 |
Unknown |
3 364 |
933 |
ha = hectare
Note: Determination of the extent of Box–Gum Woodland listed under the Nature Conservation Act 2014 (ACT-listed) and the Environment Protection and Biodiversity Conservation Act 1999 (Commonwealth-listed) requires ground validation by skilled ecologists in many cases, and it is likely that the actual figures vary from that shown in this table. This means that it is possible that Commonwealth-listed Box–Gum Woodland is underestimated, and ACT-listed Box–Gum Woodland is overestimated.
Source: Umwelt in ACT Scientific Committee18
Overall, the 2011 mapping identified 1731 ha more Box–Gum Woodland in the ACT than the 2004 mapping. However, there was also approximately 2000 ha of vegetation that was mapped in 2004 as Box–Gum Woodland, but classified in the 2011 mapping as not being part of the community. Thus, about 3700 ha of woodland was mapped differently in the 2004 and 2011 maps.
Woodland areas mapped in 2004 as Box–Gum Woodland, but not included in the total area of the community in 2011, mainly consisted of:
- 190 ha lost to urban development (mainly in Gungahlin)
- about 1200 ha of woodland in the Naas Valley and Murrumbidgee River Corridor south of Tharwa; this woodland occurs on ridges and steeper slopes above the Naas and Murrumbidgee valleys (such as Fitzs Hill) where Yellow Box may be present as a subdominant species, but the community is now classified as Norton’s Box (Eucalyptus nortonii)–dominated shrubby open forest
- about 350 ha of woodland along Uriarra Road, which now has some areas of cultivation and other areas where exotic perennial grasses predominate
- about 200 ha in the vicinity of central Molonglo.
The main areas of Box–Gum Woodland mapped in 2011 that were not included in the 2004 community primarily comprised:
- about 1600 ha of grazed woodland in the Murrumbidgee Valley, between Pine Island and the Tharwa Sandwash, where the ground layer is now dominated by native grasses
- about 450 ha in the proposed suburbs of Kenny and Throsby
- about 300 ha on the lower slopes of Mounts Ainslie and Majura, and about 275 ha in the Callum Brae and Isaacs Ridge nature reserves
- 260 ha in the vicinity of Uriarra Village
- about 200 ha in the Moncreiff, Taylor and Jacka areas of Gungahlin.
Box–Gum Woodland in Gungahlin
The Box–Gum Woodlands within Gungahlin are some of the largest, best-connected and most diverse patches of this vegetation type remaining across the former distribution of the community in south-eastern Australia. In the context of the distribution of the remaining Box–Gum Woodland, the Goorooyarroo – Mulligans Flat woodland patch north of Bonner is the largest area remaining in the ACT. Because of its high connectivity, size and diversity, this is a key area for maintaining functioning Box–Gum Woodlands. The woodland at Kenny is particularly notable in that it supports old-growth Yellow Box (300–450 years old), which are part of a Yellow Box on lowland valley flats (below 620 m) vegetation type that has been extensively cleared and now has a highly restricted distribution. It is noted that the condition of the woodland at Kenny is influenced by site quality; Kenny contains deeper soils and increased water supply due to its unique subsoil properties.62
Kenny also features small areas of Ribbon Gum adjacent to exotic grassland that was formerly part of the Natural Temperate Grassland zone. These small areas represent a rare and complete example of a lowland woodland to Natural Temperate Grassland catenary sequence (noting that the Natural Temperate Grassland is now largely exotic).62
Woodland condition in Canberra Nature Park
The condition of around 2145 ha of lowland woodland was mapped in separate surveys during 2001–2004 and 2012–13. These surveys were then compared.63
Figure 7.15 shows the condition classes mapped during 2001–2004, and Figure 7.16 shows the condition classes as remapped in 2012–13. Areas shown as blank in the 2001–2004 map, but coloured in the 2012–13 map, were exotic vegetation at the time of first mapping, but are now predominently native.
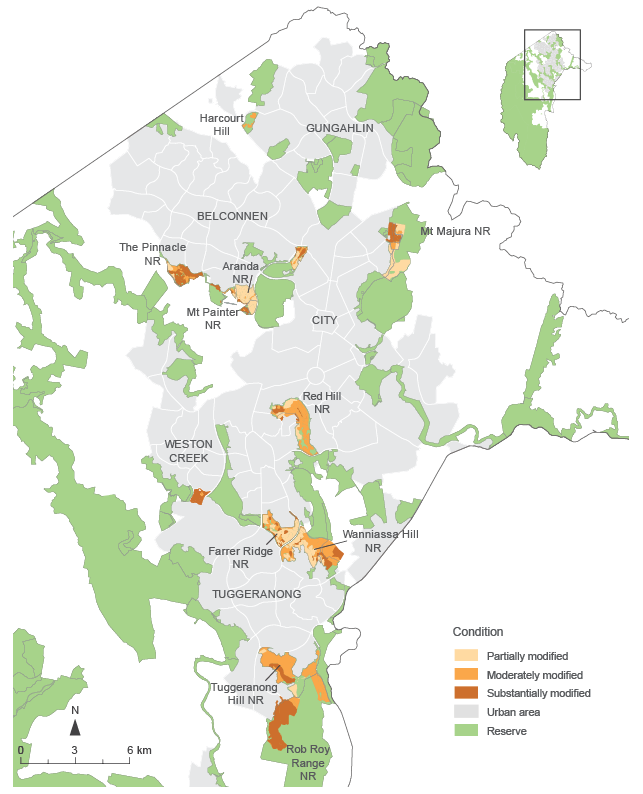
NR = nature reserve
Figure 7.15 ACT lowland woodland condition classes, 2001–2004
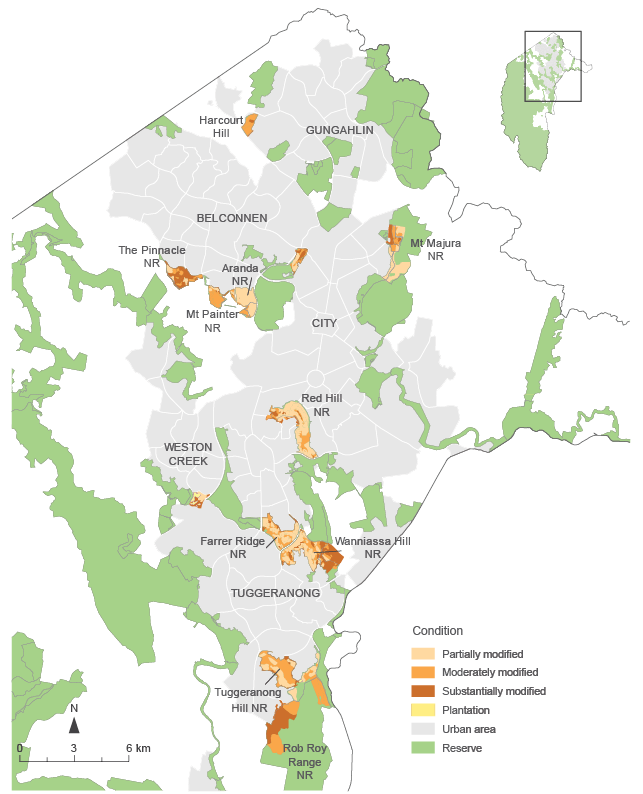
NR = nature reserve
Figure 7.16 ACT lowland woodland condition classes, 2012–13
There has been a general and significant improvement in condition across the surveyed lands during the approximately 10-year period between mapping exercises (Table 7.8). During this time, there has been a 52% increase in the area of land in the highest condition class and a 20% reduction in the area of land in the lowest condition class. The largest expansions of partially modified vegetation have been at Red Hill and Tuggeranong Hill. The greatest reductions of poor condition vegetation have occurred at Rob Roy and Tuggeranong Hill.
Table 7.8 Woodland condition change across mapped areas in the ACT, 2001–2004 to 2012–13
| Conditiona | 2001–2004 (ha) | 2012–13 (ha) | Change |
|---|---|---|---|
|
Substantially and severely modified |
712 |
567 |
–20% |
|
Moderately modified |
890 |
751 |
–16% |
|
Partially modified |
543 |
827 |
52% |
ha = hectare
a Condition assessment classifications:64
Substantially modified. Low to very low diversity of native species, mainly disturbance-tolerant native grasses, and usually a high cover of exotic perennial and annual species.
Moderately modified. Moderate diversity and cover of native species, but mainly disturbance-tolerant species. These species include Common Everlasting (Chrysocephalum apiculatum), fuzz weed species (Vittadinia spp.) and Variable Plantain (Plantago varia).
Partially modified. High diversity and cover of native species, including disturbance-sensitive species (eg lilies, tall daisies, orchid and pea species).
Note: A comprehensive list of disturbance-tolerant (or common) species and disturbance-intolerant (or significant) species can be obtained from Rehwinkel.65
Some care needs to be taken in the comparison of the results, because 2001–2004 were drought years in which vegetation was hard to assess, and the comparison is only between two surveys, rather than many. The exact cause of the observed improved condition is not known and likely to be a combination of many factors, including favourable seasonal conditions and some land management actions, particularly weed control. Nevertheless, a positive trend is evident.
There were 14 different sites mapped, 10 of which were located within Canberra Nature Park. The improvement in condition is slightly better if the reserve areas surveyed are considered alone (Table 7.9).
Table 7.9 Woodland condition change for reserve areas only, 2001–2004 to 2012–13
| Conditiona | 2001–2004 (ha) | 2012–13 (ha) | Change |
|---|---|---|---|
|
Substantially and severely modified |
506 |
368 |
–27% |
|
Moderately modified |
761 |
655 |
–14% |
|
Partially modified |
527 |
804 |
53% |
ha = hectare
a Condition assessment classifications:64
Substantially modified. Low to very low diversity of native species, mainly disturbance-tolerant native grasses, and usually a high cover of exotic perennial and annual species.
Moderately modified. Moderate diversity and cover of native species, but mainly disturbance-tolerant species. These species include Common Everlasting (Chrysocephalum apiculatum), fuzz weed species (Vittadinia spp.) and Variable Plantain (Plantago varia).
Partially modified. High diversity and cover of native species, including disturbance-sensitive species (eg lilies, tall daisies, orchid and pea species).
Note: A comprehensive list of disturbance-tolerant (or common) species and disturbance-intolerant (or significant) species can be obtained from Rehwinkel.65
Woodland condition on Red Hill
From 1990 to 2011, the condition of ACT-listed lowland woodland was mapped in relation to weed invasion and weed control. Weeds were mapped as to whether they occupied 50% or more of the understorey (poor condition), 50–25% of the understorey (moderate condition), 5–25% of the understorey (high condition) or less than 5% of the understorey (very high condition).
In 1990, weeds dominated 53% of the hill, and decreased to 13% in 2011 (Table 7.10). Correspondingly, in 1990, there was 21 ha of very high quality woodland on the hill, and in 2011 there was 131 ha (M Mulvaney, Senior Environmental Planner, Conservation Research, EPD, pers comm, 15 August 2015).
Table 7.10 Condition of woodland on Red Hill, 1990, 2004 and 2011
| Condition of woodland | Area 1990 (ha) (% of total) |
Area 2004 (ha) (% of total) |
Area 2011 (ha) (% of total) |
|---|---|---|---|
|
Poor or substantially modified |
168 (53%) |
29 (9%) |
40 (13%) |
|
Moderate or secondary grassland |
71 (22%) |
26 (9%) |
114 (36%) |
|
Moderately modified (equivalent to either moderate or high in the 1988 and 2011 surveys) |
– |
174 (63%) |
– |
|
High |
56 (18%) |
– |
29 (8%) |
|
Very high or partially modified |
21 (7%) |
46 (16%) |
131 (42%) |
ha = hectare; – = not applicable
Vegetation of the Kowen, Majura and Jerrabomberra districts
The Yellow Box – Apple Box woodland and Yellow Box – Blakely’s Red Gum woodland communities are both components of the White Box – Yellow Box – Blakely’s Red Gum grassy woodland and derived grasslands listed under the EPBC Act, and Yellow Box – Blakely’s Red Gum grassy woodland listed under the Nature Conservation Act. At the time of writing, 8151 ha of vegetation in the ACT was regarded as meeting EPBC Act criteria, and 13 765 ha met the Nature Conservation Act criteria.60 Conservation reserves within the ACT contained 3364 ha of the EPBC Act–listed community and 5699 ha of the Nature Conservation Act–listed community.60
Grasslands
Extent of Natural Temperate Grassland
Natural Temperate Grassland is one of the most threatened natural plant communities in Australia. Before European settlement, such grasslands occupied 11% of the ACT. Today, they occupy less than 1% of the ACT, and what remains is degraded and continually threatened by human activity and invasion by exotic plant species.66
The once-extensive Natural Temperate Grassland within the ACT is now highly fragmented and greatly reduced in area. Grasslands are now confined to 38 small and isolated patches in the ACT. About 1000 ha of these patches are in a more or less natural condition, and a further 550 ha are in poorer condition. The patches of grassland are embedded in highly degraded grasslands dominated by weeds (plant species of exotic origin or native species not natural to the area). These isolated patches range in size from less than 1 ha to 300 ha.66
Natural Temperate Grassland is declared an endangered ecological community under both the EPBC Act and the Nature Conservation Act. However, Action Plan 28 only considers grasslands below 625 m to be part of the endangered ecological community, whereas the EPBC Act considers grasslands up to 1200 m to be part of the community. To date, 1049 ha of ACT grasslands below 625 m and 207 ha above 625 m have been mapped. For grasslands below 625 m, there has been a slight decline in the extent of the grasslands, from 1106 ha to 1049 ha. This change is mainly attributable to more accurate mapping, which excluded some native pasture in the Majura and Jerrabomberra valleys that had been formerly mapped as Natural Temperate Grassland.
Trends in grassland condition
A 2014 research project examined trends in a range of floristic and vegetation structure attributes across 24 monitoring plots located in the grasslands and grassy woodlands of the ACT in 2009, 2012, 2013 and 2014 (Figure 7.17):67
- Overall, native species richness and the floristic value score (FVS),64 remained relatively stable (less than ±25% change) at most plots. Native species richness showed the least amount of change.
- Trends in the FVS were driven by the presence or absence of several indicator species. (Indicator species are grazing-intolerant or declining species. It is thought that these species are rare for two reasons. Firstly, some species have always been rare, particularly species that are restricted in distribution. Secondly, many species are thought to have undergone serious declines since European settlement, from disturbances such as overgrazing and fertiliser use.)
- Exotic species richness fluctuated to a greater degree, especially between 2013 and 2014, with two-thirds of plots showing more than a 25% increase.
- Cover of exotic annual grasses and exotic broadleaves also increased significantly between 2013 and 2014. Some sites had an increase in significant weed species richness in 2014, although numbers remained low.
- Plots that showed considerable declines in both native species richness and the FVS during the most recent survey period (2013–14) were Dunlop Nature Reserve, Jerrabomberra West Nature Reserve (inside the enclosure), the Googong Foreshores and Mount Painter Nature Reserve.
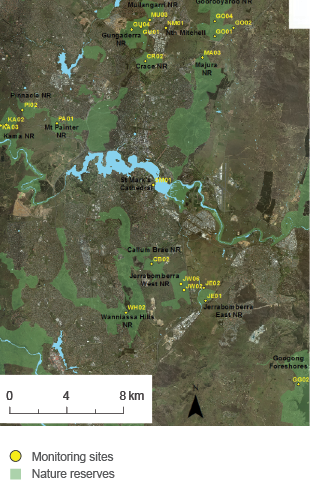
Figure 7.17 Location of surveyed plots across the northern ACT
Community case study 7.1 shows how groups in the ACT have been working to improve the state of the environment.
Community case study 7.1
ParkCare and Landcare groups in the ACT
For the past 25 years, ParkCare and Landcare groups have been working across the ACT’s reserves and urban open space network to improve the state of the environment. These groups provide an opportunity for enthusiastic volunteers of all ages, backgrounds and abilities to become involved in planting trees, controlling weeds, repairing tracks, monitoring the environment, protecting natural and cultural heritage values, controlling erosion and much more. They take pride in ensuring that their ‘local patch’ is properly managed and appreciated.
Friends of Aranda Bushland is one of more than 60 ParkCare and Landcare groups within the ACT. This group of about 60 members has been progressively rehabilitating the Aranda Bushland since the 1990s. A core group of 20 active members regularly carries out weeding and restoration works using planting, woody weeds, logs and ‘geofabric’ to reduce erosion and stop gullies from forming. Seed is also collected from the area, and used for propagation and planting. The group is working towards short-, medium- and long-term goals, and strives to educate the public through guided walks, interpretive signs and publishing Our patch – a photographic field guide to the flora of the ACT, now in its second edition. For the past 25 years, this group has achieved an almost complete reduction in weed infestation and, by planting locally indigenous Snow Gums, contributed to the restoration of Snow Gums in the Frost Hollow community.
The ACT Government and local community groups play an important role in supporting these volunteer groups by providing materials, training and on-ground support; introducing new volunteers; and networking and information sharing. This support comes through the ACT Government ParkCare Coordinator and Support Officer (ACT Parks and Conservation Service); the Regional Landcare Facilitator (Environment and Planning Directorate); the Southern ACT, Molonglo and Ginninderra catchment groups (through catchment and Waterwatch coordinators); and Greening Australia. Landcare ACT, the recently formed peak body, provides a voice for community Landcare and provides a connection to the national Landcare movement.
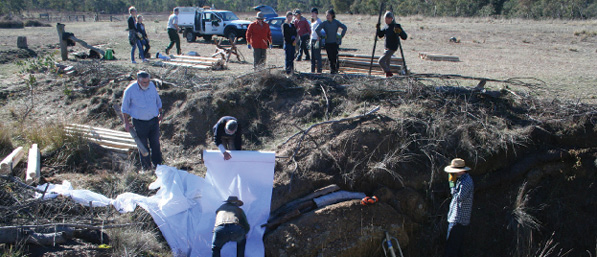
Friends of Aranda Bushland volunteers and Radford College students installing geofabric and pine logs to block off erosion at the head of a gully, June 2013. Photo: Professor Ian Falconer
Other ecological communities
Riparian communities
There are 17 riparian vegetation communities in the ACT.68 The most recent systematic surveying of these communities was in 2009–2011.
The Murrumbidgee River flows for approximately 66 km south to north through the ACT, and contains close to 132 linear kilometres of riparian land (Figure 7.18).
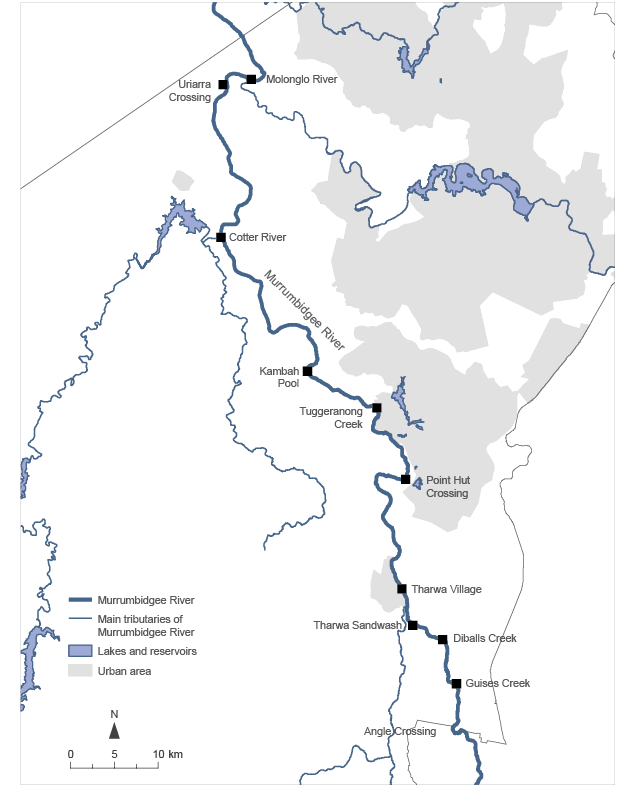
Figure 7.18 Murrumbidgee River in the ACT
In 2009, the vegetation and habitat was surveyed in key riparian zones along the Murrumbidgee River in the ACT, to identify the extent and condition of the riverine vegetation communities.69 The survey found the overall state of the riparian zone vegetation in the ACT section of the Murrumbidgee River to be poor, and both the riparian zone and river valley environments appeared to be under significant stress.
There has been no comparable survey since 2009, so it is not possible to report on the current condition of the riparian zone vegetation in the ACT section of the Murrumbidgee River.
In 2011, a similar survey was conducted for the major tributaries of the Murrumbidgee in the ACT.70 The objectives of this project were to map the distribution and assess the condition of the riparian vegetation along the five main tributaries of the Murrumbidgee River in the ACT (the Naas, Gudgenby, Paddys, Cotter and Molonglo rivers; Figure 7.19).
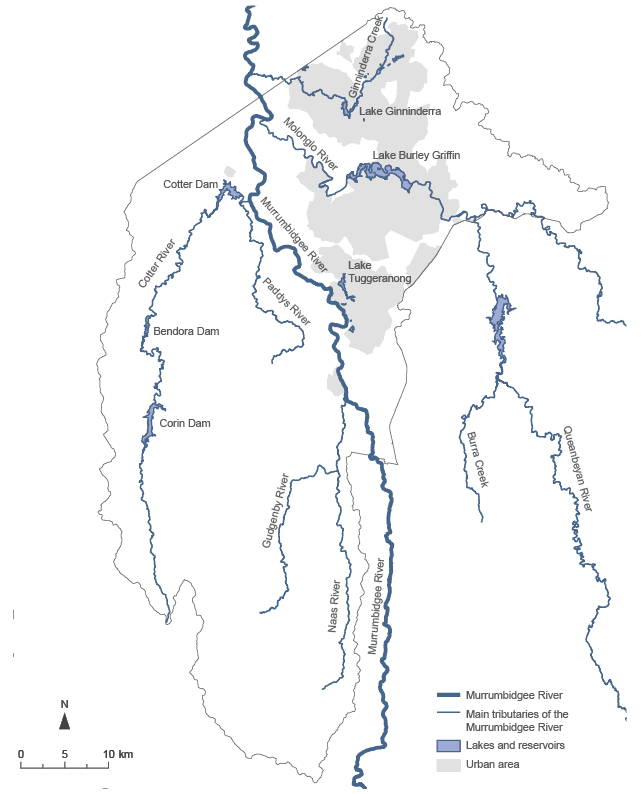
Figure 7.19 Major tributaries of the Murrumbidgee River in the ACT
The condition of the riparian and associated hillslope vegetation along the surveyed rivers was found to vary widely across the region and within each river. Along the Cotter River, the condition was extremely good in Namadgi National Park, but poorer in the former softwood plantation area of the lower Cotter. The Naas, Gudgenby and Paddys rivers demonstrate the long-term effects of rural land use. However, in the sections of these rivers in Namadgi National Park, the riparian vegetation has recovered to good or even excellent condition. Parts of these waterways in rural land were in moderate to good condition, especially where there had been some effort to restrict stock access to the riverbanks. Many areas contain varying levels of exotic vegetation, but there are still sufficient pockets of residual natives to allow improvement of riparian condition with better rural land management. Both the upper Molonglo River in the Kowen Gorge area and the lower Molonglo River downstream of Coppins Crossing retain riparian and some hillslope vegetation in good condition. Between Molonglo Gorge and Coppins Crossing, the river and the riparian zone have been severely affected by urban, infrastructure and other development.
The encroachment – and, in some cases, dominance – of weed species is a pervasive feature throughout all the river sections surveyed. This is especially true for Blackberry, willows, poplars and pine wildings.
Sphagnum bogs and fens
The ACT sphagnum bogs and fens ecological community covers almost 6 square kilometres of the ACT. The Directory of Important Wetlands in Australia lists 10 ACT wetlands that are part of the alpine sphagnum bogs and associated fens ecological community as nationally important wetlands: Cotter Source Bog, Cotter Flats, Ginini and Cheyenne flats, Rock Flats, Rotten Swamp, Scabby Range Lake, Snowy Flats, Nursery Swamp, the upper Cotter River and the upper Naas Creek (Figure 7.20). The ecological community is at its most northerly extent in the ACT.
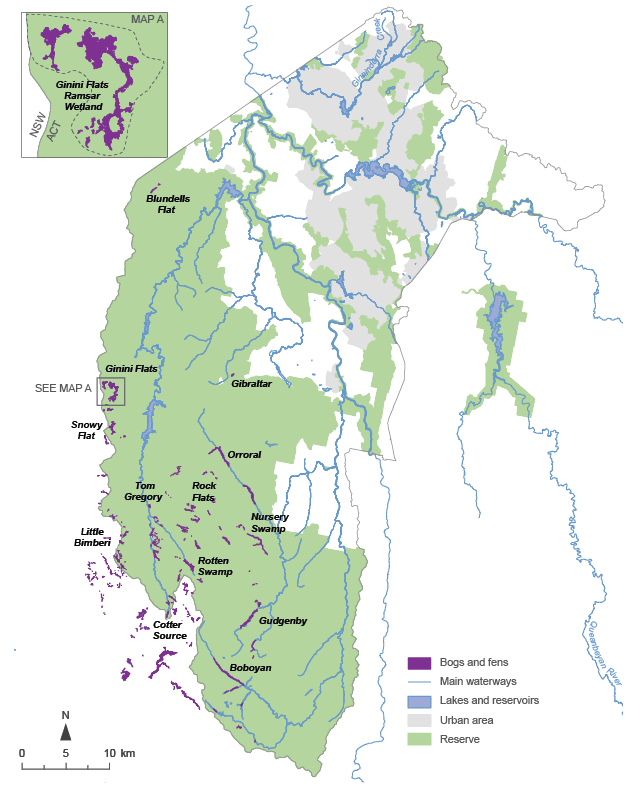
Figure 7.20 ACT sphagnum bog and fen ecological communities
In January 2009, the Australian Government, under the EPBC Act, listed the alpine sphagnum bogs and associated fens ecological community as an endangered ecological community due to:
- its small geographic distribution, coupled with significant demonstrable threats (including climate change and fire)
- the continued decline of functionally important species
- the severe reduction of the community’s integrity across its range.
The ACT sphagnum bogs and fens ecological communities include the Ginini Flats Wetland Complex (Figure 7.21). In 1996, this complex was designated as a Wetland of International Importance under the Ramsar Convention. The site is towards the northern climatic extreme for alpine sphagnum bog wetlands, and is the largest intact bog and fen community in the Australian Alps. The site also provides habitat for Corroboree Frogs.
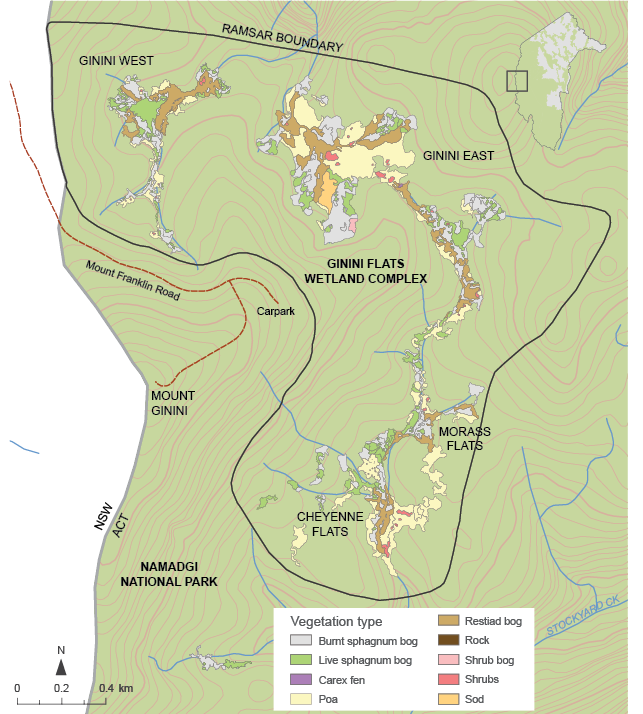
Figure 7.21 Ginini Flats Wetland Complex
Connectivity of terrestrial native vegetation
Why is this indicator important?
The diversity and resilience of ecological communities relate directly to their spatial configuration, patch size, contiguity, condition and connectivity. Connectivity conservation seeks to improve wildlife habitat and habitat links across the landscape. Recent CSIRO work suggests that most animals of southern Australian woodlands and forests will not usually cross a canopy gap of more than 100 m, and will not travel more than 1.1 km from a patch of at least 10 ha of suitable living habitat (see Doerr et al 2010, cited in Barrett & Love71). Thus, the extent and spatial arrangement of habitat and canopy are essential to understanding wildlife movement, and how connectivity can be most readily restored.
Restoration of habitat and connection increases effective habitat size and access, enables migration and movement to avoid temporary stressors, and aids the recovery potential and recolonisation of degraded areas.
Large stretches of continuous native vegetation communities are often necessary for maintaining viable populations of species. Fragmentation (eg due to clearance or major roads) can cause populations (especially small populations) to become vulnerable and can reduce gene pools through loss of biodiversity.
Current monitoring status and interpretation issues
This indicator reports on the state and/or trend of the extent and, where possible, the connectivity of terrestrial native vegetation in the ACT. The quality and quantity of the reporting are commensurate with the monitoring data available in the reporting period.
In 2012, available vegetation and land-use data, and innovative fine-scale modelling techniques and tools were used to model fauna habitat and connectivity values across the ACT.71
Across the ACT, SPOT-5 satellite imagery and radar measurements of tree density were used to establish a map of tree canopy, accurate to the single paddock tree scale.
Woodland, forest and generalist habitats were mapped and rated by using a combination of about 15 existing vegetation, street tree and land-use maps; satellite foliage cover and tree density analysis; and the spatial relationship of a particular habitat patch to another habitat patch. Large patches close to other habitat patches scored highly, while isolated small patches scored lowly.
Researchers then took random pairs of points from within any two patches of habitat in the ACT and nearby region, and determined what the easiest route was for a woodland, forest or generalist species to get from one point to the other. This analysis was repeated 550 000 times. Paths through well-connected habitat were repeatedly used to connect differing habitat patch pairs, and these well-used paths were identified as regional links.
Although regional links may be the least-cost pathways, they may not be able to be used by wildlife. This was checked by overlaying a map showing where connections between stepping-stone trees exceed 100 m (local links) and the distribution of habitat patches greater than 10 ha. Existing habitat patches of 5–10 ha were also identified as areas of potential restoration focus.
This modelling, in conjunction with modelling conducted for the Gungahlin Strategic Assessment and the Jarramlee Offset (see information on environmental offsets in Section 7.3.2), provides the data for reporting on this indicator.
The modelling was conducted in accordance with four significant ecological principles:
- Modelling was conducted for both habitat settlement and habitat dispersal.72
- Gap-crossing thresholds were identified (Figure 7.22).
- Habitat condition modelling was based on vegetation attributes – structure and composition – known to influence habitat suitability for both settlement and dispersal.
- A cost–benefit approach was adopted to assess the costs of movement by an organisms across a landscape versus the benefits of access to habitat (defined as habitat condition). This cost–benefit assessment establishes a measure of spatial configuration known as the Neighbourhood Habitat Area.
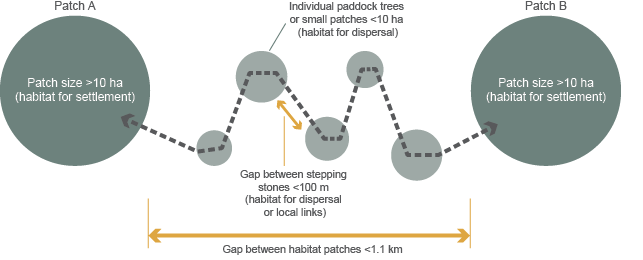
ha = hectare; km = kilometre; m = metre
Note: Darker patches represent habitat for settlement. The smaller light-grey patches show habitat for dispersal, and may consist of either individual paddock trees or small patches (<10 ha).
Figure 7.22 Average gap-crossing thresholds
What does this indicator tell us?
The Barrett and Love analysis71 reveals the parts of the landscape that are key to existing wildlife movement and the areas where functioning connections can be restored with the least effort. It also highlights areas of key habitat or linkage value that need special consideration. Examples of how the data can be applied – including restoration and development in the Majura Valley, and conservation assessment within the Gungahlin Strategic Assessment, along with key woodland habitat and linkages across the ACT – are shown in Figures 7.23–7.25.
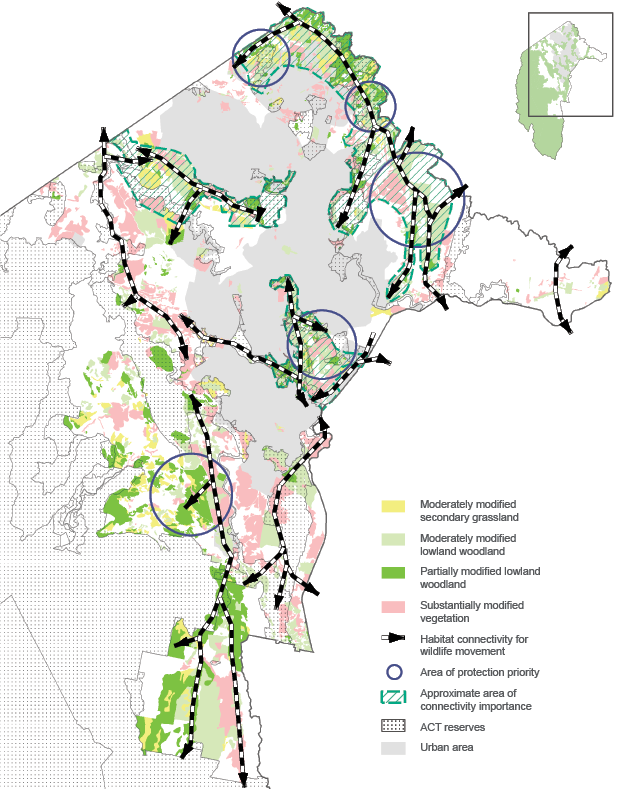
Source: Map provided by Conservation and Planning Research
Figure 7.23 ACT lowland woodlands condition and connection
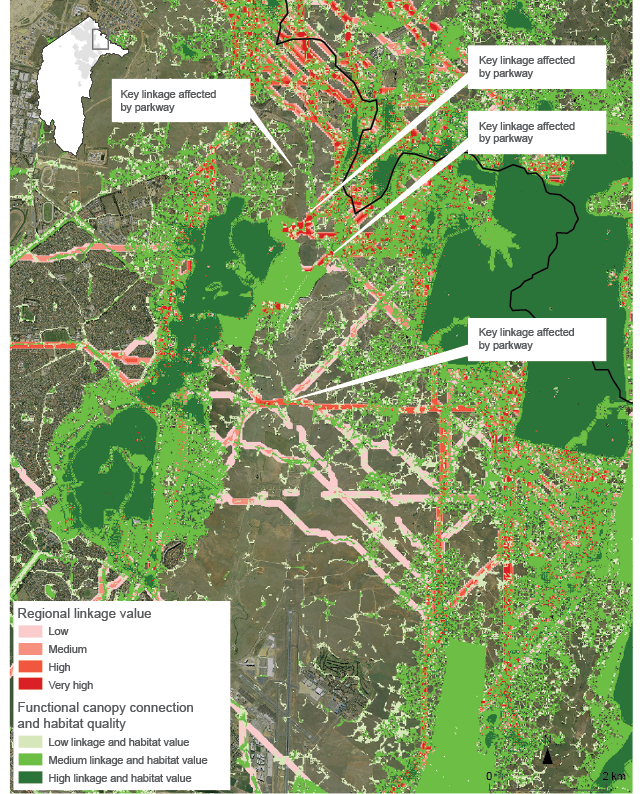
Source: Map provided by Conservation and Planning Research
Figure 7.24 Use of the connectivity analyis to identify and protect key woodland wildlife movement points cut by the Majura Parkway
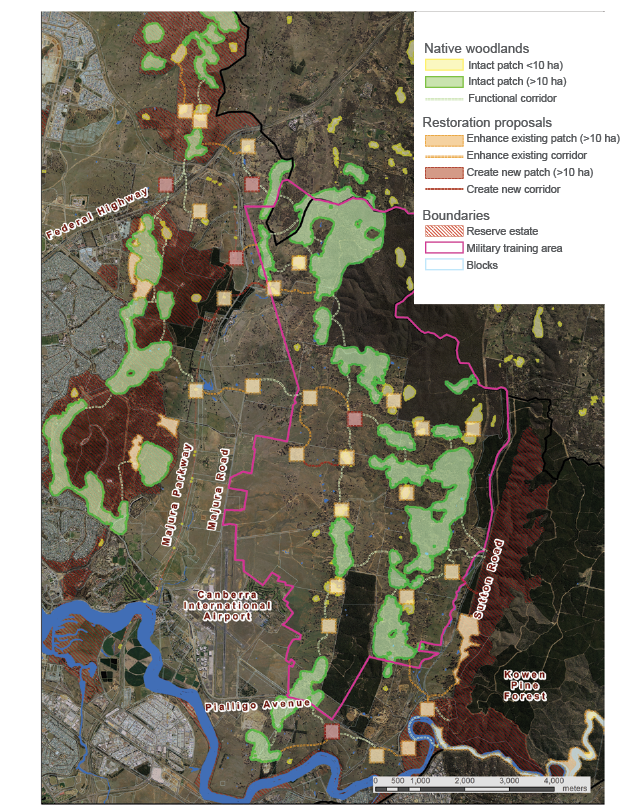
Source: ACT Government
Figure 7.25 Use of the connectivity analysis to guide woodland restoration projects
ACT lowland woodland condition and connection
Forest and woodland connectivity across Gungahlin
Figures 7.26–7.28 indicate areas of high habitat value across Gungahlin. Habitat value was determined for each 15-m grid, based on the size of suitable patches, how close they are to one another and habitat condition.
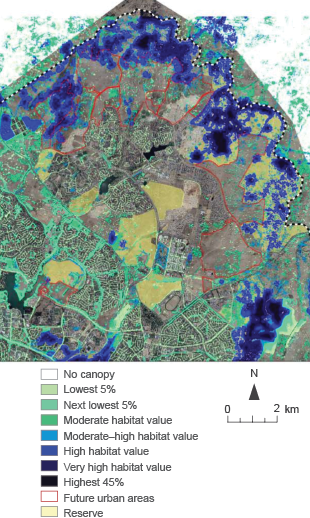
Note: The darker the shading, the higher the habitat value.
Figure 7.26 Gungahlin general habitat
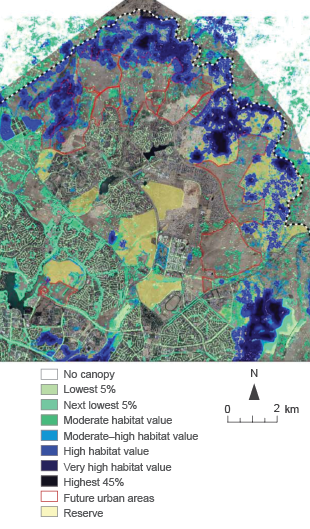
Note: The darker the shading, the higher the habitat value
Figure 7.27 Gungahlin woodland habitat
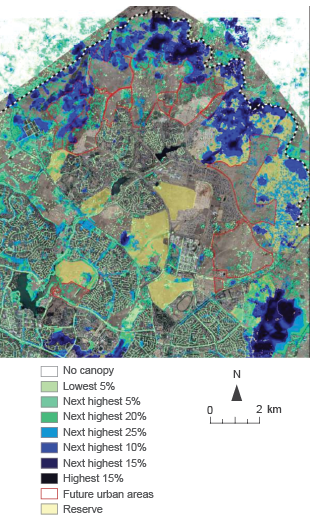
Note: The darker the shading, the higher the habitat value.
Figure 7.28 Gungahlin forest habitat
Most of the high-value habitat in Gungahlin is in Mulligans Flat and Goorooyarroo nature reserves, the northern lease area and Kinlyside. The habitat and linkage connectivity analysis suggests that specialist woodland species may have trouble crossing the northern lease area, but shows that there is good connectivity between the woodland patches of East Bonner, Little Mulligans Flat, Mulligans Flat, the mid- to northern section of Throsby neck, Goorooyarroo, and then onto Mount Majura, Mount Ainslie and the Majura Training Area. The woodland in Kenny also has some local connectivity value. The analysis also confirms that Kinlyside–Hall, the northern lease area, and the Mulligans Flat–Goorooyarroo grassy woodland complex are the key and best-connected habitat areas within Gungahlin, and that there are good connections to other woodland areas to the south and east across the Majura Valley and into NSW.
The 2013 Gungahlin Strategic Assessment: Biodiversity Plan improved connectivity by adding forest and woodland communities to reserve areas (Table 7.11). This increased patch sizes, primarily for the Mulligans Flat–Goorooyarroo complex, and the northern hills, ridges and buffers of Kinlyside, to create a continuous area of habitat across the northern border of the ACT.
Table 7.11 Area of nature reserve before and after the Gungahlin Biodiversity Plan
| Nature reserve | Area before (ha) | Area after (ha) |
|---|---|---|
|
Percival Hill |
79 |
79 |
|
Mulligans Flat north |
130 |
130 |
|
Crace Grasslands |
166 |
166 |
|
Mulanggari |
148 |
148 |
|
Gungaderra |
287 |
287 |
|
Northern hills, ridges and buffers |
1122 |
1545 |
|
Mulligans Flat–Goorooyarroo |
1394 |
1695 |
|
Kenny |
0 |
154 |
|
Total |
3326 |
4204 |
ha = hectare
Connectivity at Jarramlee
The Jarramlee offset site, as described in Section 7.3.1, is contiguous with the West Macgregor environmental offset site.
The Jarramlee and West Macgregor offset sites protect a relatively isolated patch of Golden Sun Moth habitat within Canberra’s rural–urban fringe, which supports one of the largest known populations of Golden Sun Moth in the ACT. Although currently isolated, there is potential to connect Jarramlee with the nearby Golden Sun Moth population protected within the Dunlop Grasslands Nature Reserve and to patches of habitat along Gooromon Ponds Creek in NSW. Once established, this will create one of the largest patches of Golden Sun Moth habitat in Australia.
Protected areas
Why is this indicator important?
The National Reserve System (NRS) is Australia’s network of protected areas, designed to conserve Australia’s remaining biodiversity. The system aims to protect examples of the full range of Australian ecosystems, with their distinctive flora, fauna and landscapes, in areas across the continent.
The NRS currently has more than 10 000 protected areas, covering more than 137 million ha – 17.88% of Australia. It is made up of Commonwealth, state and territory reserves, Indigenous lands, and protected areas run by nonprofit conservation organisations, as well as ecosystems protected by farmers on their private working properties. All 89 Australian bioregions have some representation.
Current monitoring status and interpretation issues
Every two years, the Australian Government collects information on protected areas from state and territory governments, and other protected area managers. This information is published in the Collaborative Australian Protected Areas Database (CAPAD).
CAPAD provides a national perspective of the conservation of biodiversity in protected areas. It also allows Australia to regularly report on the status of protected areas to meet international obligations, such as those in the Convention on Biological Diversity.73
Under Australia’s Strategy for the National Reserve System 2009–2030, the Australian Government and all state and territory governments have agreed to adopt international standards for the definition of a protected area and management categories used by the International Union for Conservation of Nature (IUCN).
All Australian governments have agreed to minimum standards that protected areas must meet to be included in and managed through the NRS:
- The land must be designated a ‘protected area’ to be conserved forever, with effective legal means guaranteeing its perpetual conservation.
- The land must contribute to the comprehensiveness, adequacy and representativeness of the NRS; in other words, it must meet certain scientific criteria and strategically improve the protected area network.
- The land must be managed to protect and maintain biological diversity according to one of six international classes developed by the IUCN. The six-level system classifies protected areas according to their management objectives, which range from strict nature conservation to multi-use reserves.
The fundamental principle underpinning the NRS – protecting a diversity of habitat types at multiple scales – will remain effective under the pressure of climate change as a practical mechanism for conserving values associated with Australian species, ecosystems and landscapes. However, with substantial changes in biodiversity and loss of biodiversity highly likely, additional criteria for selecting priority areas of habitat, including connectivity at multiple scales and refuges, are needed to support landscape-scale ecological processes that build the resilience of biodiversity to climate change.74
Data presented for the land-use category of ‘conservation and other protected areas, recreation and parks’ differ from the category used in Chapter 5: Land. In this chapter, it is based on the definition used in CAPAD and includes only land reserved for specific conservation purposes. In Chapter 5, data are presented in accordance with the Territory Plan, which is based on land zoning and may not reflect the actual current land use.
What does this indicator tell us?
The ACT occupies only part of two bioregions75 – the Australian Alps and the South-Eastern Highlands (Table 7.12) – but has the most extensive system of protected areas of any jurisdiction (Tables 7.13 and 7.14).
In 2007, the ACT was the only Australian jurisdiction to receive a World Wildlife Fund triple-A rating for its nature conservation estate in terms of its comprehensiveness, extent and standard of management.76
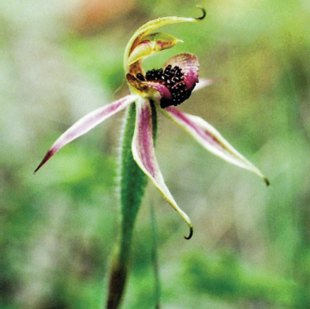
The Canberra Spider Orchid occurs on Mount Ainslie and Mount Majura and within the Majura ValleyPhoto: Ester Beaton, ACT Government
Table 7.12 Terrestrial protected areas in each bioregion (IBRA version 7) in the ACT, 2014
| IBRA name | IBRA area in ACT (ha) | Area protected (ha) | Percentage protected (%) | Percentage of total area protected |
|---|---|---|---|---|
|
Australian Alps |
54,131 |
54,131 |
99.47 |
41.57 |
|
South-Eastern Highlands |
181,393 |
76,083 |
41.94 |
58.43 |
|
Total |
235,524 |
130,214 |
55.29 |
100.00 |
ha = hectares; IBRA = Interim Biogeographic Regionalisation for Australia
Note: Total area of the ACT is 235 813 ha.
Table 7.13 Terrestrial protected areas in Australia by jurisdiction, 2014
| Jurisdiction | Jurisdiction area (ha) | Number | Protected area (ha) | Average size (ha) | Percentage of jurisdiction protected | Contribution to NRS (%) |
|---|---|---|---|---|---|---|
|
ACT |
235,813 |
46 |
130,214 |
2,831 |
55.22 |
0.09 |
|
EXT |
– |
19 |
42,223 |
2,222 |
0.00 |
0.03 |
|
NSW |
80,121,268 |
925 |
7,293,630 |
7,885 |
9.10 |
5.30 |
|
NT |
134,778,762 |
81 |
25,129,386 |
310,239 |
18.64 |
18.27 |
|
QLD |
172,973,671 |
1,086 |
14,108,222 |
12,991 |
8.16 |
10.26 |
|
SA |
98,422,137 |
1,995 |
29,394,607 |
14,734 |
29.87 |
21.38 |
|
TAS |
6,840,133 |
1,524 |
3,015,707 |
1,979 |
44.09 |
2.19 |
|
VIC |
22,754,364 |
3,056 |
4,012,124 |
1,313 |
17.63 |
2.92 |
|
WA |
252,700,808 |
1,607 |
54,375,439 |
33,837 |
21.52 |
39.54 |
|
Total |
768,826,956 |
10,339 |
137,501,551 |
13,299 |
17.88 |
100.00 |
|
Area of Australia (ha) |
768,826,956 |
EXT = external; ha = hectares; NRS = National Reserve System
Table 7.14 Terrestrial protected areas in ACT, 2014
| Type | Name | Area (ha) | Date declared |
|---|---|---|---|
|
Botanic gardens (Cwlth) |
Australian National |
84 |
11/07/1980 |
|
Total |
84 |
NA |
|
|
National park (Cwlth) |
Namadgi |
77 781 |
14/09/1993 |
|
Total |
77 781 |
NA |
|
|
Nature reserve |
Aranda Bushland |
110 |
14/09/1993 |
|
Black Mountain |
462 |
14/09/1993 |
|
|
Bruce Ridge |
97 |
14/09/1993 |
|
|
Bullen Range |
4 024 |
14/09/1993 |
|
|
Callum Brae |
143 |
31/03/2008 |
|
|
Cooleman Ridge |
192 |
14/09/1993 |
|
|
Crace |
165 |
15/12/1995 |
|
|
Dunlop Grassland |
106 |
12/12/1997 |
|
|
Farrer Ridge |
195 |
14/09/1993 |
|
|
Gigerline |
1 476 |
14/09/1993 |
|
|
Goorooyarroo |
702 |
25/08/2006 |
|
|
Gossan Hill |
47 |
14/09/1993 |
|
|
Gungaderra Grassland |
275 |
15/12/1995 |
|
|
Isaacs Ridge |
325 |
14/09/1993 |
|
|
Jerrabomberra Wetlands |
215 |
14/09/1993 |
|
|
Kama |
155 |
12/12/2008 |
|
|
Lower Molonglo River Corridor |
569 |
14/09/1993 |
|
|
McQuoids Hill |
62 |
14/09/1993 |
|
|
Molonglo Gorge |
990 |
14/09/1993 |
|
|
Mt Ainslie |
770 |
14/09/1993 |
|
|
Mt Majura |
349 |
14/09/1993 |
|
|
Mt Mugga Mugga |
151 |
14/09/1993 |
|
|
Mt Painter |
90 |
14/09/1993 |
|
|
Mt Pleasant |
65 |
14/09/1993 |
|
|
Mt Taylor |
301 |
14/09/1993 |
|
|
Mulanggari Grassland |
119 |
15/12/1995 |
|
|
Mulligans Flat |
812 |
20/05/1994 |
|
|
O’Connor Ridge |
59 |
14/09/1993 |
|
|
Oakey Hill |
66 |
14/09/1993 |
|
|
Old Naas TSR |
19 |
18/03/2013 |
|
|
Percival Hill |
79 |
18/05/2006 |
|
|
Red Hill |
298 |
14/09/1993 |
|
|
Rob Roy |
2 048 |
14/09/1993 |
|
|
Stony Creek |
827 |
14/09/1993 |
|
|
Swamp Creek |
155 |
31/03/2008 |
|
|
The Pinnacle |
136 |
14/09/1993 |
|
|
Tidbinbilla |
5 136 |
14/09/1993 |
|
|
Tuggeranong Hill |
337 |
14/09/1993 |
|
|
Unnamed |
220 |
14/09/1993 |
|
|
Urambi Hills |
239 |
14/09/1993 |
|
|
Wanniassa Hills |
282 |
14/09/1993 |
|
|
West Jerrabomberra |
261 |
31/03/2008 |
|
|
Woodstock |
343 |
14/09/1993 |
|
|
Total |
23 472 |
– |
|
|
Wilderness zone |
Namadgi |
28 877 |
14/09/1993 |
|
Total |
28 877 |
– |
|
|
Total |
130 214 |
– |
– = not applicable; ha = hectare; TSR = travelling stock reserve
Note: Total area of the ACT is 235 813 ha.
Rare and insufficiently known species and ecological communities
Why is this indicator important?
‘Rare’ species may not be currently threatened, but, because they have a small population or distribution, they can be particularly at risk of disturbance. ‘Insufficiently known species’ can also be at risk, but we do not know enough about their populations or ecology to be able to assess the risk.
The ecosystem consequences of losing rare or insufficiently known species are poorly known. Extinction of such species can influence ecosystem functioning and resilience if the species lost possess traits that directly or indirectly influence ecosystem function.77 Each species can have distinct traits involved in unique ecological functions. As pressures on the environment grow, these unique features are particularly vulnerable to extinction, because rare species are likely to disappear first.
Current monitoring status and interpretation issues
In the ACT, the Scientific Committee compiles a list of working categories that are akin to watching briefs. Species and ecological communities included on these lists are not protected under the Nature Conservation Act or EPBC Act, but may be at risk. The categories included in this list are:
- rare species or ecological communities with small distributions or small populations that, although not currently endangered or vulnerable, are at significant risk from events such as land-use changes, reduced protection measures or major disturbance
- insufficiently known species or ecological communities suspected to be endangered or vulnerable but for which there is inadequate information to make an assessment of risk of extinction based on distribution, population status or other attributes. The species or ecological communities may have poorly known distributions, and the taxonomy of populations or species may be uncertain, or populations may appear to be declining. Threatening processes may also be identified as insufficiently known. Items identified as insufficiently known are flagged for further survey or taxonomic research, and kept under review.
This indicator reports on the state and/or trend of the extent and, where possible, the condition of each rare and insufficiently known species or ecological community. The quality and quantity of the reporting are commensurate with the monitoring data available in the reporting period.
Note that the Nature Conservation Act 2014 includes provisions to list species in the categories ‘rare’ and ‘data deficient’. Once listed in either of these categories, species are given statutory protection as ‘protected species’. Criteria and guidelines for listing under these categories are currently under development. No species are currently listed as either rare or data deficient under the Nature Conservation Act.
What does this indicator tell us?
The Scientific Committee reviewed the species listed as rare during the reporting period. The Committee agreed to include the Crested Shrike-Tit in this category, given that it is becoming increasingly stressed and is reliant on woodlands. The current list of the species in the Committee’s rare working category is:78.
- Eastern Bent-Wing Bat (Miniopterus schreibersii)
- Australian Painted Snipe (Rostratula australis)
- Black Falcon (Falco subniger)
- Crested Shrike-Tit (Falcunculus frontatus)
- Powerful Owl (Ninox strenua)
- White-Bellied Sea-Eagle (Haliaeetus leucogaster)
- Kydra Dampiera (Dampiera fusca).
The Committee also reviewed the species listed as insufficiently known during the reporting period. The Committee agreed to include the Masked Owl in this category, given the limited information available on this species. The current list of species in the Committee’s insufficiently known working category is:
- Diamond Firetail (Stagonopleura guttata)
- Dusky Woodswallow (Artamus cyanopterus)
- Flame Robin (Petroica phoenicea)
- Masked Owl (Tyto novaehollandiae)
- Black Gum (Eucalyptus aggregata)
- Snow Gum – Candlebark tableland woodland (E. pauciflora and E. rubida).
Rare species
Eastern Bent-Wing Bat
The Eastern Bent-Wing Bat population found in the ACT breeds in a cave at Wee Jasper (NSW) and occupies staging caves en route to the south coast or ranges when breeding ceases. The migrations have been monitored at wind farms just across the border, and no Eastern Bent-Wing Bat fatalities have been recorded in three years of study.
The Cotter Caves once housed a colony of Eastern Bent-Wing Bats. In the 1930s to 1950s, bats were always present during cave inspections. Visitor disturbance and gating of the cave entrance (which interfered with the bat sonar, and deterred or prevented entrance to the caves) led to a decline, and bat sightings are now infrequent.79 The most recent recorded evidence of the bats was in October 2013. Government rangers visited the Cotter Caves and found evidence of guano, but no signs of groups or individuals roosting (J Overall, Ranger – Southern Murrumbidgee, pers comm, 14 October 2013).
Australian Painted Snipe
The Australian Painted Snipe is an unusual sighting in the ACT region. Reporting rates in 2013–14 were down 26% on 2012–13, but were well up on both the 10- and 30-year averages.80
Black Falcon
The Black Falcon is an inland raptor that continues to be recorded infrequently in the ACT region; its presence here is probably dictated by conditions inland. There were 9 recorded sightings of the species in 2012–13 in the ACT and 16 in 2013–14. This is significantly higher than the 30-year average of 2.3 birds per year.81
Crested Shrike-Tit
The Crested Shrike-Tit is considered to be rare by the Scientific Committee, because its reporting rate has fallen significantly since its peak in the 1990s. However, there were 23 recorded sightings of the species in 2012–13 in the ACT and 40 in 2013–14. The 30-year average is 28.1 birds per year.82
Powerful Owl
There have been no dedicated surveys of the Powerful Owl – a rare breeding resident – since 1995. This was when it was estimated that there were 14 or so territorial pairs in the ACT, mostly in Namadgi National Park.
Powerful Owls have been recorded in seven of the years from 2005 to 2015. COG reports no records in 2011–12. In 2014, CPR staff recorded Powerful Owls near Bendora Dam, Yaouk Gap and Fishing Gap (G Baines, Senior Vegetation Ecologist, Conservation Research, EPD, pers comm, 3 August 2015). The most recent breeding record was in 1988.83
In 2015, a Powerful Owl took up long-term residence in Haig Park near the Canberra central business district. COG member Terry Bell said that the big predator had been caught on camera devouring Sugar Gliders and its feathery cousins, such as Canberra’s emblem bird, the Gang-Gang Cockatoo.84
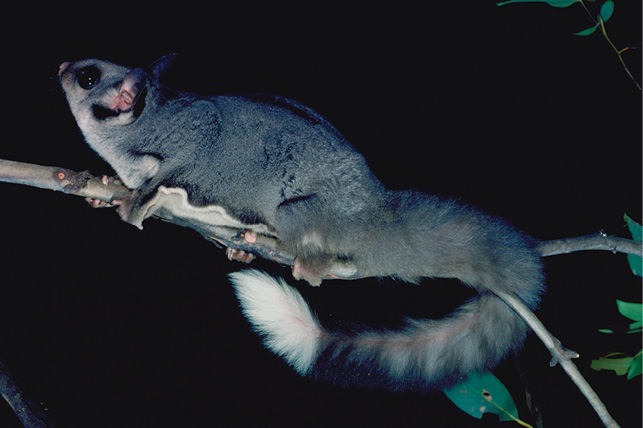
Sugar Glider: an individual of this species was seen to be devoured by a Powerful Owl in Haig Park in Canberra’s central business districtPhoto: Ester Beaton, ACT Government
White-Bellied Sea-Eagle
An uncommon nonbreeding visitor, the White-Bellied Sea-Eagle is occasionally seen over ACT lakes and rivers, or travelling between them. There were 47 recorded sightings of the species in 2012–13 in the ACT and almost double this (92) in 2013–14. This is significantly higher than the 30-year average of 15.9 birds per year.85
Kydra Dampiera
Kydra Dampiera is a small perennial shrub86 that has been monitored in the ACT since its discovery after the 2003 fires. The shrub germinates in large numbers after fires and then rapidly declines. The species was most recently surveyed in 2011. The species occurs within Namadgi National Park and, in 2011, approximately 150 plants were surveyed. The numbers of plants recorded have declined after a peak in 2009. This decline is consistent with the known ecology of this species – few if any standing plants are observed in populations 20–30 years after fire, with the species persisting only in seed banks.
Insufficiently known species
Diamond Firetail
The Diamond Firetail is an uncommon breeding resident, which prefers undisturbed woodland with shrubs and eucalypts. The reporting rate for 2012–13 is 15% less than for 2013–14. It is also about 30% lower than both the 10- and 30-year averages.87
Dusky Woodswallow
A not-uncommon breeding woodland species, the Dusky Woodswallow is a summer migrant, but has been recorded overwintering in the region. The abundance and reporting rate appear to be rising from the extremely low levels of 2011–12, with 299 birds recorded in 2012–13 and 369 in 2013–14, which are above the 30-year average of 177.2.88
Flame Robin
The reporting percentage for the Flame Robin continues to show a steady decline from 5.1% in 2008 (the highest since 1994) to 2.6% in 2013–14.89
Masked Owl
There have been no sightings of the Masked Owl for the past decade.
Black Gum
The ACT Black Gum population is small, but this appears to be typical for this species. There is only one ‘natural’ (nonplanted) site in the ACT – a cluster of about 16 individuals located in the Kowen–Kings Highway area. Since 1995, nine saplings have grown to reproductive age, one mature tree has died, and two have probably been removed by road works. Grazing of seedlings and road works continue to threaten this population. These trees are known to hybridise with Candlebark Gum (E. rubida), a species common in the location where Black Gum grows (G Baines, Senior Vegetation Ecologist, Conservation Research, EPD, pers comm, 3 August 2015).
Snow Gum – Candlebark tableland woodland
Current (2015) information indicates that there are 32 potential sites mapped for a Snow Gum – Candlebark tableland woodland community, with a total area of around 225 ha. The community is very fragmented, and many areas are in a degraded condition. New areas are being identified through a government vegetation mapping project, but it is unlikely that any new large areas will be found (G Baines, Senior Vegetation Ecologist, Conservation Research, EPD, pers comm, 3 August 2015).
Case study 7.2 discusses another species about which there is little information – the Mountain Spiny Crayfish.
Case study 7.2 Mountain Spiny Crayfish
There are two known species of Mountain Spiny Crayfish in the ACT: Euastacus crassus and E. rieki. Little is known about the biology, distribution or status of either species in the ACT or elsewhere. The species are thought to primarily inhabit montane to alpine creeks and bogs. This makes them temperature dependent and therefore likely to be at risk of climate change.
The CPR Aquatic Team collected two berried females among 50 individuals collected as part of a surveying program in the subalpine bogs, creeks and rivers in the ACT. The program is designed to determine the distribution and relative abundance of E. crassus and E. rieki.
This is the first breeding information regarding E. rieki. It indicates that berried females remain active and are likely to hold their eggs over winter, despite the frequent snow cover and subzero temperatures. Improved monitoring of alpine areas will be important in understanding potential impacts from climate change on this species.90
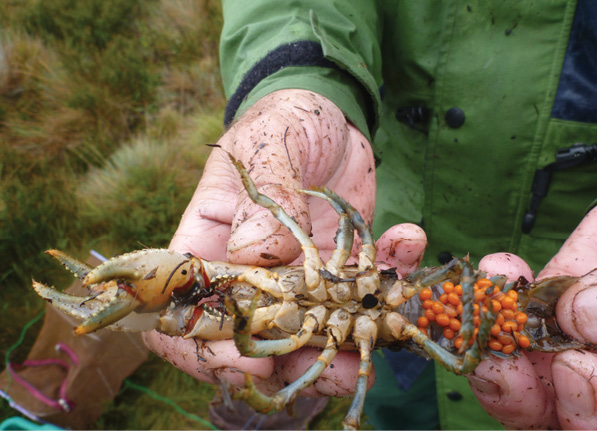
Berried Euastacus rieki located in July 2014 in a subalpine bog in Namadgi National Park. This is the first female with eggs ever to be recorded – a tremendous leap towards filling the huge knowledge gaps on this cryptic species. Photo: ACT Government
Assessment summaries
for indicators of biodiversity state and trend
| Indicator | Reasoning | Assessment grade | Confidence | |||||
|---|---|---|---|---|---|---|---|---|
| Very poor |
Poor | Fair | Good | Very good |
In state grade | In trend grade | ||
| Extent and condition of threatened flora and fauna species | By definition, these species will be in poor (vulnerable species) or very poor (endangered species) condition. The trends are mostly hard to discern from the fragmentary data presented, but the majority of cases suggest a continued decline | Deteriorating | Adequate high-quality evidence and high level of consensus | Evidence and consensus too low to make an assessment | ||||
| Extent and condition of threatened ecological communities | By definition, threatened communities are in poor condition. It appears that, for the majority of communities, there have been improvements due to management, although there have been some declines (eg sphagnum bogs and fens) |
Improving | Adequate high-quality evidence and high level of consensus | Limited evidence or limited consensus | ||||
| Connectivity of terrestrial native vegetation (ecological community) | The Gungahlin Strategic Assessment led to significant planning of, and monitoring for, connectivity values. Fine-scale modelling of fauna habitat and connectivity across the ACT means that these values are now well understood. However, this knowledge needs to be applied to management and planning decisions to ensure that connectivity values continue to improve. Until the modelling methodology is reapplied, the trend is stable – we are losing connectivity through developments such as the Majura Parkway and the building of new suburbs; however, we are protecting the key links and revegetating some others |
Stable | Limited evidence or limited consensus | Limited evidence or limited consensus | ||||
| Protected areas | More than half of the ACT’s entire land area is protected in perpetuity as part of the National Reserve System. The incomplete confidence in the grade reflects:
|
Stable | Adequate high-quality evidence and high level of consensus | Limited evidence or limited consensus | ||||
| Rare and insufficiently known species and ecological communities | By definition, we cannot say much about the trend for these species. Those that are rare might be naturally rare or might be in decline. It seems that most on the list are in the latter category; hence, the overall grade is very poor, but some might argue for poor | Unclear | Evidence and consensus too low to make an assessment | Evidence and consensus too low to make an assessment | ||||
Recent trends
Confidence
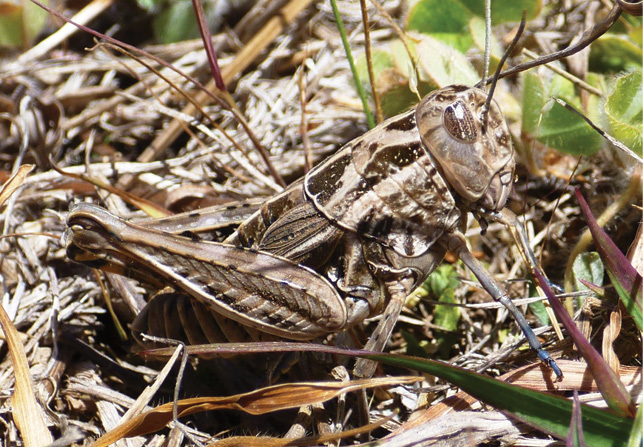
Relatively little is known about the habitat or distribution of the Perunga GrasshopperPhoto: Emma Cook, ACT Government
7.3.2 Pressures
Pest species
Why is this indicator important?
Australia’s Biodiversity Conservation Strategy 2010–203091 lists alien species and genetically modified organisms as a threat to biodiversity. Introduced species cause extensive damage to native ecosystems. They contribute to extinctions by predation, habitat alteration and outcompeting native species.
Current monitoring status and interpretation issues
In the ACT, non-indigenous terrestrial species (vertebrates, invertebrates, plants and pathogens) are prescribed as pests through the Plant Diseases Act 2002 and the Pest, Plants and Animals Act 2005. These Acts allow the Minister to identify and manage pest plants and animals that threaten the ACT’s land and aquatic resources.
It is not possible to monitor the distribution and abundance of all introduced species. Therefore, the monitoring of introduced species concentrates on those organisms known to be causing significant problems or posing significant threats.
Monitoring of pests also focuses on abundance and extent rather than the effects pests are having on biodiversity outcomes. Thus, this indicator primarily provides information about the distribution of pests. The indicator also provides some general information about the impacts or threats these pests cause or may cause to biodiversity. However, there are few reliable, quantitative measurements for the environmental damage inflicted by pests. With the exception of domestic cats, most information on damage is qualitative or anecdotal.
What does this indicator tell us?
This indicator examines the distribution (and abundance, where possible) of non-indigenous species identified as pests. These include:
- vertebrate pests
- cats (Felis catus)
- Fallow Deer (Dama dama), Red Deer (Cervus elaphus), Sambar Deer (Rusa unicolor)
- dogs (Canis lupus familiaris)
- foxes (Vulpes vulpes)
- goats (Capra aegagrus hircus)
- horses (Equus ferus caballus)
- rabbits (Oryctolagus cuniculus)
- pigs (Sus scrofa domesticus)
- Indian Myna (Acridotheres tristis)
- aquatic pests
- Carp (Cyprinus carpio)
- Redfin Perch (Perca fluviatilis)
- plant pests (see Table 7.18 for the species list)
- grassy weeds
- herbaceous weeds
- woody weeds.
Vertebrate pests
Cats (domestic)
Canberra is the location of one of the few comprehensive Australian (and international) studies of predation by domestic cats.92 This study found that domestic cats caught more than 67 species of prey. Small, introduced mammals (rats and mice) were caught most often, followed by birds (27%, of which 14% were native), native reptiles (7%), native frogs (1%) and native mammals (1%).
The study also assessed the spatial effect, and interactions of habitat and urban edge for reptiles and birds. Reptiles, although a minor proportion of the cats’ prey overall, were the most predated species within 50 m of grassland habitat and accounted for 23% of prey within 50 m of woodland or open forest. The percentage of native birds as prey increased closer to woodland habitats. Domestic cats are generally more active for longer periods in spring and summer, which corresponds with the breeding cycle of many prey species. The level of predation on birds and reptiles also confirms that domestic cats were actively hunting during the day, and cats favoured ground-foraging and ground-dwelling species. Birds were caught in the early morning and reptiles in the afternoon.
Significantly, reptiles and frogs were the third- and fourth-most important prey types. However, the catch of these small prey types may be much higher than that reported by cat owners, as smaller animals are more likely to be consumed at the site of capture and not brought home.
To identify areas where stray and domestic cats may have the greatest impact on wildlife, the known ACT habitat of all threatened species and some declining woodland bird species that fall within the categories of ‘fauna of concern’ was mapped (Figure 7.29). The map shows that the existing policy of applying cat containment only to new suburbs adjoining nature reserves has created an isolated mosaic of declarations that does not reflect the potential predation threat that domestic cats pose to vulnerable native wildlife across the ACT. Most cat containment suburbs adjoin older suburbs that have no containment rules, even though they may border the same nature reserves.
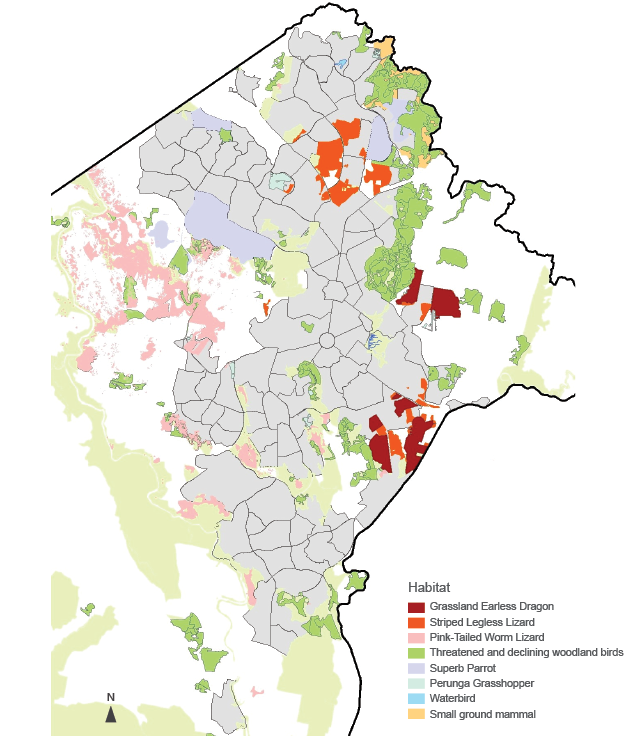
Source: Eyles & Mulvaney92
Figure 7.29 Cat predation hotspot areas in the ACT
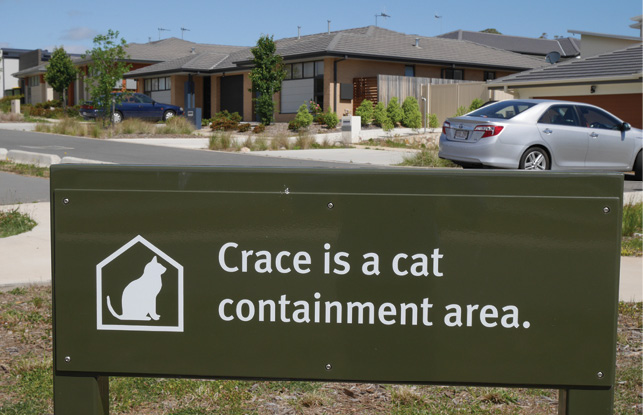
The suburb of Crace is a cat containment areaPhoto: Office of the Commissioner for Sustainability and the Environment
Cats (stray and feral)
A stray cat is one that has been kept as a pet and has become lost or abandoned; a feral cat is one that has been born in the wild and has had little contact with humans. A proportion of the uncontained cats in the ACT may become unowned or stray cats. These cats may then contribute to the feral cat population if they breed.
The stray cat population in the ACT is difficult to estimate; however, it is likely to exceed 25 000, which is approximately equal to the domestic cat population. In 2012, 2261 cats and kittens were taken to the ACT RSPCA shelter. Of these, 1154 (51%) were strays, 408 (18%) were feral and 610 (27%) were owned cats.
Where stray or feral cats rely solely on hunting, their population density may be quite low (eg in the Brindabella Ranges), with recorded densities as low as 0.2 cats per square kilometre has been recorded. However, where food supply is supplemented by human sources, such as around tip sites, schools or shopping centres, densities can rise dramatically. A density of 19–90 stray or feral cats per square kilometre was recorded around Canberra tips, noting that these data are from the 1990s.92
Less is known about the impact of stray and feral cats on biodiversity than of domestic cats.
The ACT has no formal programs to manage stray or feral cats.
Deer (feral)
Deer sightings in the ACT have been steadily increasing during the past 10 years. Three of the six species of feral deer in Australia occur in the ACT. Fallow Deer are the most abundant and widely distributed species, occurring in small groups in river valleys including the Murrumbidgee, Naas, Paddys and Molonglo rivers. Small numbers are also present in woodland reserves in the north-eastern ACT. Red Deer are present in the Naas Valley and adjoining areas of Namadgi National Park. Sambar Deer sightings have shown a marked increase in the past two years, and they are now present in low numbers throughout the northern and western parts of Namadgi National Park and adjoining rural land.
A deer sightings register was established in 2008–09 for reports from staff, landholders and the public. There were 21 sightings reported in 2013–14: 4 Fallow Deer, 11 Red Deer, 4 Sambar Deer and 2 unknown. None of these records were outside the known range for any of the species in the ACT.93
Deer management poses a challenge to public and private land managers due to the animals’ cryptic and wary behaviour. Ground shooting is a time-consuming and therefore costly exercise, but is currently the most effective technique available for reducing deer populations. There are currently no registered toxins for poisoning deer and, while trapping is possible, there are animal welfare concerns with such flighty animals becoming badly injured in traps.
In 2013–14, the PCS conducted a trial in Namadgi National Park of timed wildlife feeders to attract deer to improve the efficiency and safety of shooting programs. Unfortunately, the trial was unsuccessful in attracting Fallow or Red Deer, despite their presence in the area in which the feeder was located.
Dogs (feral)
Wild dogs are controlled in designated areas of Namadgi National Park and adjoining nature reserves to minimise attacks on neighbouring sheep. Management involves 1080 poison baiting, 1080 ejectors, trapping and opportunistic shooting. This integrated approach also achieves effective fox management in dog-control areas. However, wild dogs are protected in core reserve areas, including the Gudgenby Valley, Cotter Catchment and Tidbinbilla Nature Reserve, where they are the top-order predator in the ecosystem.
In 2013–14, PCS staff conducted regular 1080 poison baiting, with 23 separate trails baited each month (Figure 7.30). The western side of the Blue Range Recreation Area was baited in spring and autumn in accordance with the Brindabella and Wee Jasper Wild Dog/Fox Control Plan. All baits are buried to reduce nontarget poisoning of native species such as quolls and scavenging birds. Baits are also supplied free of charge to ACT landholders for cooperative baiting; 301 baits were supplied to six landholders adjoining Namadgi National Park in 2013–14.
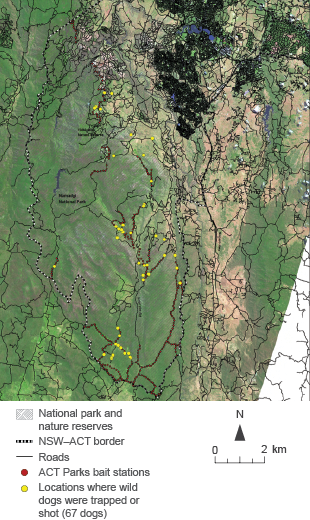
Figure 7.30 ACT locations where wild dogs were baited, trapped or shot, 2013–14
The PCS’s full-time vertebrate pest officer is responsible for wild dog trapping. This trapping is backed up by a contract dog trapper to cover peak dog-activity periods. Traps used are rubber-lined leg-hold traps. Table 7.15 shows the number of wild dogs killed and the number of hours worked by the officer and contractor.
Table 7.15 Number of wild dogs killed and trapping effort, 2013–14
| 2013–14 quarter | Dogs shot | Dogs trapped | Trapper hours |
|---|---|---|---|
|
July–September |
0 |
6 |
489 |
|
October–December |
2 |
11 |
529 |
|
January–March |
1 |
20 |
535 |
|
April–June |
3 |
24 |
763 |
|
Total |
6 |
61 |
2316 |
Foxes
No abundance or population data for foxes were available for the reporting period.
Goats (feral)
Goats are the other main pest species controlled by the PCS; however, none were recorded as being shot during 2013–14. Between 5 and 10 goats are still present in the Molonglo River Corridor near Coppins Crossing, from where approximately 60 goats were mustered in 2009–10 to protect the nearby National Arboretum.
Horses (feral)
Feral horses within Namadgi National Park damage sensitive subalpine wetlands and bogs, which provide habitat for the rare and endangered Northern Corroboree Frog. Although only a few (15–20) horses are involved, they have already caused damage to subalpine vegetation. If the current small feral horse population in Namadgi is permitted to grow and expand its range, there will be increasing damage to sensitive ecosystems, with deleterious impacts on biodiversity.94 This issue is acknowledged in the Namadgi National Park Feral Horse Management Plan 2007.95
Rabbits
Rabbit populations are monitored by counting rabbits using the spotlight method while driving transects of known length, to give an index of rabbit abundance expressed as rabbits per kilometre. In 2013–14, it was not possible to conduct the quarterly spotlight counts that form the long-term monitoring within Namadgi National Park, because the wet conditions made driving on the tracks impossible or it was raining during the scheduled count weeks during the new moon. Spotlight counts at Googong Foreshores were conducted in August and October 2010, and May 2011, and show that rabbit numbers remain low (less than two rabbits per kilometre) in the areas monitored (Figure 7.31).
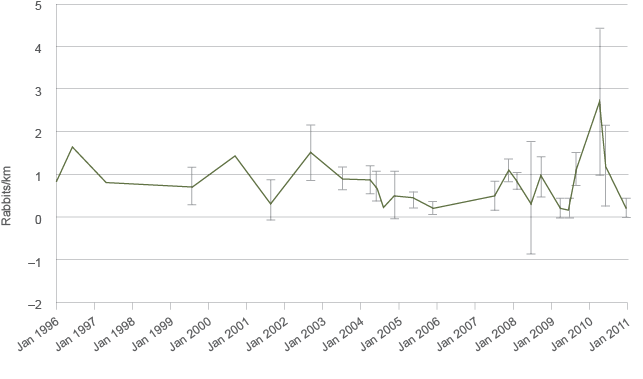
km = kilometre
Note: Bars show 95% confidence intervals.
Figure 7.31 Googong Nature Reserve rabbit counts, 1996–2011
Spotlight counts are also used to assess the effectiveness of each rabbit management program by counting rabbits along the same transects before and after management. Rabbit control programs conducted at Jerrabomberra Wetlands in 2010 and 2011 have reduced numbers (Figure 7.32). At Orroral Valley in 2011, warrens were fumigated and then ripped, with some follow-up shooting. However, rabbits were only reduced by 57% despite combining three management techniques. It appears that significant numbers of rabbits remained in areas characterised by pockets of tea tree or rocky knolls, where it was not possible to rip warrens and rabbits may have been living on the surface. Poisoning may be required in these areas.
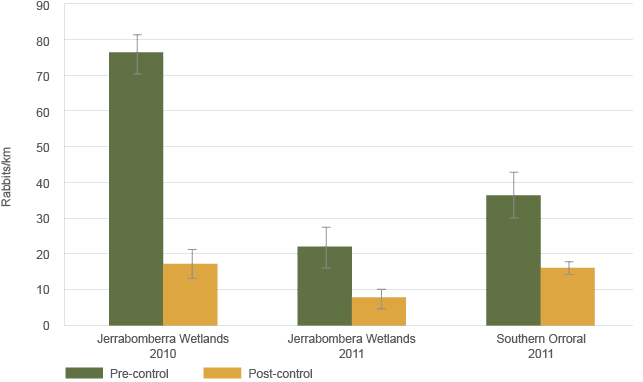
Note: Bars show standard errors
Figure 7.32 Abundance of rabbits before and after control
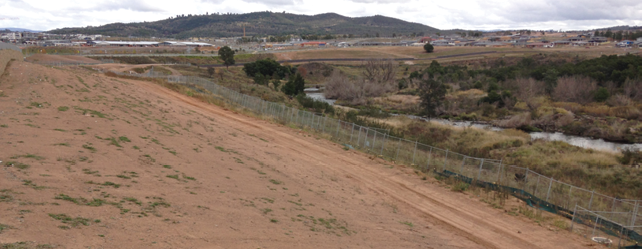
The urban development of Coombs is very close to the river corridor, requiring land management treatments to mitigate the negative impacts of the urban edge. These include changes to hydrology, waterborne contamination, soil erosion, impact on water quality affecting aquatic habitat, disturbance to wildlife habitats, predation on wildlife from cats and dogs, increased invasive weeds and feral animals, light spill and increased noise disturbing nesting, and increased collisionPhoto: TAMS, ACT Government
Pigs (feral)
The abundance of pigs in Namadgi National Park was assessed each year from the mid-1980s by Professor Jim Hone of the University of Canberra. The data show the dramatic decline in ground-rooting impact resulting from the instigation of the annual warfarin poison baiting program in the park in the late 1980s (Figure 7.33). This monitoring program concluded in 2009. The PCS instituted a follow-on monitoring program in 2011–12.
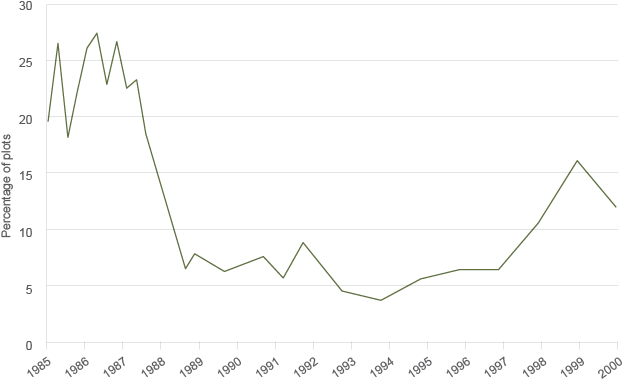
Figure 7.33 Percentage of monitoring plots with pig rooting, 1985–2000
In 2011, pigs were baited across 11 broad areas of Namadgi National Park; 9 by vehicle (52 road sections) and 2 (Booth Range and Blue Gum) via helicopter. After pig feeding was initiated and confirmed using unpoisoned (free feed) wheat, 1080-poisoned wheat was laid under rigid plastic tubs secured to the ground by pegs. Pigs were able to flip the tubs, but nontarget species could not access the bait. Remote fauna cameras on bait stations were used to determine the number of pigs feeding, and to confirm that no other species accessed the poisoned bait.
During the 18-day program, 1080-poisoned bait was eaten by pigs at 18 central bait stations; 45 out of 74 pigs that were individually identified from camera footage were observed eating bait and did not return so are presumed to have died. Unfortunately, there was a high degree of disturbance from illegal pig hunters during the program, which disrupted poisoning and ended the program in several areas that usually support high pig numbers. In areas that were not disturbed, there was a 21% increase in wheat bait take compared with PIGOUT® bait take in 2010. A total of 1303 staff hours were involved in undertaking the Namadgi National Park pig program.
No pigs were reported at Tidbinbilla Nature Reserve in 2013–14. Ten pigs were trapped or shot at Googong Nature Reserve and eight at Freshford near Bullen Range Nature Reserve.
Indian Myna
Indian Mynas were introduced to the Canberra region in 1968, where they have shown a distinct liking for woodland nature reserves and are strong competitors with native wildlife for food and nesting hollows. They are now well established across the ACT. Indian Mynas are very aggressive and intelligent, and are known to evict native birds (including parrots, kookaburras and peewees) from their nests, dumping out their eggs and chasing them from their roosting areas.96
In 2006, the Canberra Indian Myna Action Group was formed to reduce the impact of this exotic invader on native birds and other animals. Following the group’s concentrated trapping and removal effort using traps made by inmates at the Alexander Maconochie Centre (Table 7.16), the most recent assessment of the threat of this pest is that the aggregate numbers of the Indian Myna across Canberra and surrounding districts is declining. This is also evident from slowed capture rates, although there is a suspicion that this pest has become wary of Indian Myna traps.97 COG now lists Indian Mynas as the 18th most common bird in Canberra.
Table 7.16 Indian Mynas trapped and removed, 2010–2014
| 2010–11 | 2011–12 | 2012–13 | 2013–14 | |
|---|---|---|---|---|
|
Number of mynas trapped and removed |
5560 |
4181 |
3549 |
3338 |
Source: Canberra Indian Myna Action Group97
Aquatic pests
The ACT’s stocked recreational fisheries are surveyed every two years using boat electrofishing. This monitoring provides data on the proportion of pest species, identifies growth and success of stocking events, identifies natural breeding events, and allows the detection of disease outbreaks and new pest species. CPR surveyed Yerrabi Pond (two sites) and lakes Tuggeranong (two sites) and Ginninderra (three sites) in 2013–14 and 2014–15.
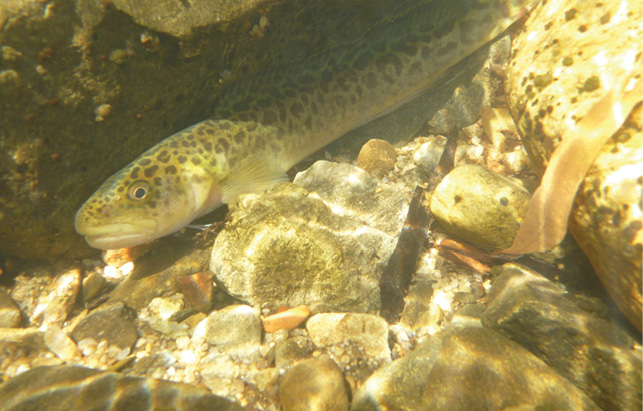
The vulnerable Two-Spined Black Fish is restricted to the Cotter River Catchment in the ACTPhoto: Mark Jekabsons, ACT Government
A total of 327 fish from two native and three introduced species were recorded (Figure 7.34). Redfin Perch was the most abundant species, comprising 65% of the total catch by number. However, due to their small size, Redfin Perch comprised 5% of the biomass (Figure 7.35). In Yerrabi Pond, Carp comprised 68% of the total biomass. This figure is likely to increase in future surveys because the Carp invasion into Yerrabi Pond is recent. (Carp were initially detected in Yerrabi Pond in 2010.) The 2011–12 survey found that the Carp biomass in that water body was 18%; this figure has increased to 44% in the latest survey.
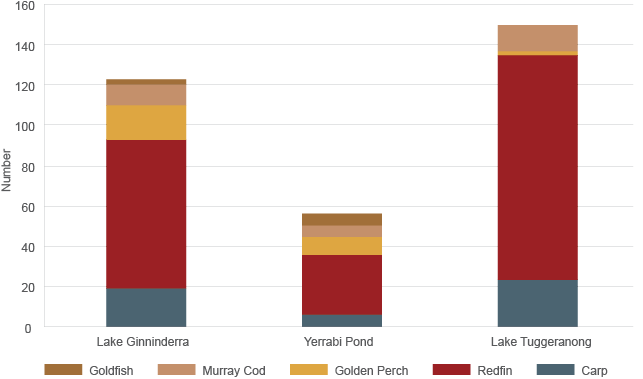
Figure 7.34 Fish caught during the urban lakes surveys, 2013–2015
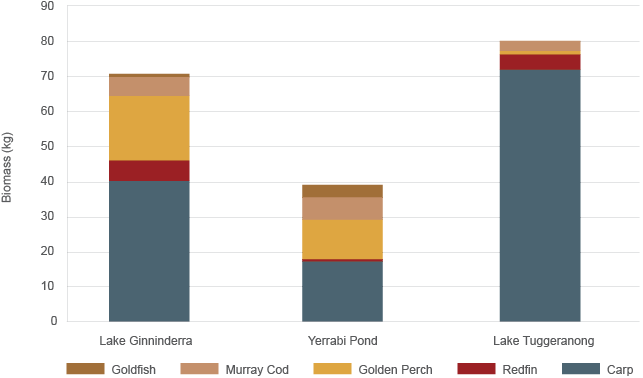
Figure 7.35 Biomass of fish caught during the urban lakes surveys, 2013–2015
Pest plants
Weeds in the ACT are categorised into:
- weeds of disturbed areas, which invade lawns, footpaths, nature strips and playgrounds, and often affect amenity
- invasive weeds,98 which are introduced plants that spread aggressively and cause damage to the environment, economy, and human or animal health. Impacts include smothering native vegetation, reducing farm income, preventing use of recreational areas, triggering allergic reactions and poisoning grazing animals. Most invasive weeds are introduced plants from overseas (eg Blackberry from Europe, Serrated Tussock from South America). Some are native plants that have been introduced to an area from outside their natural range (eg Cootamundra Wattle). Invasive weeds that occur in native vegetation are also called environmental weeds.99
Data are not available to report on the extent and abundance of weed species. However, we do know that 602 different weed species are known to be in the ACT, of which 312 are introduced weeds and 290 are environmental weeds (Table 7.17).98 Of the 290 environmental weeds, only 96 species are targeted for control.
Table 7.17 Weed species in the ACT, 2014–15
| Total species of vascular plants | Total indigenous native plants | Introduced, but not an environmental weed | Total introduced species | Target for control | Limited action | Total | ||
|---|---|---|---|---|---|---|---|---|
| Frequently | Occasionally | Total | ||||||
|
1645 |
1043 |
312 |
602 |
17 |
79 |
96 |
194 |
290 |
Around one-third of environmental weed species are targeted for control because of their invasiveness and impact (Table 7.18). In 2013–14, 16 637 ha was controlled for weeds in the ACT, comprising:
- grassy weeds (4974 ha)
- herbaceous weeds (2516 ha)
- woody weeds (2355 ha)
- St John’s Wort (3697 ha)
- Blackberry (3095 ha).
Table 7.18 Weed control in the ACT, by species, 2013–14
| Weed species | Isolated (ha) | Lightly scattered (<1% cover) (ha) | Scattered (1–10% cover) (ha) | Scattered/patchy (10–50% cover) (ha) | Dense (>50% cover) (ha) | Total control area (ha) | Total area weeds destroyed (ha) |
|---|---|---|---|---|---|---|---|
|
African Boxthorn |
0.0 |
7.8 |
0.0 |
0.0 |
0.0 |
7.8 |
0.1 |
|
African Fountain Grass |
0.0 |
0.0 |
1.2 |
0.0 |
0.0 |
1.2 |
0.1 |
|
African Lovegrass |
1.3 |
2.7 |
232.3 |
1632.2 |
4.1 |
1872.6 |
504.4 |
|
Alligator Weed |
0.0 |
0.0 |
0.0 |
0.0 |
2.6 |
2.6 |
2.0 |
|
Black Alder |
0.0 |
0.0 |
0.0 |
1.5 |
0.0 |
1.5 |
0.5 |
|
Black Willow |
41.2 |
0.0 |
6.2 |
19.0 |
0.0 |
66.4 |
6.4 |
|
Blackberry |
30.6 |
26.0 |
1664.6 |
1239.7 |
134.4 |
3095.3 |
556.5 |
|
Broom |
2.7 |
1.4 |
1.0 |
0.1 |
0.0 |
5.2 |
0.1 |
|
Butterfly Bush |
0.3 |
124.0 |
0.0 |
0.0 |
0.0 |
0.3 |
0.0 |
|
Caltrop |
0.0 |
0.0 |
4.5 |
10.9 |
0.0 |
15.4 |
3.5 |
|
Caper Spurge |
0.0 |
0.0 |
0.3 |
0.0 |
0.0 |
0.3 |
0.0 |
|
Chilean Needlegrass |
0.0 |
0.0 |
234.1 |
156.7 |
17.7 |
420.9 |
72.1 |
|
Chinese Pistachio |
0.7 |
0.0 |
0.0 |
0.0 |
0.0 |
0.7 |
0.0 |
|
Cootamundra Wattle |
0.0 |
0.0 |
0.0 |
0.0 |
2.8 |
208 |
2.1 |
|
Crack Willow |
3.7 |
0.0 |
9.6 |
38.2 |
0.0 |
51.5 |
12.0 |
|
Crown Vetch |
0.0 |
0.0 |
0.0 |
0.0 |
0.1 |
0.1 |
0.1 |
|
European Nettle Tree |
0.0 |
6.2 |
0.0 |
0.1 |
0.0 |
6.3 |
0.1 |
|
Firethorn |
0.0 |
7.8 |
4.4 |
0.0 |
0.0 |
12.1 |
0.3 |
|
Garden Asparagus |
0.0 |
0.6 |
0.0 |
0.0 |
0.0 |
0.6 |
0.0 |
|
Gazania |
0.0 |
0.0 |
0.0 |
0.0 |
0.4 |
0.4 |
0.3 |
|
Giant Knotwood |
0.0 |
0.0 |
0.0 |
3.4 |
0.0 |
3.4 |
1.0 |
|
Giant Parramatta Grass |
0.2 |
0.0 |
0.0 |
0.0 |
0.0 |
0.2 |
0.0 |
|
Goat Willow |
1.3 |
0.0 |
0.0 |
0.0 |
0.0 |
1.3 |
0.0 |
|
Gorse |
0.1 |
0.0 |
0.0 |
0.0 |
0.0 |
0.1 |
0.0 |
|
Hawthorn |
0.0 |
0.0 |
14.4 |
206.3 |
0.1 |
220.9 |
62.7 |
|
Honeysuckle |
0.0 |
0.0 |
0.0 |
0.5 |
0.0 |
0.5 |
0.2 |
|
Horehound |
0.0 |
0.0 |
0.0 |
238.5 |
0.0 |
238.5 |
71.6 |
|
Khaki Weed |
0.0 |
0.0 |
2.0 |
7.9 |
0.0 |
9.9 |
2.5 |
|
Madagascan Fireweed |
9.2 |
4.2 |
268.0 |
0.0 |
0.0 |
281.5 |
13.5 |
|
Moth Vine |
0.0 |
0.1 |
0.0 |
0.0 |
0.0 |
0.1 |
0.0 |
|
Nodding Thistle |
0.0 |
0.0 |
0.0 |
1163.0 |
3.9 |
1166.9 |
351.8 |
|
Oregon Grape |
0.0 |
0.0 |
9.2 |
0.0 |
0.0 |
9.2 |
0.5 |
|
Paterson’s Curse |
0.0 |
2.9 |
141.8 |
61.2 |
40.0 |
246.0 |
55.5 |
|
Periwinkle |
0.1 |
0.0 |
0.0 |
0.0 |
0.0 |
0.1 |
0.0 |
|
Poplar |
0.0 |
0.0 |
0.0 |
0.0 |
0.6 |
0.6 |
0.5 |
|
Potentilla |
0.0 |
0.0 |
0.0 |
30.7 |
0.0 |
30.7 |
9.2 |
|
Prickly Pear |
0.1 |
0.0 |
0.0 |
0.0 |
0.4 |
0.6 |
0.3 |
|
Radiata Pine |
2.3 |
0.0 |
33.8 |
0.0 |
0.0 |
36.0 |
1.7 |
|
Saffron Thistle |
0.0 |
0.0 |
4.3 |
5.8 |
4.2 |
14.3 |
5.1 |
|
Scotch Thistle |
0.0 |
0.0 |
18.6 |
253.7 |
18.8 |
291.2 |
91.1 |
|
Serrated Tussock |
68.7 |
477.3 |
1394.8 |
356.5 |
272.9 |
2570.2 |
336.8 |
|
South African Daisy |
0.3 |
0.0 |
0.0 |
0.0 |
0.0 |
0.3 |
0.0 |
|
St John’s Wort |
0.0 |
15.6 |
694.3 |
1524.5 |
1462.4 |
3696.7 |
1589.0 |
|
Stinkwort |
0.0 |
0.0 |
0.0 |
0.2 |
0.0 |
0.2 |
0.1 |
|
Sweet Briar |
0.0 |
338.7 |
728.1 |
159.0 |
664.0 |
1889.9 |
585.5 |
|
Sweet Vernal Grass |
0.0 |
0.0 |
0.0 |
1.9 |
0.0 |
1.9 |
0.6 |
|
Tall African Lovegrass |
0.0 |
0.0 |
1.0 |
35.5 |
70.8 |
107.3 |
63.8 |
|
Tree of Heaven |
0.0 |
0.0 |
0.1 |
0.0 |
4.2 |
4.3 |
3.2 |
|
Verbascum |
0.0 |
1.6 |
2.7 |
239.7 |
0.0 |
244.0 |
72.1 |
|
Western Australian Bluebell Creeper |
1.0 |
0.0 |
0.0 |
0.0 |
0.0 |
1.0 |
0 |
|
Willow Hybrid |
0.0 |
0.0 |
0.0 |
5.0 |
0.0 |
5.0 |
1.5 |
|
Total |
164 |
905 |
5471 |
7392 |
2704 |
16 637 |
4530 |
ha = hectare
Source: Taylor & Thomson100
Altered fire regimes
Why is this indicator important?
The ACT’s biological diversity has evolved in the presence of fire. However, altered fire regimes, resulting from management approaches or climate change, can disturb biodiversity. Plants have varying levels of tolerance to fire frequency, season of occurrence and intensity. Frequent burning can therefore result in the dominance of more fire-tolerant plant species (in the short term, this often includes weed species). Altered composition of vegetation communities may also disturb the composition of fauna due to changes in habitat, resource availability and predation.
Current monitoring status and interpretation issues
A fire regime for a particular region comprises the typical patterns of:
- fire frequency
- fire intensity
- season of fire occurrence
- fire type.
Interpreting changes in any one of these components or the interaction between them is complex and difficult.
Fire plays a crucial role in many Australian ecosystems, including those within the ACT, yet little is known about pre-European settlement fire regimes. Further research is required to fully understand how to interpret this indicator in terms of measurable impacts on biodiversity.
The data available to assess the alteration of fire regimes are very limited in the ACT. This is because most data are collected for managing emergency responses to bushfires and monitoring planned fire regimes, rather than assessing impacts on biodiversity. In addition, the ecological thresholds used for fire planning in the ACT are currently limited to vegetation recovery rather than fauna and habitat, noting that this is currently a challenge for all Australian jurisdictions.
This indicator is therefore measured with the following available metrics and assessments:
- number of bushfires (unplanned fires) and area burnt by vegetation type
- causes and origins of bushfires
- number of planned fires, completion rate by number, completion rate by area burnt, and number that satisfy the ecological guidelines applied to bushfire fuel-reduction activities to protect fire-sensitive species and ecological communities.
The ACT Strategic Bushfire Management Plan (SBMP) (Schedule 2) requires the Emergency Services Agency (ESA) to maintain records of:
- estimated annual fire damage
- other economic or ecological consequences.
The recording of the ecological consequences of bushfires is not required in the framework specified in the Australian Incident Reporting System reference manual. For this reason, the ESA keeps no record of the ecological consequences of bushfires in the ACT (Manager, Spatial Services ESA, pers comm by email, 26 June 2015).
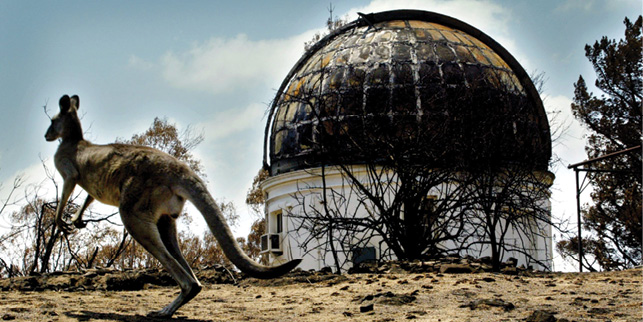
Large unplanned fires such as the 2003 Canberra bushfires can harm biodiversity when they occur frequently. This Eastern Grey kangaroo was a fortunate survivorPhoto: Andrew Meares, Fairfax Syndication
What does this indicator tell us?
Fire risk in the ACT is characterised by the following features:
- The topography of the ACT means that there is a heightened risk of bushfire from the north and west. In addition, 60% of the ACT consists of hills or mountains,101 which is significant because fire burns faster uphill.102
- The extensive ACT areas of forests, woodlands and grasslands are dominated by plant species that rapidly regenerate after fire and species that produce high fuel loads, such as planted pines and wildings.
- The combination of topography and vegetation, compounded by the warm, dry climate, exposes Canberra to a high risk of bushfire.
- Variations in weather and rainfall, and emergency response capacity mean that any trend in frequency and size of fires may not be observed during the 2015 reporting period, or even during the past three reporting periods (ie from 2004). Nine large fires have occurred since the beginning of the 20th century, including the worst in January 2003.103 None have occurred in the past three reporting periods.
Number of bushfires and area burnt
Each year, the ACT records the number of unplanned fires more than 1 hectare in size by vegetation type (Figure 7.36). Unplanned fires have declined since reporting began in 2004; however, the change in the proportion of unplanned fires occurring within each vegetation type has remained relatively stable.
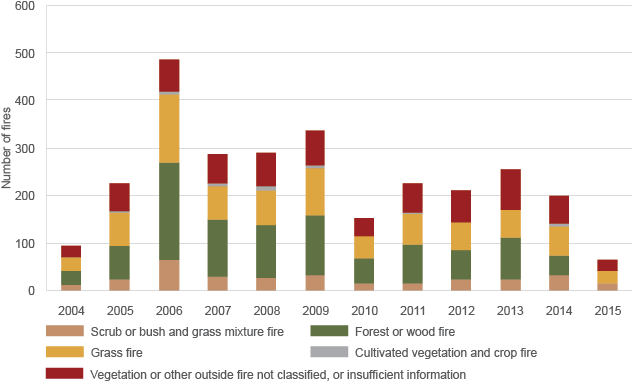
Source: Data provided by ACT Emergency Services Agency
Figure 7.36 Unplanned fires by vegetation type, 2004–2015
In the ACT, unplanned fires are also categorised into areas below or above 1 hectare (Table 7.19). Fires in grassland and mixed vegetation (scrub–bush–grass) are typically 1 hectare or more in size, while forest or woodland fires are typically less than 1 hectare in size. The 2014 and 2015 records diverge from this pattern; however, it is too early to tell whether this is an isolated anomaly or will become an established pattern.
Table 7.19 Number of unplanned fires in native vegetation types, by size, 2004–2015
| Vegetation description | 2004 | 2005 | 2006 | 2007 | 2008 | 2009 | 2010 | 2011 | 2012 | 2013 | 2014 | First half of 2015 (to 30 June) |
|---|---|---|---|---|---|---|---|---|---|---|---|---|
|
Scrub or bush and grass mixture fire <1 ha |
0 |
0 |
0 |
0 |
0 |
0 |
0 |
0 |
0 |
0 |
14 |
14 |
|
Scrub or bush and grass mixture fire >1 ha |
13 |
24 |
66 |
29 |
28 |
33 |
16 |
16 |
23 |
23 |
20 |
0 |
|
Forest or wood fire <1 ha |
28 |
71 |
201 |
119 |
107 |
122 |
51 |
78 |
63 |
88 |
37 |
0 |
|
Forest or wood fire >1 ha |
1 |
0 |
3 |
2 |
2 |
3 |
1 |
3 |
0 |
2 |
2 |
0 |
|
Grass fire <1 ha |
0 |
0 |
0 |
0 |
0 |
0 |
0 |
0 |
0 |
0 |
27 |
24 |
|
Grass fire >1 ha |
28 |
68 |
143 |
69 |
74 |
101 |
46 |
64 |
59 |
57 |
36 |
2 |
ha = hectare
There is a correlation between unplanned fires and yearly rainfall (Figure 7.37). This correlation suggests a long-term outlook for an increase in unplanned fires as the effects of climate change and decreased rainfall in the ACT region increase. Climate models predict that the ACT will experience an increase in average and severe Forest Fire Danger Index in the near future (2020–2039) and the far future (2060–2079).104
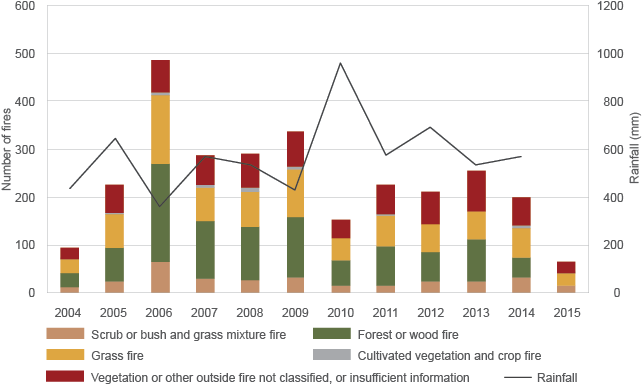
Source: Data provided by the Bureau of Meteorology, http://www.bom.gov.au/climate/data/stations
Figure 7.37 ACT unplanned fires and yearly rainfall, 2004–2015
Causes and origins of bushfires
The SBMP requires the ESA to maintain records of bushfire:
- origins (where and when they originated)
- causes (sources and causes, if known).
The data suggest that there has been no change to the broad pattern of ignition factors for bushfires between 2007–2011 and 2011–2015 (Figure 7.38).
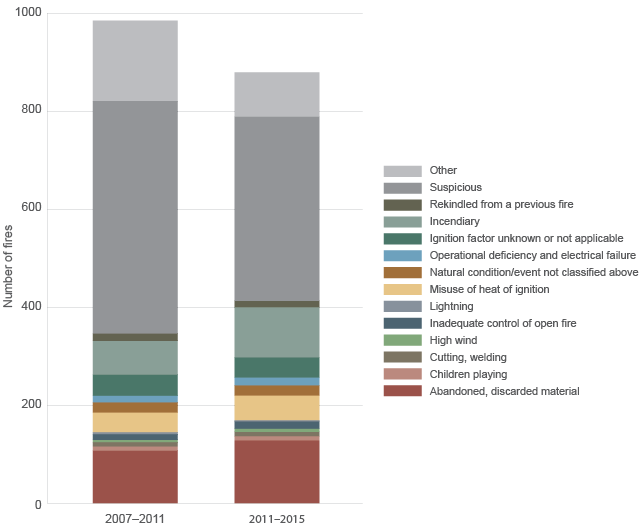
Source: Data provided by the ACT Emergency Services Agency
Figure 7.38 Number of unplanned fires, by ignition factor, 2007–2015
Number of planned fires and completion rate
In the ACT, planned fires play a primary role in the management of fuel. Planned fires are used for ecological purposes, or combined ecological and asset protection purposes.
The SBMP105 states that ‘ecological burning is the undertaking of prescribed burns for the primary purpose of enhancing biodiversity’. The SBMP lists the principles underpinning ecological burns:
- All areas will be assessed in the season before burning to confirm they have suitable cover and condition where ecological burning is warranted.
- All ecological burns aim to burn the grasslands below the woodland and not the riparian areas, fens or bogs.
- Some grassland areas will be burnt in areas identified for fuel management objectives.
- Ecological burns have only been identified on Territory and Municipal Services (TAMS) – managed land and do not include leased land.
- Generally, ecological burning will be undertaken at the same time as other burns in the area, unless a specific seasonal condition is required.
In addition, the 2012–13 Ecological Guidelines for Fuel and Fire Management Operations106 provide a set of actions to guide the conservation of the ACT’s ecological assets, during the planning and implementation of the annual TAMS Bushfire Operational Plan. In summary, these guidelines specify that:
- prescribed burns should primarily be of a low intensity (<10% crown scorch) and patchy across the burn area
- the use of firefighting foam should be minimised near water bodies (presumably because of its toxicity to aquatic species)
- firefighting retardants should only be used in identified areas
- waterways, riparian zones, highland bogs and fens, and wetlands should be excluded from planned burns
- significant thickets of shrubby vegetation should not be burnt in spring, to avoid the primary bird nesting season
- burns in Button Wrinklewort habitat should be restricted to between April and November to avoid the summer flowering and fruiting season
- no burning of Black Cypress Pine should occur
- burning in areas of Smoky Mouse habitat should be of a low intensity and patchy
- no burning of Northern Corroboree Frog habitat, or Tarengo Leek Orchid and Tuggeranong Lignum locations should occur
- only low-intensity burns should occur in areas where the Showy Parrot-Pea is located.
This report is unable to report on the number of planned fires undertaken in the ACT for the primary purpose of managing the ecological condition of an area. Fires are often undertaken for multiple purposes, including asset protection, ecological protection and conservation, making demarcation of these different purposes difficult. Small patch mosaic burning in the grasslands of Jerrabomberra East was undertaken in 2013 and 2014 for the primary purpose of reducing grass thatch and improving intertussock spacing for the endangered Grassland Earless Dragon.
In the ACT, fire ecologists from CPR assess and provide management advice on the potential impacts of planned fires on species and ecological communities. In 2011–2015, all pre-burn assessments met the ecological guidelines (Table 7.20). However, it is estimated that less than 25% of prescribed burns are subject to assessment pursuant to the guidelines.
It must be noted that a single fire not meeting ecological guidelines can have significant impacts. CPR has stated that in the 2014–15 fire season:
Of particular interest was the Cotter River prescribed fire, conducted in the Upper Cotter. Several days of pre-burn field assessments were conducted to investigate the potential of adverse impacts of this activity resulting in the preparation of geographically explicit ecological guidelines. This fire escaped containment lines during the execution phase and unexpectedly impacted 255 ha of adjacent lands, and a range of ecological assets. Ongoing monitoring of the impacts of this fire has commenced and will continue through subsequent years. Environment and Planning Directorate107
Table 7.20 Prescribed burns subject to pre- and post-fire ecological assessment, 2011–2015
| Fire season | Planned prescribed burns subject to pre-assessment | Planned prescribed burns pre-assessed as meeting ecological guidelines | Prescribed burns completed | Planned prescribed burns subject to post-event monitoring |
|---|---|---|---|---|
|
2011–12a |
NA |
NA |
NA |
5 |
|
2012–13 |
39 |
39 |
47 |
7 |
|
2013–14 |
50 |
50 |
26 |
5 |
|
2014–15 |
83 |
83 |
22 |
10 |
NA = not available
a In 2011–12, the ACT region experienced La Niña weather patterns that resulted in well above average rains throughout the summer and autumn. This resulted in a high number of planned prescribed burns being abandoned, and the associated planned monitoring was similarly reduced, with only 5 of the planned 10 monitoring activities being undertaken.
Direct environmental offsets
Why is this indicator important?
Direct offsets are land added to environmental reserves to address potential development pressures. In the ACT, offsets provide ‘environmental compensation’ for ‘a development that is likely to have adverse environmental impact on a protected matter.108,
Direct offsets are an indicator of land area added to the reserve system, and also of the areas of nationally significant ecological communities and/or protected matters given over to development.
Current monitoring status and interpretation issues
In the ACT, offsets are categorised as those that are:
- required under the EPBC Act to compensate for the residual adverse impacts of an action on a matter of national environmental significance109
- required under the ACT Planning and Development Act 2007 (the Planning Act) to provide environmental compensation for the likely impact on a declared protected matter.
There are differences between offsets, which are part of:
- project-by-project development approvals under Parts 8 and 9 of the EPBC Act
- approvals made as part of a strategic assessment under Part 10 of the EPBC Act
- offset requirements under the Planning Act.
This indicator provides information on EPBC offsets only. To date, there have been no offsets required under the Planning Act.
Until early 2015, there was no systematic approach to the recording of offsets required under Parts 8 or 9 of the EPBC Act. This was problematic because it meant that the potential cumulative or combined impacts of development and the potential improvements to EPBC-listed ecological communities and species were not being recognised or addressed.
The ACT Government is in the process of redressing this issue. The ACT Environmental Offsets Policy Delivery Framework,110 released in April 2015, provides for the development and maintenance of a publicly available register of offset sites. The register will record details such as the location of the offset, the relevant protected matters and ongoing management actions. There is also now an environmental offsets layer included on the ACT Government’s interactive mapping service, ACTMAPi.
What does this indicator tell us?
Offsets under Part 9 of the EPBC Act that were approved in the ACT are summarised in Table 7.21. Detail about the offsets is provided where available.
Table 7.21 ACT offsets under the Environment Protection and Biodiversity Conservation Act 1999 (Cwlth), 2015
| Location | Approval | Area affected | Matter of NES | Location (offset) | Size (offset) |
|---|---|---|---|---|---|
|
Block 2 Section 5 and Block 2 Section 13, Lawson |
EPBC 2010/5549 |
42 ha (in a 100-ha site) |
Golden Sun Moth habitat Natural Temperate Grassland |
Jarramlee (Macgregor West) |
112 ha |
|
Block 799, Gungahlin |
EPBC 2010/5750 |
14.56 ha |
Striped Legless Lizard habitat |
Gungaderra and Mulanggari grasslands |
Combined total 44.4 ha |
|
Rural Block 2227, Hume |
EPBC 2011/5808 |
9.8 ha (in a 35.69-ha site) |
Box–Gum Woodland |
Isaac Ridge Nature Reserve |
No available data. The size of this offset is subject to the development and approval of an Offsets Management Plan |
|
University of Canberra |
EPBC 2013/6987 |
7.6 ha (in a 12.6-ha site) |
Box–Gum Woodland |
Pinnacle Nature Reserve |
Not yet approved, but interim management plan suggests 15.5 ha Box–Gum Woodland |
|
Campbell Section 5 |
EPBC 2012/6292 |
6.37 ha, based on an ACTMAPi estimate |
Golden Sun Moth habitat and Natural Temperate Grassland |
Yarralumla Equestrian Park offset area |
No less than 4.6 ha of Golden Sun Moth habitat and no less than 0.5 ha of Natural Temperate Grassland |
|
Watson |
EPBC 2012/6418 |
4 ha |
Box–Gum Woodland |
Justice Robert Hope Park |
No available data. The size of this offset is subject to the development and approval of an Offsets Management Plan |
ha = hectare; NES = National Environmental Significance
Source: ACT Environment and Planning Directorate, http://www.planning.act.gov.au/topics/design_build/da_assessment/environmental_assessment/offsets_register
Jarramlee offset 2013
The Jarramlee offset is 112 ha and located on the north-western boundary of the ACT (Figure 7.39). The offset met the requirements of the approval decision (EPBC 2010/5549) for the Lawson Residential Estate (Block 2 Section 5 and Block 2 Section 13, Lawson). It compensates for impacts to the Golden Sun Moth habitat and Natural Temperate Grassland at Lawson.111
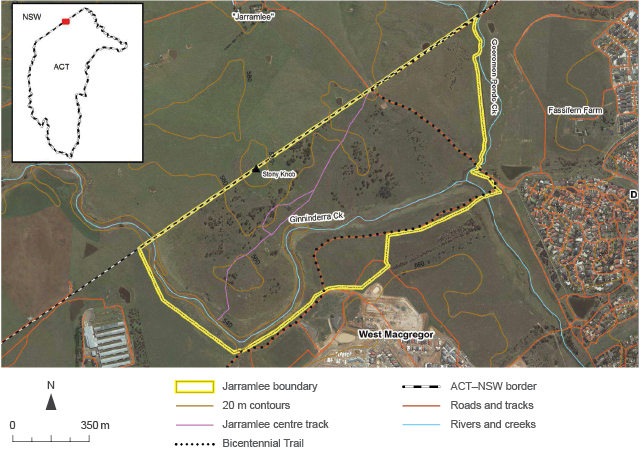
Figure 7.39 Jarramlee offset 2013
The reserve borders rural grazing land within both the ACT (agisted and leased land) and NSW (freehold). It is also less than 200 m from the suburbs of Dunlop and West Macgregor. The property is contiguous with the West Macgregor offset site (EPBC 2010/5520), approximately 1.1 km south-west of the Dunlop Grasslands Nature Reserve and 2.6 km north-east of the Woodstock Nature Reserve.
The Jarramlee offset includes (Figure 7.40):
- 1.8 ha of high-quality Golden Sun Moth habitat
- 26.4 ha of medium-quality Golden Sun Moth habitat
- 20.0 ha of low-quality Golden Sun Moth habitat.
Jarramlee also has significant (potential) connectivity benefits for the Golden Sun Moth (see ‘Connectivity of terrestrial native vegetation’ in Section 7.3.1).
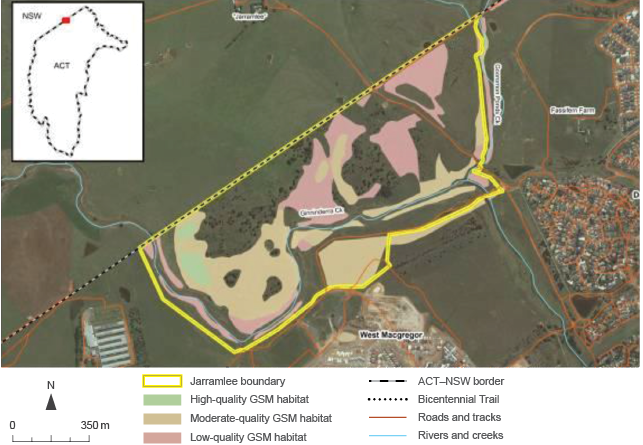
GSM = Golden Sun Moth
Figure 7.40 Golden Sun Moth habitat in Jaramlee, quality and extent
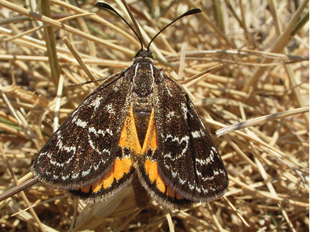
The Golden Sun Moth is an endangered species in the ACTPhoto: ACT Government
A total of 4.65 ha of Natural Temperate Grassland is located in small patches primarily within the north-eastern and western corners of the reserve (Figure 7.41). These patches are dominated by either Kangaroo Grass (Themeda australis) or wallaby grasses (Rytidosperma spp.). They are surrounded by lower-quality native pasture. Rehabilitation of these areas may lead to an increase in the extent of Natural Temperate Grassland.112
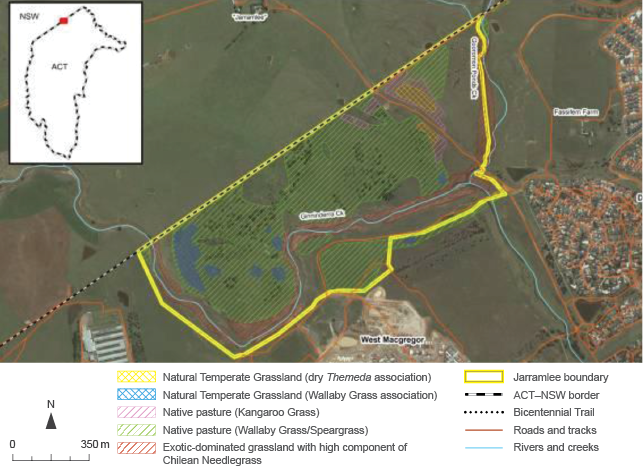
Figure 7.41 Natural Temperate Grassland in Jaramlee, quality and extent
Extension to Gungaderra and Mulangarri nature reserves
In 2011, the Land Development Agency obtained a conditional approval to develop cabin, camping and possible hotel accommodation on Block 799, Gungahlin.
The development affects Striped Legless Lizard and Golden Sun Moth habitat. The approval conditions included the following offsets for these two species:
- protect Striped Legless Lizard habitat
- at a ratio of approximately 3:1 for habitat to be removed, which adjoins an existing conservation area in North Canberra that is known to contain habitat for the species; or
- at a ratio of approximately 4:1 for habitat to be removed, if the offset area does not adjoin an existing conservation area in North Canberra that is known to contain habitat for the species.
- protect Golden Sun Moth habitat
- in perpetuity at a ratio of 3:1; or
- contribute to research in, or improved management of, existing grassland reserves that contain habitat for the Golden Sun Moth.
Extension to Isaacs Ridge Nature Reserve (expansion of the Mugga Lane Resource Management Centre)
In 2013, ACT NOWaste received approval under the EPBC Act to expand the putrescible waste landfill facility on Rural Block 2227, Hume, provided that an offset for the loss of up to 9.8 ha of Box–Gum Woodland was incorporated into the Isaacs Ridge Nature Reserve for conservation purposes. The size of this offset is subject to the development and approval of an Offsets Management Plan.
Extension to the Pinnacle Nature Reserve (University of Canberra Public Hospital development)
In 2014, the Australian Government approved an application by the ACT Health Directorate to construct a new subacute hospital on the grounds of the University of Canberra in Bruce, provided that an offset for the loss of up to 7.6 ha of Box–Gum Woodland was incorporated into the Pinnacle Nature Reserve for conservation purposes. The size of this offset is subject to the development and approval of an Offsets Management Plan. The interim management plan refers to an offset area of 15.5 ha of Box–Gum Woodland.
Gungahlin Strategic Assessment
On 20 June 2013, the Gungahlin Strategic Assessment Plan was endorsed by the Australian Government Minister for the Environment. The plan provides for urban and related development in the Gungahlin district, including protection and management of defined conservation areas.113
Figure 7.42 shows the Gungahlin Strategic Assessment area, as well as areas designated for development and conservation. Table 7.22 summarises the total area affected within each suburb as a result of direct actions under the plan. Table 7.23 shows the hectares of listed ecological community and species to be affected by the development.
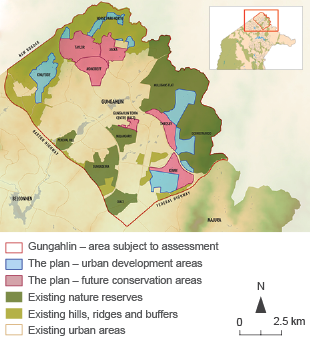
Figure 7.42 Gungahlin Strategic Assessment area
Table 7.22 Areas affected by the Gungahlin Strategic Assessment Plan
| Suburb | Area affected (ha) |
|---|---|
|
Gungahlin Town Centre (east) |
36 |
|
Horse Park north broadacre |
0 |
|
Jacka |
150 |
|
Kenny |
173 |
|
Kenny broadacre |
– |
|
Kinlyside |
– |
|
Moncrieff |
191 |
|
Taylor |
280 |
|
Throsby |
132 |
|
Total |
962 |
– = not applicable
Table 7.23 Summary of impacts to matters of National Environmental Significance
| Protected matter of NES | Approximate area (ha) |
|---|---|
|
Box–Gum Woodland |
126 |
|
Golden Sun Moth |
180 |
|
Superb Parrot |
0 (direct) |
|
Striped Legless Lizard |
up to 20 |
|
Pink-Tailed Worm Lizard |
0 |
ha = hectare; NES = National Environmental Significance
Tables 7.22 and 7.23 do not include disturbance to certain areas adjacent to the urban areas for the purpose of bushfire hazard management, or indirect impacts such as increased levels of noise, light, human activity, weeds and other invasive species.
Under the endorsed Gungahlin Strategic Assessment Plan, the Australian Government approved a range of direct offsets (Table 7.24).
Table 7.24 Direct offsets approved under the endorsed Gungahlin Strategic Assessment Plan
| Listed matter | Size of impact (ha) | Location of offset | Size of offset (ha) | Offset conditions |
|---|---|---|---|---|
|
Box–Gum Woodland |
126 |
Kinlyside, Kenny and Throsby |
About 104 |
Improving the condition of sites that do not meet the listing definition |
|
Golden Sun Moth |
180 |
≤140 of areas that are suitable |
None |
|
|
Superb Parrot |
Indirect impacts |
– |
All currently known breeding sites and the majority of potential nesting sites within 100 m will be protected |
|
|
Striped Legless Lizard |
20 |
West Kenny |
Exact area not specified |
Establishment of a new nature reserve. Improvement in condition of 111 ha |
ha = hectare
Molonglo Strategic Assessment
In late 2011, the Australian Government endorsed and subsequently approved ‘all actions associated with urban development in East Molonglo as described in the Molonglo Valley Plan for the Protection of Matters of National Environmental Significance (NES) provided such action takes place wholly within the strategic assessment area in East Molonglo’.
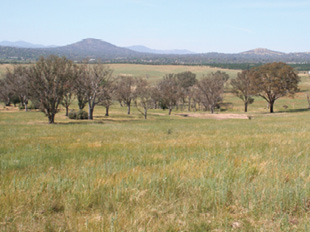
Box–Gum Woodland at the site of the Molonglo developmentPhoto: ACT Government
Figure 7.43 shows the extent and condition of EPBC-listed Box–Gum Woodland in relation to the strategic assessment and development areas. Figure 7.44 shows the extent and condition of Pink-Tailed Worm Lizard habitat in relation to the strategic assessment and development areas. Figure 7.45 shows the areas that will be used to offset the residual impacts of development actions on Box–Gum Woodland and Pink-Tailed Worm Lizard habitat.
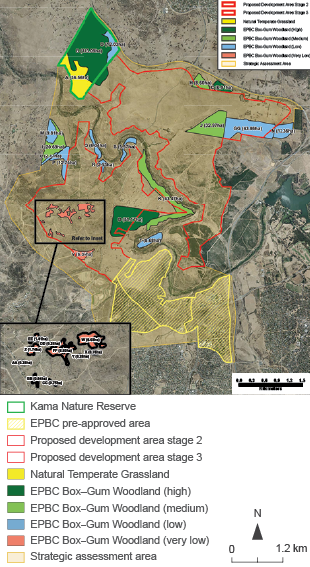
Figure 7.43 EPBC-listed Box–Gum Woodland areas, extent and condition
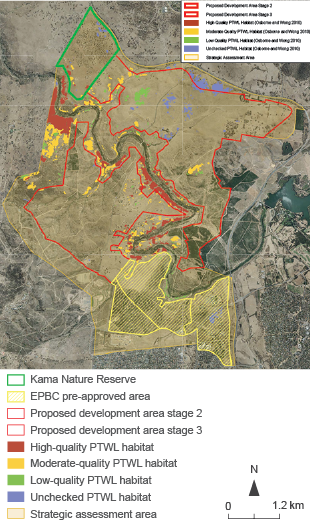
PTWL = Pink-Tailed Worm Lizard
Figure 7.44 Pink-Tailed Worm Lizard habitat, extent and condition
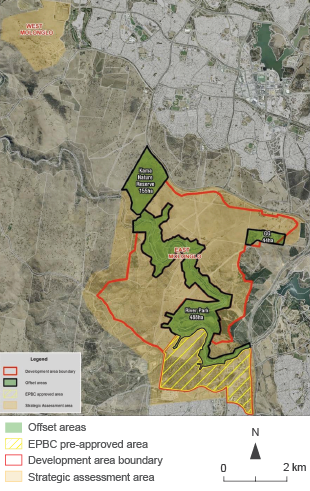
Figure 7.45 Areas that will be used to offset the impact of development of Box–Gum Woodland and Pink-Tailed Worm Lizard habitat
Indirect environmental offsets
Why is this indicator important?
Indirect offsets indicate that there is no compensatory site available for direct offsetting. In a hierarchy of priorities, indirect environmental offsets are a measure of last resort. They are invoked only where other management actions – avoid, mitigate and directly offset – are not available.
Recording the extent and type of indirect offsets is important, because this process is likely to affect the state of biodiversity in both the short and long terms. In the short term, there has been a loss in the extent of certain habitat types, but there is a presumption that there will be a long-term improvement in the state of biodiversity as a result of the indirect offsets (with some uncertainty, because we cannot predict the effects of education and other investments on biodiversity). Therefore, the extent and type of use of the indirect offsets approach is an indicator of both some short-term negative effects and some longer-term possible benefits.
Current monitoring status and interpretation issues
For EPBC-listed matters of NES, indirect offsets or compensatory measures can include education and training, research or projects that relate to the matter of NES that is affected.
For ACT-protected matters, in addition to education, training or research, compensatory measures may include broad habitat processes that improve outcomes for a broad range of species, not just the species impacted by the development. This might include providing funds for improving general connectivity or for establishing buffer areas around significant habitat areas.
As for direct offsets, indirect offsets are intended to produce a ‘conservation gain’. However, in the ACT, there are no objective criteria or quantitative benchmarks to establish whether a conservation gain has been achieved. There is also no way of establishing to which approved impact the indirect offsets apply. This is because, for all indirect offsets approved to date, the link or relationship between the indirect offset and the ecological community or species affected is indeterminate.
The development and design of indirect offsets approved as part of the Gungahlin Strategic Assessment approval is subject to cost–benefit analysis.114 The plan does not contain a methodology for conducting such a cost–benefit analysis.114 A cost–benefit analysis, as applied to the use of indirect offsets, requires the ability to:
- quantify the conservation outcomes achieved by the indirect offset
- place a monetary value on the conservation outcome.
There has been no allocation of resources to gather necessary information or conduct the necessary assessments for either of these steps.
Note that this indicator reports on indirect offsets as commitments made to the Australian Government. It does not report on the status of implementation or timing of delivery of the offsets. The 2013–14 TAMS annual report reports on the implementation and progress of less than half of these offsets; no other information denoting implementation or progress status was available for this indicator.
What does this indicator tell us?
Indirect offsets have been used in the ACT on a statutory basis only since December 2011. On this date, the ACT Government received its first EPBC Act approval decision for a plan endorsed as part of a strategic assessment (under s. 146B).
Since the latest ACT State of the Environment Report, two strategic assessments have been approved containing indirect offsets.
Gungahlin Strategic Assessment Biodiversity Plan
The Gungahlin Strategic Assessment Biodiversity Plan contains the following indirect offsets. These indirect actions are conditions of the Australian Government’s approval for the development of Gungahlin:
- Establishment of a Gungahlin Strategic Plan Implementation Team to oversee implementation of (direct and indirect) offset measures, with responsibilities for implementation, procurement, monitoring, reporting, application of the principles of adaptive management and associated measures under the plan.
- Collection and collation of baseline ecological and biophysical information for all new reserve areas in addition to new areas of hills, ridges and buffers as identified in the avoidance measures.
- Research into the management of the Superb Parrot in proximity to urban development, particularly in relation to producing a population viability analysis. The plan states that the aim of this project is to support a research project to better understand factors such as nest site fidelity, annual breeding success and factors that influence it, breeding strategies (eg polygamy or monogamy), fecundity, and population dynamics over time.
- Infrastructure in protected areas to be designed to minimise impacts on matters of NES. Should any infrastructure or groundworks be required within protected areas, the implementation team must be consulted during design and approval of Construction Environment Management Plans (CEMPs).
- Urban design to mitigate impacts to adjacent areas and managed during construction with comprehensive CEMPs. Actions in relation to design and construction include
- preconstruction surveys to determine clearing boundaries and identify rehabilitation actions, such as for woody debris relocation
- geotechnical, surface water and groundwater assessment to minimise impact to local hydrological systems
- preclearing ecological inspections and procedures to be followed for wildlife rescue and relocation
- clearing outside of threatened bird species’ breeding seasons, and clearing of hollow-bearing trees to have fauna rescue procedures in place
- ensuring that all developments are surrounded by an edge road to minimise the requirements for bushfire hazard management, to improve passive surveillance and to control invasive species
- placing low-intensity land uses in areas that might otherwise result in disturbance to species during critical lifecycle stages (eg Superb Parrot breeding)
- selecting materials to limit noise and light incursion into reserved or retained natural areas
- placing transport and utility infrastructure in a way that reduces or avoids ongoing impacts to adjoining areas from either operation or periodic maintenance
- placing recreational facilities, including playgrounds and bike/pedestrian paths, in areas that do not lead to inappropriately increased human activity adjacent to sensitive areas
- selecting appropriate plants for landscaping, including considering species that will provide future foraging or shelter opportunities to wildlife. Particular consideration is to be given to improving connectivity and flight paths for species such as the Superb Parrot, which disperse south to the Belconnen district and the Molonglo Valley
- liaising with appropriately qualified professionals, experienced in the biology and management of the matters of NES known to occur in Gungahlin, during the design stages before construction starts, to ensure that optimal design solutions are prescribed.
- Control programs for ruderal species (those encouraged by urban development that are not usually a focus of control) such as the European Wasp (which may prey on Golden Sun Moths), Common Myna, Noisy Miner and stray cats; declaration of further cat containment areas and a funded compliance program; and landscape-scale coordinated cross-tenure feral animal and weed control program.
- Salvage and relocation of structural habitat elements, such as fallen logs, targeting Superb Parrot and other woodland birds during construction. Plantings to improve connectivity and wildlife movement along Gungaderra and Sullivans creeks, targeting Superb Parrot movement corridors.
Molonglo Valley Plan for the Protection of Matters of National Environment Significance
The Molonglo Valley Plan for the Protection of Matters of NES contains the following indirect offsets. These indirect actions are conditions of the Australian Government’s approval for the development of Molonglo.
One indirect offset is a research project examining the long-term survival of Pink-Tailed Worm Lizards in an urbanised landscape. The research project will adopt a three-stage approach:
- Mount Taylor, a reserve unit within Canberra Nature Park, is surrounded by an urban matrix (housing, roads, facilities, easements, etc). The first stage of the study will look at habitat disturbance, including fragmentation, and the effects of habitat proximity to urban areas. The project will also develop low-impact survey and monitoring techniques for the species. The outcomes of this research will be applied to management within the East Molonglo strategic assessment area.
- The results of the Mount Taylor study will be incorporated into the second stage of the project. The second stage will involve
- extensive survey work, to determine population densities in areas of low-, moderate- and high-quality Pink-Tailed Worm Lizard habitat in the strategic assessment area
- field trials, to be conducted in areas of low-quality habitat only, involving different methods of translocation
- research and field trials, involving methods for reducing habitat fragmentation and increasing connectivity.
- Monitoring the Pink-Tailed Worm Lizard in the strategic assessment area is vital to ensure the long-term survival of the population. Monitoring also provides a warning system if the population or habitat begins to show any signs of decline. This third stage of the project provides a link between the second stage of the research and the monitoring of Pink-Tailed Worm Lizard in the strategic assessment area. Where population and habitat monitoring show any change from baseline data, the results of the second stage research will be applied to establish possible causes and to mitigate adverse impacts.
Another indirect offset is an off-site restoration project involving seed collection from within the strategic assessment area, with the aim of using it as a resource for Box–Gum Woodland restoration within a degraded area of woodland in the strategic assessment area. Seed is also to be stored for potential use in future restoration projects. The program is to be delivered through six key restoration stages:
- Site assessment and recommendations. Field visits will be conducted to Box–Gum Woodland sites that will be lost to development and to sites that will be kept and improved, to identify the presence and frequency of native and exotic plant species. Following assessment, recommendations will be made of which species to introduce, reintroduce or increase under-represented populations. The project will investigate the merits and processes of translocating Box–Gum Woodland species from areas to be lost into a designated area within the strategic assessment area (especially key understorey species). It will also develop a seed supply and propagation works plan, drawing on the availability of plant material for collection from nearby sites of higher quality.
- Rehabilitation scoping study. The project will scope a woodland revegetation and restoration plan that will incorporate development stages, weed management and local knowledge about species availability and successful re-establishment approaches.
- Seed supply and plant rescue for future use at a designated area within the strategic assessment area. This will involve the identification of current provenance stock in regional seed banks that would be suitable for use in high-conservation Box–Gum Woodland restoration; the collection, processing and storage of needed seed in accordance with the national code of practice, FloraBank116; and rescuing plants or collecting plant material from species of signifigance that will be destroyed – this may involve establishing temporary or permanent seed production areas in consultation with the ACT Government.
- Plant production. The project will seasonally propagate plants in accordance with the rehabilitation plan (eg quantities and species).
- On-ground rehabilitation works. The project will deliver staged works in accordance with the rehabilitation plan and appropriate season.
- Monitoring and evaluation. Finally, the project will establish benchmark data and monitor rehabilitation success using scientifically credited performance measurements already adopted by regional leaders in rehabilitation assurance. Throughout the duration of the 30-year plan, results will be used to review on-ground ecological performance and, where relevant, implement best-practice change or modification.
The last direct offset is a project to monitor the condition of the Box–Gum Woodland patches each year (total area of 45.4 ha, see Figure 7.43) on the western boundary of East Molonglo to ensure that fuel hazard management is not negatively affecting the Box–Gum Woodland values. Should the monitoring show that, for two consecutive years, more than 30% of the combined area no longer meets the EPBC Act–listing criteria, then the ACT Government will establish an offset site within two years that will include a minimum of 90.8 ha of EPBC Act–listed Box–Gum Woodland established as a nature reserve. The plan does not specify where this offset would be located.
Assessment summaries
for indicators of biodiversity pressures
| Indicator | Reasoning | Assessment grade | Confidence | |||||
|---|---|---|---|---|---|---|---|---|
| Very low | Low | Moderate | High | Very high | In state grade | In trend grade | ||
| Distribution (and abundance where possible) of non-indigenous species (plants and vertebrate animals) identified as pests | Plant and animal pests are generally accepted to be major threats to biodiversity. In the human-populated parts of the ACT, cats and Indian Mynas appear to be having major impacts. However, confidence in either grade or trend cannot be high, because there is little specific assessment of the effects of pests and weeds on biodiversity | Stable | Evidence and consensus too low to make an assessment | Evidence and consensus too low to make an assessment | ||||
| Fire | Although fire can have a major impact on biodiversity, it appears that fire planning and management has limited and will limit this impact within the ACT. Uncertainty about grade and trend comes from the limited data on effects of fire on biodiversity in the ACT | Stable | Limited evidence or limited consensus | Limited evidence or limited consensus | ||||
| Direct environmental offsets | By definition, it is assumed by the ACT Government that offsets will result in a net zero or positive impact on biodiversity in the long term. There can be limited confidence in grade and trend because insufficient data have been collected to assess the cumulative impacts of multiple offsets | Stable | Evidence and consensus too low to make an assessment | Evidence and consensus too low to make an assessment | ||||
| Indirect environmental offsets | By definition, it is assumed by the ACT Government that offsets will result in a net zero or positive impact on biodiversity in the long term. Confidence in grade and trend cannot be assessed because we know of no investigations of whether indirect offsets have achieved their desired outcomes | Stable | Evidence and consensus too low to make an assessment | Evidence and consensus too low to make an assessment | ||||
Recent trends
Confidence
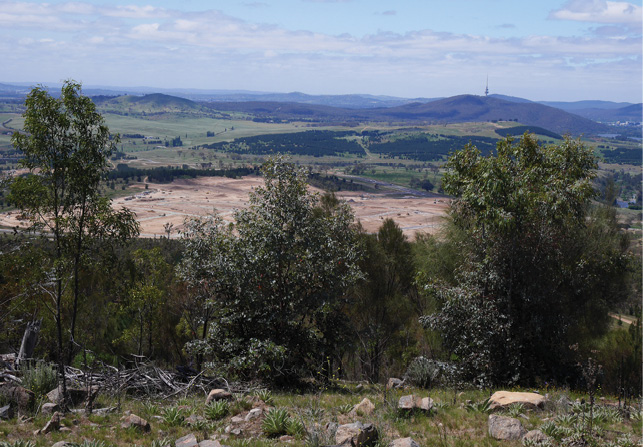
Vegetation clearance at the Molonglo development is clearly visible from Mount StromloPhoto: Office of the Commissioner for Sustainability and the Environment
Resilience to pressures
A resilience assessment involves looking at the systems, networks, human resources and feedback loops involved in maintaining environmental values (see Chapter 10).
The ACT systems that support biodiversity are not highly resilient.
Although the ACT does have strong reserve networks and landscape strategies intended to help maintain biodiversity, the codification of conservation values in legislation and action focuses on species and ecological communities known to be under threat, with less specification of desired management outcomes for species and communities not under threat. Similarly, while there is public debate about conserving biodiversity, this debate often focuses on large fauna and iconic species, with less focus on the full suite of biodiversity.
In addition, although threats that have an immediate or visible effect on biodiversity are well recognised – such as invasive weeds and pest animal species, diseases, climate change and land development – incremental processes that occur over long periods are not as well understood.
There is also a lack of systematic monitoring of biodiversity pressures and outcomes, and a lack of clear definition of thresholds at which biodiversity may change dramatically.
Measurement of biodiversity principally occurs in short-term, site-specific studies conducted when a major development is proposed, with little systematic or long-term landscape-scale monitoring (with the exception of some key research sites, such as Mulligans Flat). There is a lack of clarity on thresholds at either the ecosystem-, landscape- or species-specific scales, and the lack of baseline data makes it particularly difficult to identify thresholds. The ACT Scientific Committee responds to queries and suggestions, and investigates threatening processes. However, this process focuses on existing threats to biodiversity, rather than on proactive monitoring and action to prevent these thresholds being reached. Some thresholds are reasonably well defined – for example, thresholds relating to landscape connectivity and fire risk are considered in planning. Other thresholds relating to ecosystem function are harder to identify in both the ACT and other regions. Resourcing of monitoring programs linked to the development of knowledge on thresholds is a challenge.
This challenge, together with a lack of resourcing for systemic and adaptive management, leads to outcomes in which management investment typically occurs after a species or ecological community is already under threat, reducing effectiveness.
On a positive note, there are strong networks underpinning some aspects of biodiversity management. For example, the Territory-Wide Risk Assessment process (focused on fire) and some key networks help manage biodiversity issues at a landscape scale. There is also engagement with universities and stakeholders on key issues, and strong public interest in aspects of biodiversity. However, regional biodiversity networks beyond ACT borders are limited in terms of resourcing and presence, and maintaining volunteers in groups such as volunteer firefighting and Landcare can be difficult. A key challenge for all networks is availability of ongoing resourcing; often short-term allocation of funding makes long-term planning problematic.
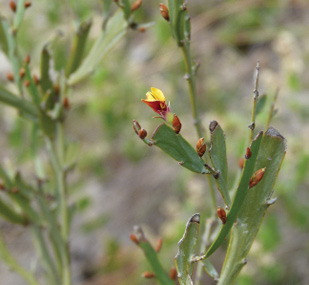
Close up of the endangered Murrumbidgee Bossiaea. During the reporting period an action plan was created to define conservation measures for the species in accordance with the Nature Conservation ActPhoto: ACT Government
a Section 111 of the Nature Conservation Act 2014 states that the Minister must include the categories of ‘rare and data-deficient’ species in the prescribed protected native species list. This list (the Nature Conservation Protected Native Species List 2015 [No. 1], Notifiable Instrument NI2015–317) has no species listed under the rare or data-deficient categories.
b The taxonomy for this species is not completely settled; refer to http://www.iucnredlist.org/details/22704803/0.
e Critical habitat parameters for Murrumbidgee Bossiaea are thought to be the Murrumbidgee and Paddys river areas, but this is not certain (Greg Baines, pers comm, 6 October 2015).
f The FVS is a commonly used method to assess the conservation value of sites in grassy ecosystems in the ACT and surrounding NSW region.
g Least-cost pathway analysis is a distance analysis tool (used in geographical information systems) that uses the least-cost path or the path between two locations that costs the least to those travelling along it to determine the most cost-effective route between a source and destination. Cost can be a function of time, distance or other criteria that are defined by the user.
h The Interim Biogeographic Regionalisation for Australia classifies Australia’s landscapes into 89 large geographically distinct bioregions, based on common climate, geology, landform, native vegetation and species information (see http://www.environment.gov.au/land/nrs/science/ibra#ibra).
i See the National Reserve System Scientific Framework for more information at http://www.environment.gov.au/parks/nrs/science/scientific-framework.html.
j IUCN categories can be found at http://www.iucn.org/about/work/programmes/gpap_home/gpap_quality/gpap_pacategories/.
k Previously, the Flora and Fauna Committee (Nature Conservation Act pre-2014 amendments).
l The Nature Conservation Act 2014 contains the categories ‘rare’ and ‘data deficient’. The Scientific Committee’s categories will be revised pursuant to this Act.
m Note that ‘Googong Foreshores’ and ‘Googong Nature Reserve’ are used interchangeably to reflect the difference in naming in source documents that are provided to the Office of the Commissioner for Sustainability and the Environment for this report.
n A ‘protected matter’ (Planning and Development Act 2007, s 111A) means a matter protected by the Commonwealth under the Environment Protection and Biodiversity Conservation Act 1999 or a matter declared to be protected by the Minister. Planning and Development (Protected Matters) Declaration 2015 (no.1), DI2015-62, lists the species currently declared ‘protected’ by the Minister.
o The Minister may declare a matter to be a protected matter under s. 111A(2) of the Planning and Development Act 2007. As at 24 July 2015, there were no matters declared protected under this Act.
t http://www.environment.gov.au/system/files/pages/b42a89fd-8b94-43d0-8721-81b01ff35a57/files/molonglo-approval-instrument.pdf
y The Australian Government approval for the taking of actions in accordance with the Gungahlin Strategic Assessment Biodiversity Plan can be found at http://www.environment.gov.au/system/files/pages/b58dc6ac-a4f2-4a9e-9dad-4f0752e0f050/files/gungahlin-approval-notice_0.pdf. The Gungahlin Strategic Assessment Biodiversity Plan (http://www.environment.gov.au/system/files/pages/b58dc6ac-a4f2-4a9e-9dad-4f0752e0f050/files/gungahlin-biodiversity-plan_0.pdf) refers to ‘indirect offsets’. Note that the Environment Protection and Biodiversity Conservation Act 1999 (Cwlth) Environmental Offsets Policy (October 2012) no longer refers to indirect offsets. The term ‘other compensatory measures’ is used for ‘actions that do not directly offset the impacts on the protected matter’ (see http://www.environment.gov.au/epbc/publications/epbc-act-environmental-offsets-policy).