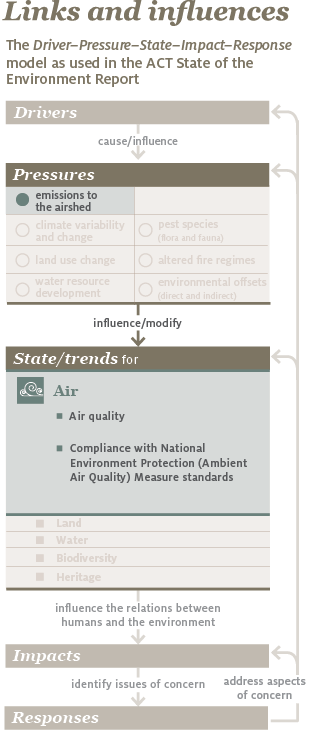
This chapter reports against a number of indicators. These indicators measure the state of ambient air quality, assess trends in the state of air quality throughout the reporting period, and look at what the pressures on air quality are in the Australian Capital Territory (ACT) and how these pressures affect our ambient air quality.
This chapter will:
- define air and air quality
- explain why air quality is important
- explain how air quality is measured
- describe the current state of air quality in the ACT
- assess whether air quality is stable, improving or declining
- describe the pressures on air quality in the ACT and the impacts these pressures are having
- assess whether these impacts are stable, increasing or decreasing
- summarise government response mechanisms.
4.2.1 What is air and air quality?
Air is essential for sustaining life. The composition of air is the result of the co-evolution of the atmosphere, geosphere and biosphere during billions of years. Air comprises mainly nitrogen (78%) and oxygen (21%). Various trace gases make up the rest. Water vapour is also present in variable amounts, depending on atmospheric conditions.
In this report, air quality refers to the quality of the ambient air, as defined by the National Environment Protection Council (NEPC) National Environment Protection (Ambient Air Quality) Measure (Ambient Air Quality NEPM): ‘Ambient air means the external air environment, it does not include the air environment inside buildings or structures’.1
Good air quality means that the air is clean, clear and unpolluted. Clean air is essential for humans, other animals, vegetation, water and soil. Poor air quality is usually due to pollutant emissions into the air, from either human or other sources. If pollutants reach high enough concentrations, they can endanger human health and the environment. Everyday choices, such as driving cars and burning wood for domestic heating, can have a significant impact on air quality.
4.2.2 Why is air quality important?
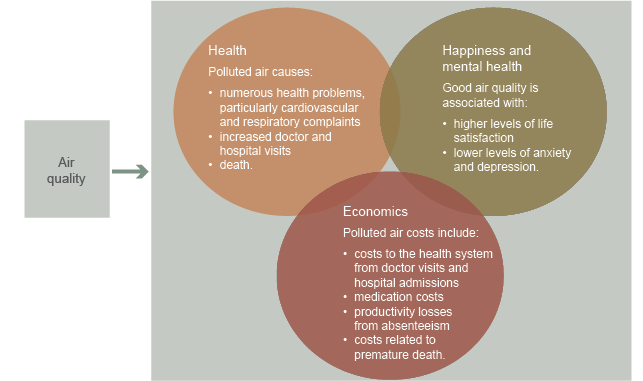
The quality of our air is one of the most tangible indicators of the state of our local environment, and is one that directly affects human health and wellbeing (Figure 4.1). Clean air is associated with better physical and mental health, longer life and significant financial savings from reduced health-care expenses.

Figure 4.1 Links between air quality and human socioeconomic wellbeing
To understand the links between air quality and human wellbeing, it is useful to consider both the benefits of clean air, and the harms and costs associated with polluted air.

Canberra enjoys good air quality Photo: Mark Jekabsons
Health
Polluted air causes a range of short- and long-term negative health outcomes (Table 4.1). Many people, such as those with chronic respiratory conditions, are at greater risk of experiencing adverse health events when exposed to poor-quality air.2 Cardiovascular and respiratory complaints are some of the most common and widespread effects, with acute cases resulting in increased doctor and hospital visits, and even death in extreme cases.3,4 The World Health Organization estimates that 3.7 million people died prematurely as the result of ambient air pollution in 2012 worldwide, representing 6.7% of total deaths in that year. Outdoor air pollution has also recently been classified as carcinogenic to humans.5
Air quality has also been shown to affect people’s levels of happiness and mental wellbeing. Research from around the world has shown higher levels of a range of air pollutants to be associated with lower levels of life satisfaction.14–17 There is evidence that air pollution can lower people’s cognitive function, and contribute to depression and anxiety.18–22 Dust, smog and haze also reduce aesthetic and amenity values of outdoor areas, affecting people’s enjoyment of these spaces.23
Table 4.1 Specific air pollutants, sources, exposure pathways and health effects
| Pollutant | Source | Exposure pathway | Effects on human health |
|---|---|---|---|
|
Carbon monoxide |
Motor vehicles, burning of fossil fuels, bushfires, tobacco smoke |
Blood absorbs carbon monoxide more readily than oxygen, reducing the circulatory system’s ability to transport oxygen |
Can produce tiredness, headaches and visual disturbance; impairs performance on tasks that require vigilance; aggravates cardiovascular disease; associated with low birth weight after maternal exposure during pregnancy |
|
Nitrogen dioxide |
Power stations, motor vehicles, mining and other industries |
Inflames the lining of the lungs |
Decreases lung function, especially for asthmatics; increases susceptibility to respiratory pathogens; exacerbates respiratory disease |
|
Ozone |
Complex reactions in the atmosphere involving nitrogen oxides, hydrocarbons and solar radiation |
Irritates the lining of the nose, airway and lungs |
Reduces lung function and capacity to exercise; induces coughing and chest discomfort; increases asthma attacks; causes eye and throat irritation; may negatively affect cardiovascular system; may increase mortality; long-term exposure may contribute to chronic lung disease and impair lung function development |
|
Particulate matter as PM10 and PM2.5 |
Motor vehicles, power stations, domestic and other fires, sea salt, airborne dust, pollen, mining, urban development |
Particles are deposited throughout the respiratory tract, with a range of effects largely related to inflammation |
May cause breathing difficulties; increases the prevalence of chronic respiratory disease and risk of acute respiratory disease, including lung cancer; contributes to the incidence of heart disease; some particles contain cancer-causing materials; can lead to premature death |
PM10 and PM2.5 = particulate matter smaller than 10 and 2.5 micrometres, respectively
Sources: Asthma Australia,6 Brook et al,7 Dennekamp & Carey,8 Department of the Environment and Heritage,9 House et al,10 Morgan et al,11 National Environment Protection Council,5 Vallero,12, World Health Organization13
Economics
In 2000, the health costs associated with particulate matter (PM) pollution from transport and wood heater emissions in Australia were estimated to be around $5 billion.24 More recent studies suggest that the annual costs of air pollution in Australia may be more than $24 billion.5
The large costs associated with air pollution have led to significant efforts to improve air quality. Various studies have shown that substantial financial savings can be made by investing in measures to improve air quality. Australian studies estimate that the net economic benefit of four proposed new air quality standards would be $6.4–7.0 billion by 2036.5
4.2.3 How do we measure air quality?
In 1998, the NEPC set ambient air quality reporting standards and goals through the Ambient Air Quality NEPM.1 This NEPM prescribes targets for levels of emissions of six pollutants in ambient air, as well as the methods that should be used to monitor the pollutants.
The six pollutants are carbon monoxide (CO), lead, nitrogen dioxide (NO2), ozone, sulfur dioxide and particulate matter less than 10 micrometres in size (PM10).25 The ACT monitors and reports on four of these. Sulfur dioxide is not monitored due to the lack of heavy industry in the ACT, and lead levels have not been monitored since the phase-out of leaded petrol in 2002.26 The NEPM also includes an advisory reporting standard for particulate matter less than 2.5 micrometres in size (PM2.5).
Each jurisdiction in Australia reports annually against the NEPM standards and goals. The goal is to achieve the standards within 10 years of commencement of the measure, with less than the maximum allowable number of exceedances for each pollutant.27
This report uses the following set of indicators to determine the state and trends of air quality and the pressures affecting it:
- state and trend
- local ambient air quality (assesses the state and trends of levels of pollutants monitored under the NEPM)
- compliance with NEPM standards
- pressures
- emissions to the airshed.
Case study 4.1 talks about the Air Quality Index launched in 2014.

Case study 4.1 The ACT Health Air Quality Index
The Air Quality Index, launched by ACT Health in late 2014, provides access to real-time air quality data and allows residents to better understand how air quality may affect them.
What is the Air Quality Index?
The index indicates how clean the air is. It shows the level of monitored pollutants as a percentage of National Environment Protection (Ambient Air Quality) Measure (NEPM) standards. The lower the score, the better the quality of the air. For example, an index score of 50 indicates that levels of that pollutant are 50% of what the NEPM standard allows.
The index shows the levels of pollutants at each monitoring station and includes a colour-coded description of what the levels mean in terms of air quality (Figure 4.2). The Air Quality Index for each site is taken to be the highest Air Quality Index of any individual pollutant.
How can the community use it?
The website describes the potential health risks associated with the index levels and recommends actions that should be taken at the different levels.
As the index score increases, a larger percentage of the population is likely to experience increasingly severe adverse health effects.
The website thus allows residents to have a clearer understanding of the impacts that air quality and levels of different pollutants may have on their wellbeing. This information may be particularly important for sensitive individuals.

Figure 4.2 Pollutant levels and corresponding air quality
Sources:
a http://health.act.gov.au/public-information/public-health/act-air-quality-monitoring/air-quality-index-aqi
b http://health.act.gov.au/health-services/population-health/health-protection-service/act-air-quality-monitoring/air-quality-index-aqi
c http://health.act.gov.au/public-information/public-health/act-air-quality-monitoring/air-quality-index-aqi
d http://health.act.gov.au/public-information/public-health/act-air-quality-monitoring/air-quality-index-aqi