The scale of the ACT’s ecological footprint provides significant evidence of the effect our lifestyle, consumption and ‘needs’ are having on the environment. This is compounded by our increasing population, growth and changes to industry, and the waste generated by individuals, households and industries.
This section assesses the state and trend of the ACT’s population, industry and waste generation, and our ecological footprint.
3.3.1 Population
Current population
The ACT population was 389 747 as at March 2015. It increased by 5.0% from 371 108 at the time of the 2011 State of the Environment Report and is likely to pass 390 000 in 2015. The ACT population is 1.64% of the Australian population.3
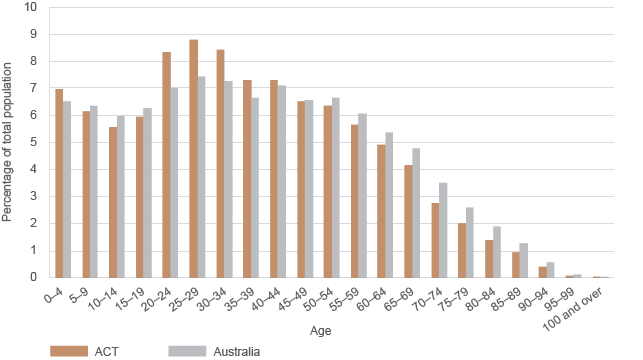
The ACT population is relatively young. Australian Bureau of Statistics (ABS) data show that, in June 2014, the proportion of young adults in the ACT was relatively high compared with Australia as a whole. People aged 20–34 years accounted for 25.6% of the Territory’s population (Figure 3.1), compared with 21.8% of Australia’s population. In contrast, the ACT had a lower proportion (11.8%) of people aged 65 years and over than Australia as a whole (14.7%).4
The sex ratio of the ACT population is close to that for Australia – 49.73% male and 50.3% female in the ACT, compared with 49.8% male and 50.2% female for Australia.5
Source: Based on data from the Australian Bureau of Statistics4
Figure 3.1 Five-year age groups for the ACT and Australian populations, June 2014
Population growth
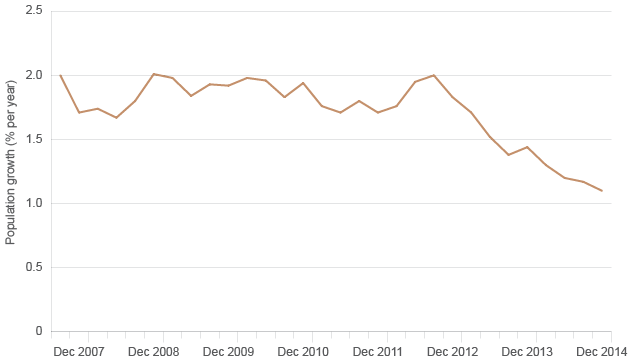
As noted previously, the ACT population grew by 5.0% between December 2011 and March 2015. This is marginally less than the growth rate for the Australian population (5.3%) during the same period.3 The population growth rate of the ACT has declined since 2012 (Figure 3.2).
Dec = December
Source: Based on data from the Australian Bureau of Statistics3
Figure 3.2 ACT population growth, 2007–2014
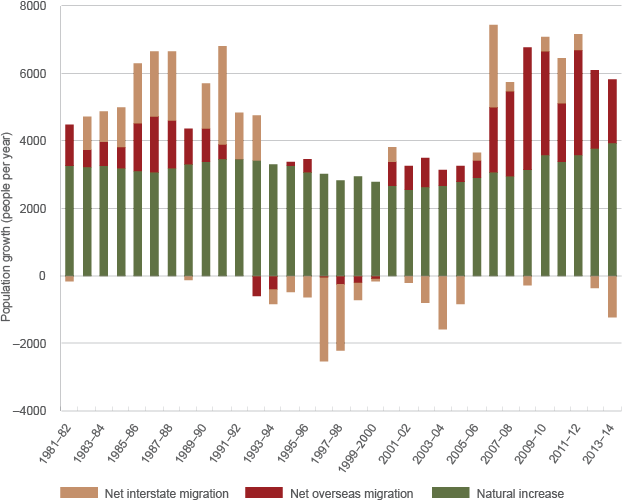
Population growth since the early 1980s has mainly been the result of natural increase – that is, births exceeding deaths – but net overseas migration into the ACT is also a significant contributor to our population growth (Figure 3.3). ABS data show that the ACT population increased by 16 532 between December 2011 and December 2014,6 and the change comprised natural increase (+68.7%), net overseas migration (+42.7%) and net outwards interstate migration (–11.3%).
Source: Based on data from the Australian Bureau of Statistics6
Figure 3.3 Sources of ACT population growth, 1981–2014
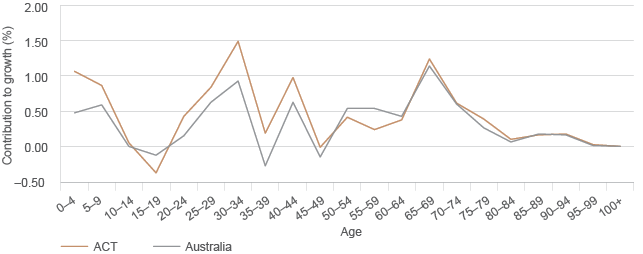
Growth rates for the age cohorts of the ACT population have been similar to those for Australia as a whole in the recent past (Figure 3.4). The ACT differs from other states and territories in that, on average, it has a relatively high contribution to population growth from the younger age groups, most notably the
0–9-year age group and those aged from 20 to 44.4
Population growth in 2011–2015 has been mainly in the north of Canberra (Figure 3.5).
Source: Based on data from the Australian Bureau of Statistics5
Figure 3.4 Contributions to ACT and Australian population growth by age groups, 2010–2014
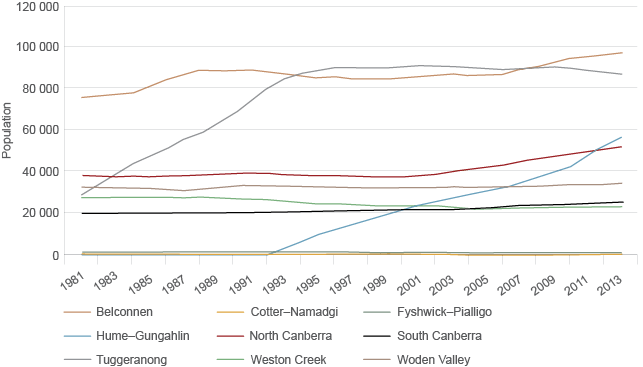
Source: Calculated by the Office of the Commissioner for Sustainability and the Environment from the Australian Bureau of Statistics Regional population growth7
Figure 3.5 Population of Canberra districts, 1981–2013
Future population growth
ACT Government population growth projections imply considerable increases in population over the longer term (Table 3.1) and are based on an annual growth rate of 1.5% from 2015 to 2053, and a 1% growth rate after 2053.8 However, the population growth rate has declined recently, and the current growth rate is already below 1.5% (Figure 3.2). The government projection of annual net interstate migration was 200 people per year, but the most recent data show that interstate migration is negative. Long-term population projections are known to be sensitive to their underlying assumptions regarding rate of migration and natural increase.
Table 3.1 ACT population projections, 2015–2060
| Year | Population |
|---|---|
|
2015 |
394 675 |
|
2020 |
423 950 |
|
2025 |
456 435 |
|
2030 |
487 413 |
|
2035 |
517 384 |
|
2040 |
547 392 |
|
2045 |
578 062 |
|
2050 |
609 093 |
|
2055 |
639 934 |
|
2060 |
669 814 |
Source: Chief Minister and Treasury Directorate8
Population density
For the ACT as a whole, population density increased from 156 people to 164 people per square kilometre from 2011 to 2014. The density has increased greatly since 1981 when it was 96 people per square kilometre.
As noted previously, most growth has been in the northern suburbs (Figure 3.6); population and density began to rise in North Canberra early in the 2000s with the advent of infill policies. Woden Valley, Weston Creek and South Canberra have enjoyed relatively stable populations. Tuggeranong grew rapidly until the mid-1990s, but its population level stabilised and then began to decline in the current reporting period. Gungahlin has expanded rapidly and continuously since the mid-1990s.
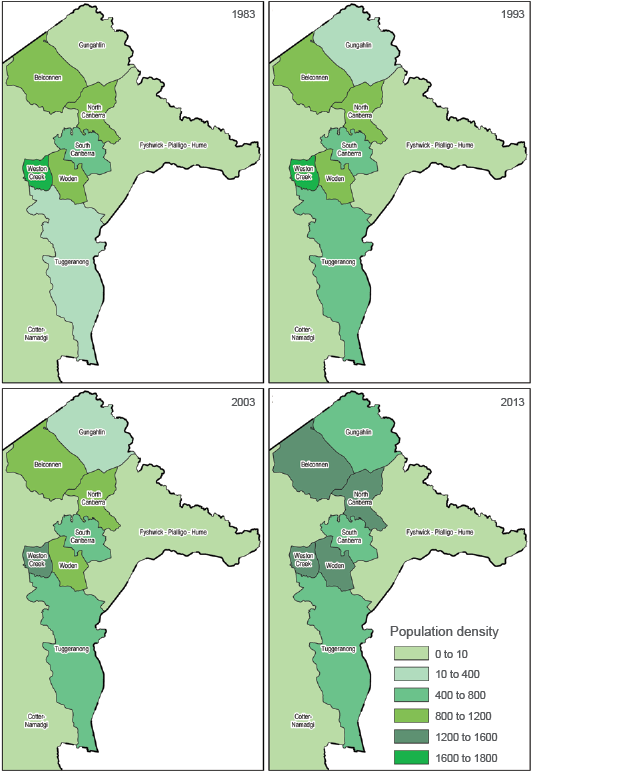
Source: Map provided by the ACT Government Environment and Planning Directorate
Figure 3.6 Population density in ACT districts, 1983–2013
Canberra is populated less densely than some other Australian capital cities – namely Sydney, Melbourne, Perth and Adelaide – but its maximum density is not a great deal less than that of Perth and Adelaide. It is greater than the maximum density of Hobart and Darwin (Table 3.2).
Table 3.2 Australian capital city populations, density in 2014, and maximum density in 2011
| City | Population of greater city area, 2014 | Density, persons per square km, 2014 | Maximum density, persons per square km, 2011a |
|---|---|---|---|
|
Canberra (all ACT) |
386 000 |
164 |
3 212 |
|
Greater Sydney |
4 840 000 |
390 |
14 747 |
|
Greater Melbourne |
4 440 000 |
440 |
10 827 |
|
Greater Brisbane |
2 270 000 |
140 |
6 216 |
|
Greater Perth |
2 920 000 |
315 |
3 662 |
|
Greater Adelaide |
1 300 000 |
400 |
3 552 |
|
Greater Hobart |
221 000 |
130 |
2 963 |
|
Greater Darwin |
140 400 |
44 |
2 620 |
a Based on 1 square kilometre grids
Source: Australian Bureau of Statistics9,10
Employment, income and wealth
The ACT population has a high rate of employment and relatively high level of income per person: approximately 20% above the Australian average. (For 2013–14, the average weekly household disposable income for the ACT was $1206 compared with $998 for Australia.11) The high income per person reflects:
- a high ACT workforce participation rate of 70.8% for people aged 15 years or over (compared with 64.6% for Australia)
- a high ACT rate of employment for labour force participants (94.6% compared with 93.8% for Australia)
- high average weekly earnings in the ACT (14.4% higher than the Australian average based on full-time adult ordinary time earnings, or 17% higher based on all earnings by all employees).
Incomes are distributed more evenly in the ACT than in Australia as a whole (Table 3.3). In the ACT, the lowest quintile receives 8.4% of all income compared with 7.5% for Australia. At the top of the income range, the highest income quintile in the ACT receives 35.5% of all income, lower than the 40.8% of total income received by the highest quintile for Australia.
As well as being a high-income society, the ACT population has higher wealth. Mean household net worth in 2013–14 was $890 100, 10% higher than the Australian average of $809 900.11
Table 3.3 Income shares by income distribution quintile, equivalised household disposable income, ACT and Australia, 2013–14
| Indicator | Percentage of total income, ACT | Percentage of total income, Australia |
|---|---|---|
|
Income share – lowest quintile |
8.4 |
7.5 |
|
Income share – second quintile |
14.0 |
12.3 |
|
Income share – third quintile |
18.4 |
16.9 |
|
Income share – fourth quintile |
23.7 |
22.4 |
|
Income share – highest quintile |
35.5 |
40.8 |
|
All |
100.0 |
100.0 |
Note: Equivalised disposable household income is calculated by adjusting disposable income by the application of an equivalence scale based on the principle that larger households require a higher level of income to achieve the same standard of living as smaller household. However, there are economies of scale, so each additional person does not equally add to the income needed to support household consumption. After household income is adjusted according to an equivalence scale, the equivalised income can be viewed as an indicator of the economic resources available to a standardised household. For a lone person household, it is equal to income received. For a household comprising more than one person, equivalised income is an indicator of the household income that would be required by a lone person household in order to enjoy the same level of economic wellbeing as the household in question (see Australian Bureau of Statistics12).
Source: Australian Bureau of Statistics11
3.3.2 Industry
In general, economic production activities place high pressure on the environment through both the consumption of natural resources and environmental services, and through the production of waste materials (see Section 3.3.3).
However, in the ACT, the main economic production activities are not those that have high environmental impacts.
The main industry in the ACT is public administration and safety, which employs 38% of the workforce (compared with 6.2% for Australia). Professional scientific and technical services are next with 10.3% (compared with 8.1% for Australia), then health care and social assistance at 9.6% (compared with 12.1% for Australia).13
Similarly, the value of gross product is also concentrated in public administration and safety (Figure 3.7). Most industries with large and obvious environmental impacts are small in the ACT compared with Australia (eg manufacturing represents 1.1% of ACT product value compared with 6.8% for Australia, and mining represents 0.1% compared with 8.8%). The one exception to this is construction, which represents 10.4% of ACT product value compared with 8.5% for Australia.
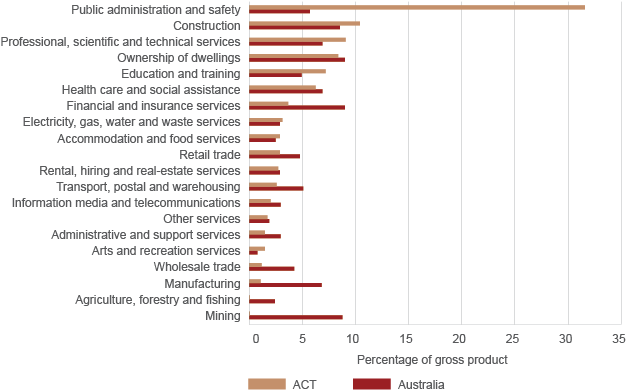
Source: Australian Bureau of Statistics14
Figure 3.7 Percentage of gross product from industry divisions, ACT and Australia, 2014
3.3.3 Waste generation and management
The solid waste generated from urban activities puts pressure on the environment from the use of land at landfill waste disposal sites, and the potential contamination of soils, groundwater and waterways.
Waste that is generated by households in Canberra and Queanbeyan is collected by contractors to the ACT Government or Queanbeyan City Council, and transported to facilities for recycling or burial at ACT landfill sites. Commercial contractors for other waste streams use ACT landfill sites and may also transport materials to New South Wales (NSW) waste facilities, primarily Woodlawn near Lake George. Most recycled waste consists of garden wastes, or demolition and excavation wastes, which are processed in the ACT before reuse or recycling in the ACT or interstate. Other recycled wastes (eg paper, glass, plastics, metal, tyres) are transported outside the ACT for processing into saleable materials and products in Australia or overseas. In addition, a small amount of ‘controlled waste’ (see ‘Movement of controlled waste’) is exported from the ACT to other states.
The ACT Government regulates waste management through the Waste Minimisation Act 2001 and the Environment Protection Act 1997.
Waste generated in Queanbeyan is processed at ACT recycling facilities and deposited in ACT landfills. Therefore, the data in the following sections include Queanbeyan waste.
Waste generated
Total waste generated in the ACT and Queanbeyan has declined during 2011–2015, from 1 069 001 tonnes in 2011–12 to 950 704 tonnes in 2014–15. However, this apparent decline is mainly due to a high level of waste generated in 2011–12 from the clean-up of the site of a failed resource recovery company, and from additional deliveries of contaminated soil from the West Molonglo pond clean-up and elsewhere.15 There was also a 50% increase in recycled garden waste in 2010–11 due to higher rainfall.15 In addition, an unknown quantity of waste is transported to NSW disposal facilities and not included in the data available to the Office of the Commissioner for Sustainability and the Environment (OCSE).
Given the variation that may occur over the short term due to particular events, longer-term trends are a better guide to the increasing pressure of waste. The amount of waste being generated in the ACT has increased almost continuously since 1993–94 (Figure 3.8). In state of the environment reporting periods, total waste generated per year increased by 16% between 2007 and 2011, and by a further 10% between 2011 and 2015. However, the increase could be even greater given that some waste is transported out of the ACT for landfill, and therefore not measured at ACT facilities.
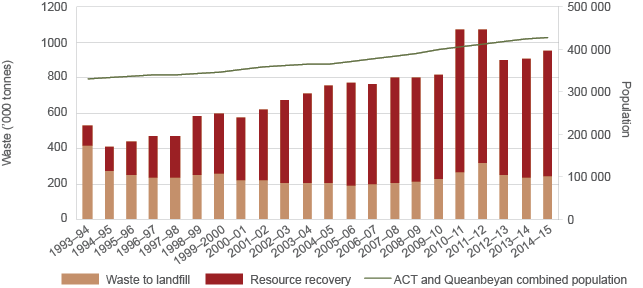
Source: Data provided by the Territory and Municipal Services Directorate, July 2015
Figure 3.8 ACT population, waste generated and resource recovery, 1993–2015
Waste generated per person
The total amount of waste generated is closely related to the size of the human population generating the waste and, in general terms, a growing population generates more waste. However, better packaging practices and consumer awareness can reduce waste; thus, the waste generated per person is an important measure of environmental pressure.
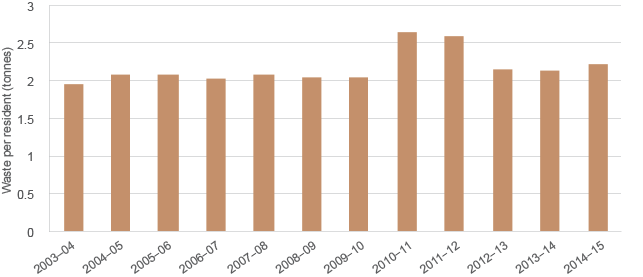
In 2014–15, each resident in Canberra and Queanbeyan combined generated an average of 2.22 tonnes of solid waste, based on waste recovered and waste committed to landfills in the ACT. This is similar to the level for Australia as a whole.16
The amount of waste generated per resident in 2014–15 was significantly lower than for 2011–12 and 2010–11. However, as noted previously, particular events boosted waste generation in these years, and the long-term trend is for increasing generation of waste (Figure 3.9).
Source: Data provided by the Territory and Municipal Services Directorate, July 2015
Figure 3.9 Waste generated per resident, 2003–2015
Waste sent to landfill
The vast majority of waste generated in the ACT and Queanbeyan – 70% to 75% – is recycled rather than being committed to landfill. This is thanks to extensive waste recovery and recycling operations in the ACT at Mugga Lane, Mitchell and elsewhere. Some waste is also transported outside the ACT for disposal in landfills. Reliable comparisons with other Australian capital cities are not available, but Canberra’s recycling rate appears to be high compared with Perth, Brisbane, Melbourne and Sydney, where the recycling rate ranges between 35% and 67%.17
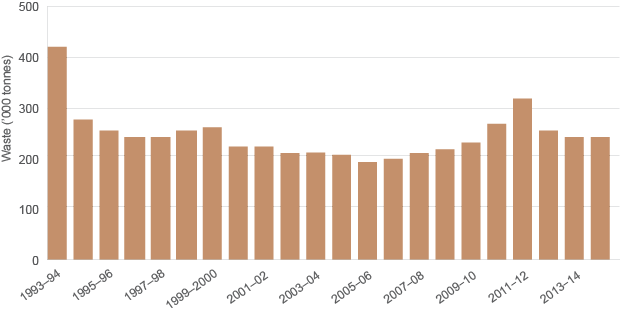
In 2014–15, 243 793 tonnes of waste were sent to landfill (Figure 3.10).
Source: Data provided by the Territory and Municipal Services Directorate, July 2015
Figure 3.10 Total waste to ACT landfill, 1993–2015
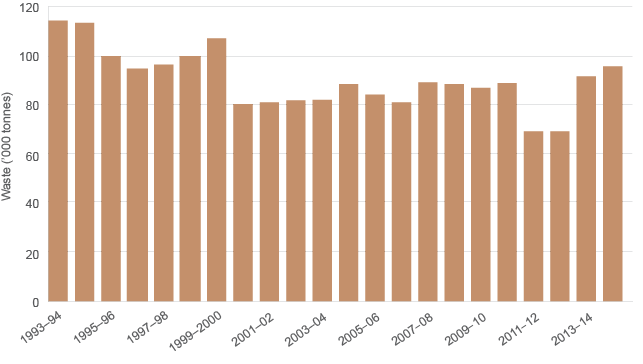
Recycling practices are having a clear effect. For the household sector, the amount of domestic waste collected has steadily increased during the past two decades, yet the total weight of household waste sent to landfill is less than it was in the 1990s (Figure 3.11). Some figures for years during 2011–2015 are uncertain, but the 2014–15 data are understood to be more reliable and indicate that total household waste sent to landfill is not decreasing.
Source: Data provided by the Territory and Municipal Services Directorate, July 2015
Figure 3.11 Household waste to landfill, 1993–2015
Waste sent to landfill per person
Waste committed to landfill per person indicates the environmental pressure generated by landfill after making allowance for the tendency of a rising human population to generate increasing amounts of waste.
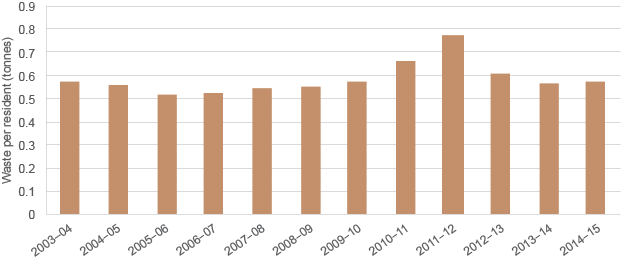
Waste sent to landfill per person is lower than waste generated per person. For example, in 2014–15, 2.22 tonnes of waste per person were generated across all sectors of the ACT, but only 569 kg were committed to landfill. This is similar to the result in 2013–14 and less than in each of the two previous years, but more than in any year from 2005–06 to 2008–09 and about equal to the result for 2003–04 (Figure 3.12). This indicates that, although the tonnage of resource recovery and recycling has increased in each successive state of the environment reporting period (Figure 3.12), it has barely kept pace with the tendency of growing Canberra and Queanbeyan populations to generate waste through increasing consumption. This in turn places increasing pressure on waste management systems and on our environment.
Source: Data provided by the Territory and Municipal Services Directorate, July 2015
Figure 3.12 Waste to landfill per resident, 2003–2015
Although the ACT Government’s adoption of the No Waste by 2010 strategy in 1996 led to very strong increases in the recycling rate up to 2005–06, when it reached 75.1%, no further lasting improvements have been achieved (refer to ‘Resource recovery’). Given that some commercial waste is now transported across the ACT border for landfill disposal, it is likely that the most recent figures understate actual long-term growth in waste to landfill per person.
Sectoral waste generation
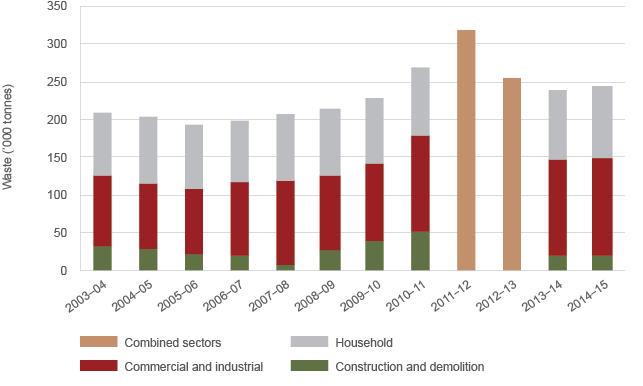
Territory and Municipal Services (TAMS) is not yet able to separately quantify the waste to landfill generated by different sectors. However, contracted waste collection and recycling services monitor the quantities of waste dealt with in their operations and report this to TAMS. Analysis of those data enables estimates to be made of three major sources of waste to landfill: households, commercial and industrial entities, and construction and demolition. The estimates, based on data for 2013–14 and 2014–15, are that:
- households contribute 38.8% of the waste
- commercial and industrial entities contribute 52.5% of the waste
- construction and demolition contribute 8.7% of the waste.
It should be noted that, in the data provided, the total waste to landfill from the three sources equates to only 75% of total waste to landfill as published in TAMS annual reports for 2011–12 and 2012–13. Consequently, figures for those years are not reliable and this means that there is a low confidence in apparent trends in the sectoral composition of waste to landfill in the 2011–2015 state of the environment reporting period.
Much of the increase in domestic waste collection in 2011–2015 is a result of the population of the ACT and Queanbeyan having grown by an estimated 5.7%. In addition, the amount of household waste collected and committed to landfill per person has increased by approximately 4 kg, or approximately 1.8%, per person. This suggests increased rates of consumption of goods – a factor closely linked with affluence and, in turn, waste generation.18
The available data for waste to landfill generated per sector again show that aggregate waste to landfill has declined during 2011–2015, but is higher than in the two previous periods (Figure 3.13). It is not possible to identify trends for any of the sectors. However, TAMS data suggest that construction and demolition waste to landfill in the ACT has declined in 2011–2015. The decline is likely to be due at least in part to the transport of construction waste to the Woodlawn landfill in NSW.
Source: Data provided by the Territory and Municipal Services Directorate, July 2015
Figure 3.13 Sectoral composition of waste to landfill in the ACT, 2003–2015
It is clear that there are some difficulties in sourcing accurate data on sectoral waste generation, disposal and recycling, particularly due to the movement across the border of waste that is likely to be generated by construction and demolition. There is also incomplete reporting of waste collected and disposed of, or recycled by waste industry participants operating wholly within the ACT. This is because current regulatory arrangements do not require complete reporting to TAMS – there are only voluntary reporting arrangements in place. The OCSE considers that complete and consistent data are an important prerequisite for the effective design of future policies, programs and infrastructure. Changes to regulatory arrangements to ensure tracking of waste through to its final destination and mandatory reporting need to be developed to achieve the required quality of data.
Greenhouse gas emissions from landfills
Organic waste in landfill decomposes under anaerobic conditions to produce a mixture of carbon dioxide and methane, with trace amounts of volatile organic compounds, carbon monoxide, hydrogen and hydrogen sulfide. At the ACT’s two landfills at West Belconnen and Mugga Lane, this gas is collected and used to produce electricity. These facilities now produce up to 29 000 megawatt hours of electricity each year.19–21
The ACT greenhouse gas inventory estimates that there is a residual amount of greenhouse gases emitted after these processes (Table 3.4). This is around 2% of the ACT’s total greenhouse gas emissions and has declined substantially since 1989–90 when waste sector emissions were more than 5% of total ACT greenhouse gas emissions.
Table 3.4 Waste sector greenhouse gas emissions, 1989–2014
| 1989–90 | 2010–11 | 2011–12 | 2012–13 | 2013–14 | |
|---|---|---|---|---|---|
|
Waste sector emissions (ktCO2-e) |
162 |
115 |
90 |
92 |
92 |
|
Total ACT emissions, excluding LULUCF (ktCO2-e) |
3186 |
4472 |
4365 |
4108 |
4007 |
|
Waste sector emissions as percentage of total ACT emissions, excluding LULUCF |
5.1% |
2.6% |
2.1% |
2.2% |
2.3% |
ktCO2-e = kilotonnes of carbon dioxide equivalent; LULUCF = land use, land-use change and forestry
Source: Pitt&Sherry22
Resource recovery
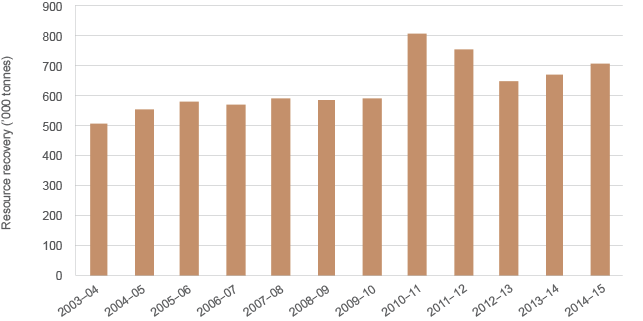
As noted earlier, the combined efforts of the ACT and Queanbeyan waste management and recycling services recover large amounts of resources each year – an average of 694 000 tonnes per year in 2011–2015 (Figure 3.14).
Source: Data provided by the Territory and Municipal Services Directorate, July 2015
Figure 3.14 Total resource recovery, 2003–2015
Resource recovery rate
The resource recovery rate is defined as the total amount of resource recovery (or recycling) as a percentage of total waste generated. It indicates the net success of the community’s efforts towards recycling relative to its waste production.
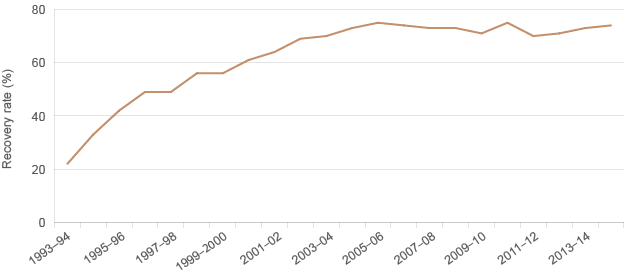
The long-term trends show large and continuous improvements during the 1990s and 2000s through to 2005–06 (Figure 3.15). This is attributable to measures introduced by the No Waste by 2010 strategy. Since 2005–06, the resource recovery rate has plateaued at 70–75%. From 2011 to 2014–15, the resource recovery rate has improved slightly. However, at 72.5% for the whole of the reporting period, it is not an improvement compared with the resource recovery rates of 73.7% and 73.2% achieved in the two previous reporting periods, respectively.
Source: Data provided by the Territory and Municipal Services Directorate, July 2015
Figure 3.15 Resource recovery rate, 1993–2015
Material composition of waste recycling and resource recovery
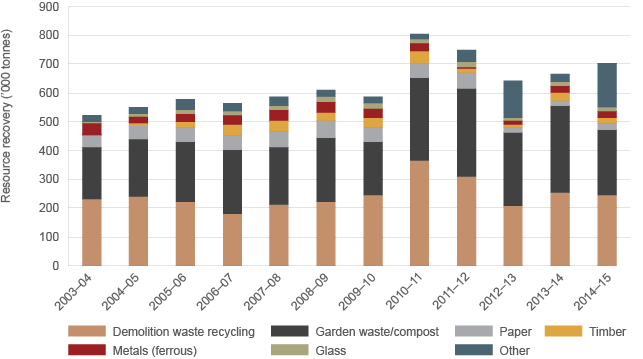
Data on the types of waste recovered are provided to ACT NOWaste by waste industry operators. These data are indicative rather than exact, and the cause of year-to-year fluctuations is often unknown. However, results from 2003 to 2015 (Figure 3.16) suggest that:
- demolition resource recovery has fluctuated during the years according to variations in the level of building activity
- garden waste recycling has been high since 2011, because increased plant growth after the end of the drought in 2011 increased the supply of green waste material
- there was a high level of ‘other’ waste recovery in 2012–13, in part because of the large number of televisions that were recycled after the phase-out of analogue television services in 2012 and the start of the National Television and Computer Recycling Scheme in mid-2012
- paper recycling declined from 2012–13 onwards, which can be explained partly by falling newspaper circulation in the ACT.
Source: Data provided by the Territory and Municipal Services Directorate, July 2015
Figure 3.16 Resource recovery from waste by material category, 2003–2015
Movement of controlled waste
Controlled wastes are those that are considered to be a danger to humans because they are explosive, flammable, infectious, corrosive or exotoxic (toxic substances produced by microorganisms such as bacteria or fungi), or have the potential to cause significant harm in some other way.23
Compliance with National Environment Protection (Movement of Controlled Waste) Measure
The movement of controlled waste between states and territories is regulated by the National Environment Protection (Movement of Controlled Waste between States and Territories) Measure.24 The National Environment Protection Measures (NEPMs) and the National Environment Protection Council (NEPC) provide a management framework that enables the licensing and regulation of waste movements. The purpose of this regulation is to minimise the potential for adverse impacts on the environment and human health associated with the movement of controlled waste.
The NEPM has been fully implemented and operational in the ACT since March 2000, with no major issues having been identified with its operation.25–27 All parties bound by the NEPM have complied with the NEPM’s protocols and information reporting requirements. The ACT Government’s Environment and Planning Directorate continued to work with industry during 2013–14 to ensure efficient implementation of the NEPM. The key legislative instruments used are the Environment Protection Act 1997 (ACT) and the Environment Protection Regulation 2005 (ACT). Information sheets (which include an explanation of producer, transporter and waste facility responsibilities, and instructions on how to complete a waste transport certificate) produced by the ACT Government helped stakeholders to comply with their statutory requirements. Regular contact has been maintained with other jurisdictions to ensure cooperative administration of the NEPM.
Compliance with the Movement of Controlled Waste NEPM ensures that the ACT is achieving the national environment protection standards for ensuring that controlled wastes that are to be moved between states and territories are properly identified, transported and otherwise handled in ways that are consistent with environmentally sound practices for the management of these wastes.
The ACT Government demonstrates compliance with the NEPM by reporting annually on the implementation and effectiveness of this measure in the ACT. The ACT’s report is published in the NEPC’s annual reports.
An analysis of NEPC annual reports25–27 reveals that both imports and exports of controlled waste involving the ACT have declined compared with the peaks reached in 2009–10 (Figure 3.17). Exports rose slightly during 2011–2015 following the steep decline from the 2009–10 peak. Imports have remained at a low level from 2011–12 to 2013–14.
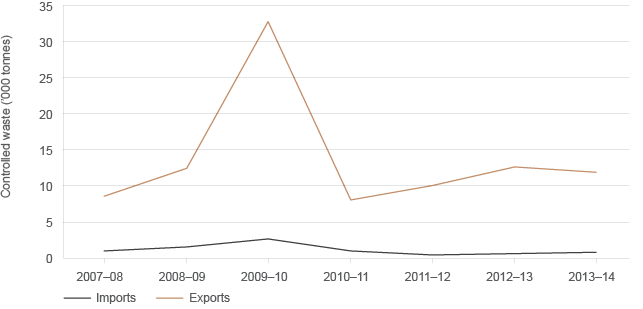
Source: Commissioner for Sustainability and the Environment,28 National Environment Protection Council25–27
Figure 3.17 Movement of controlled waste into and out of the ACT, 2007–2014
In the 2009–10 total for imports, 1675.5 tonnes or 63.6% comprised soil and sludge brought into the ACT, mainly as asbestos-contaminated soil from roadworks on the Kings Highway, now completed. Since 2010–11, the four types of controlled waste (oils, organic chemicals, and clinical and pharmaceutical waste) imported into the ACT from NSW, Victoria and Queensland have fallen to much lower levels. A modest increase between 2012–13 and 2013–14 is due to campaigns undertaken by the ACT Government to ensure that industry participants comply with their obligations to report movements of controlled waste.
Between 2009–10 and 2010–11, exports of controlled waste fell by 59.5%. This was due to the reduction in the amount of soils and sludge being exported to NSW from Australian Government redevelopment projects within the ACT. In the current state of the environment reporting period, however, exports of controlled waste, which comprise mainly putrescible and organic waste and oils, have totalled around 10 000–12 000 tonnes per year.
Disposal of used packaging
The Used Packaging Materials NEPM is designed to:
- reduce environmental degradation that arises from disposing of used packaging
- conserve virgin materials (manufactured materials that are not made from recycled materials) through the encouragement of reuse and recycling.
The Australian Packaging Covenant supports and complements the Used Packaging Materials NEPM through voluntary strategies designed to achieve the following specific performance goals:29
- Design: optimise packaging to use resources efficiently and reduce environmental impact without compromising product quality and safety.
- Recycling: efficiently collect and recycle packaging.
- Product stewardship: demonstrate commitment by all signatories to the Used Packaging Materials NEPM.
Compliance with National Environment Protection (Used Packaging Materials) Measure
In the ACT, the Used Packaging Materials NEPM is implemented by the Used Packaging Materials Industry Waste Reduction Plan (IWRP) under the Waste Minimisation Act 2001 (ACT). The Environment and Planning Directorate is responsible for implementing and administering the NEPM, and TAMS is responsible for the operational aspects of the NEPM. The Used Packaging Materials IWRP was approved in November 2006, and it was updated in 2013 to ensure consistency with the Australian Packaging Covenant and the NEPM. The ACT Government is working constructively within the Council of Australian Governments to develop more effective mechanisms to regulate packaging waste.
The ACT Government complies with the NEPM by reporting annually on the implementation and effectiveness of this measure in the ACT. This information is published in the NEPC’s annual report.
The ACT is a signatory to the Australian Packaging Covenant and is implementing a range of measures as part of its five-year action plan, which has the goal of achieving full resource recovery and a carbon-neutral waste sector with more than 90% of resources recovered by 2025. The action plan includes a number of measures to increase recycling of packaging waste (see Section 3.4 and Case study 3.1).30,31
Case study 3.1 Actsmart waste programs
What is it?
Since 2009, the Australian Capital Territory (ACT) Government has provided support and training to various sectors through the Actsmart Business Recycling, Actsmart Public Event and Actsmart Schools programs. The programs encourage participants to direct waste away from landfill, improve sustainability and reduce the Territory’s carbon footprint.
These free programs provide resources to improve waste management and provide an opportunity to save money by reducing waste-related costs. Organisations can register on the website (http://www.actsmart.act.gov.au) to receive resources and advice from Actsmart staff. Those that successfully implement the programs gain accreditation and access to the promotional materials associated with this.
Businesses
Actsmart Business Recycling is a program that assists businesses to implement efficient recycling. The program has been popular, with 686 sites participating in the program including Canberra Stadium, Manuka Oval and Calvary Health Care. In 2013–14, the program led to 21 197 cubic metres (m3) of waste being diverted from landfill. The recycling of 16 089 m3 of mixed recyclables saved 1298 tonnes of carbon dioxide equivalent (tCO2-e), and the diversion of 1746 m3 of organic material saved 956 tCO2-e.
Public events
The Actsmart Public Event program provides assistance to implement recycling facilities at public events. It has covered 51 events (as of June 2014) including all ACT Centenary of Canberra Events, Floriade, the National Multicultural Festival and smaller events. This has diverted 72 617 kg of mixed recycling and 4675 kg of organic waste from landfill, leading to a reduction of 92.95 tCO2-e and 7.48 tCO2-e, respectively.
Schools
The Actsmart Schools program targets five aspects of sustainability: waste, energy, water, biodiversity and curriculum. Schools can receive resources to help reduce waste as well as related curriculum materials. Waste and recycling systems have been established in a total of 86 schools. In 2013–14, accredited schools produced 0.43 m3 of waste per student per year, whereas nonaccredited schools produced 0.60 m2.
Sources: Environment and Planning Directorate, ACTSmart32,33
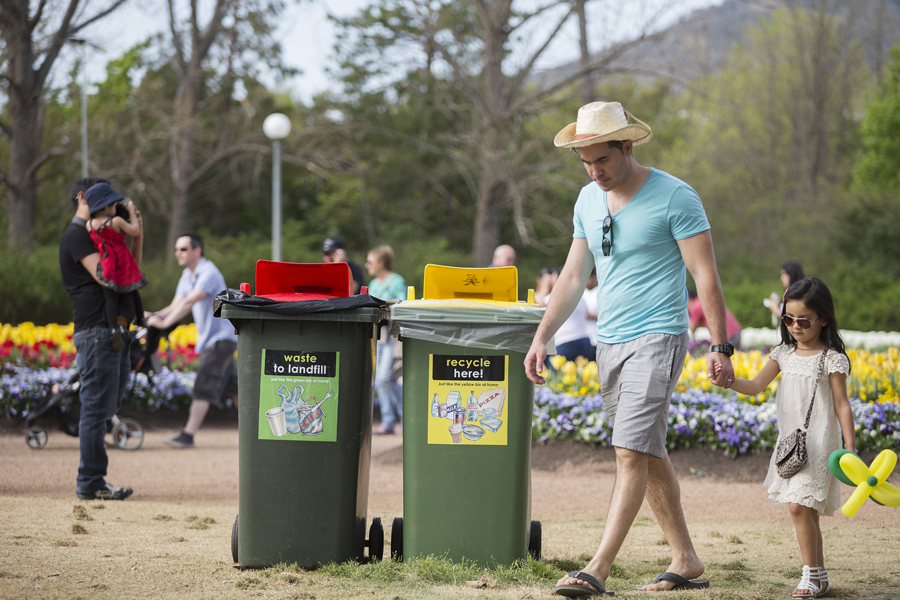
Visitors attend Floriade, where the Actsmart Public Event Recycling program is operating. Photo: Actsmart, ACT Government
Waste impacts
Impacts of human waste generation arise from both the failure of our efforts to reduce consumption and manage the waste generated, and the operation of waste management systems that use energy, land and water. Potential impacts may include polluted land or water, and adverse impacts on human health and the livability of our environment.
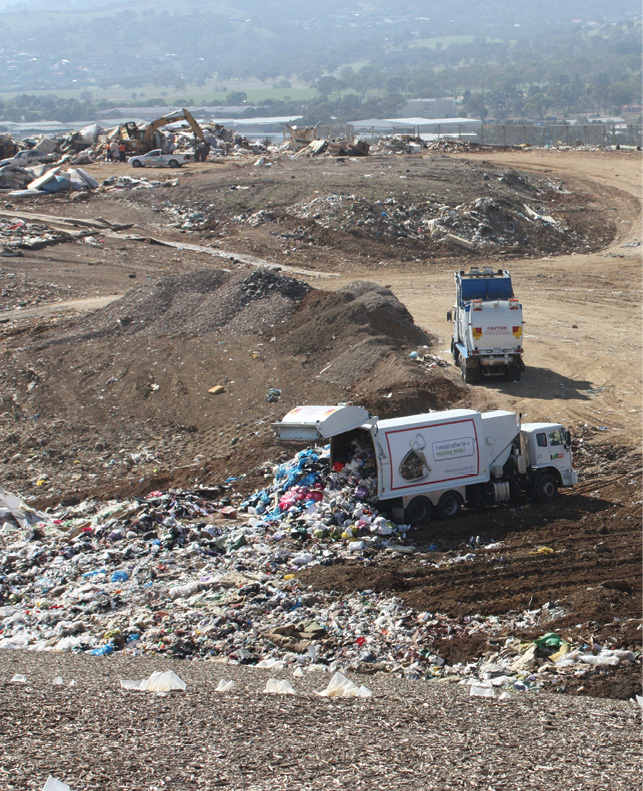
Mugga Lane tipPhoto: ACT Government
Damage to land, air or water
Incidents of air, land and water pollution from waste and waste management activities that may damage the environment are required to be reported to the ACT Environment Protection Authority (EPA) when they occur in operations that are subject to environmental authorisations. For example, the EPA has provided environmental authorisations to TAMS (ACT NOWaste) on behalf of the ACT Government for management of a commercial operator of the waste landfill at Belconnen, and to Remondis Australia Pty Ltd for operation of the landfill at Mugga Lane. The environmental authorisations require monitoring of soils, groundwater and retention dams, among a number of conditions designed to ensure that all activities are carried out so that adverse impacts on the environment are minimised. Incidents of pollution are required to be reported to the EPA. During the reporting period, fires were reported as follows at the Mugga Lane landfill:
- 2011 – 25 November
- 2012 – 23 May, 4 September, 19 October and 19 November
- 2014 – 12 November and 18 November.
All fires reported were within the active landfill cell at the site, and damage was reported to be minimal in all cases. From December 2014 to January 2015, the EPA received complaints about odours from the Mugga Lane landfill during works to increase available air space capacity.
Other environmental authorisations are provided to commercial entities for activities such as:
- crushing, grinding or separating materials
- cutting, storing or seasoning of wood in preparation for sale or supply
- composting activities
- treatment, storage or handling of contaminated soil offsite
- acceptance of soil on land
- transport within the ACT of regulated waste.
These environmental authorisations are available on the EPA Public Register.
EPA reporting within the annual reports of the Environment and Planning Directorate (2012–13) and Environment and Sustainable Development Directorate (2011–12) do not note any significant pollution incidents or damage arising from the failure, or inappropriate operation of, waste management activities. In 2011–12, the EPA recorded no public complaints in relation to waste collection. In 2012–13, it received 19 and in 2013–14 it received 9 complaints in relations to ‘waste collection or noise’.
One significant pollution incident that occurred in a waste management facility in the reporting period was a fire that destroyed the Energy Services Invironmental premises, a facility used to store, recycle and destroy polychlorinated biphenyls in Mitchell. This is reported in Chapter 4: Air.
Contaminated sites are also an indicator of damage to land, air or water from pollution incidents.
Contaminated sites and their management are discussed in Chapter 5: Land. The OCSE concludes that incidents of land, air or water pollution have not had a major lasting negative impact on the environment in the reporting period.
Litter
Litter in public places may directly injure wildlife by ingestion, entanglement or smothering, and may also injure people (eg broken glass, needles and other sharp metal objects). It also has indirect impacts, because visual pollution degrades civic places and undermines community pride and wellbeing.
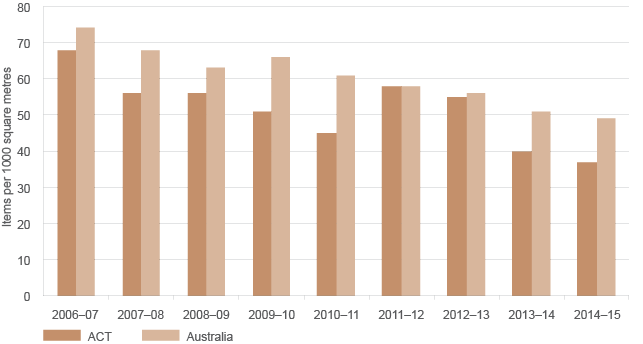
The National Litter Index is a project managed by the Keep Australia Beautiful group, which conducts a yearly survey to estimate litter trends throughout Australia. The survey has found that the ACT has lower litter rates than Australia as a whole. Both the number of items and the volume of litter in the ACT decreased steadily during 2011–2015, but – given the significant increase in both of these that occurred in 2011–12 – the average litter rate has not been significantly reduced during the reporting period compared with 2007–2011 (Figure 3.18). Cigarette butts remain the most common litter item within the ACT, but their frequency decreased in 2011–2015.
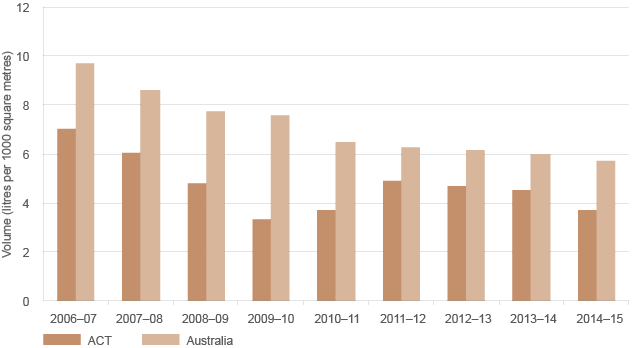
Source: Keep Australia Beautiful34
Figure 3.18 Keep Australia Beautiful National Litter Index, 2006–2015
Human health
Very limited data are available on connections between solid waste and human health in the ACT. The following types of waste can potentially affect human health:35
- Waste consisting of, or contaminated with, toxic chemicals or heavy metals could cause illness, injury or death if these substances came into contact with people, either directly or indirectly, through the environment.
- Residential and business waste of biological origin – for example, food scraps and excess food – could lead to human illness and disease if not collected promptly and processed through composting or buried in appropriately managed landfill.
- Waste items discarded in the public domain can have direct and indirect impacts on community health. For example, broken glass can have a direct impact by causing injury; discarded cigarette butts can be a direct threat to human health if they start a bushfire; cigarette filters contain toxic chemicals and heavy metals, including arsenic, cadmium, lead and zinc, which can enter the food chain by leaching into waters or the soil, or by being eaten by animals.36
- Organic waste materials, such as food and animal faeces, can be washed into streams and lakes, and contribute to algal blooms by adding nutrients to the water. (See Chapter 6: Water for information about the potential threats to human health posed by blue–green algal blooms and faecal bacteria in recreational waters.)
- Clinical waste items used outside the formal health system – for example, used needles, syringes and other injecting equipment discarded in parks, playgrounds, toilets and other public places are hazardous; people receiving a needlestick injury risk contracting bloodborne infections such as hepatitis B or C, or HIV.
The Australian Capital Territory Chief Health Officer’s Report 2014, which reports on the health and wellbeing of the ACT population from 1 July 2010 to 30 June 2012, does not identify any health issues arising from waste or waste management. Given this, the OCSE anticipates that there will be no major health issues identified for the remainder of the state of the environment reporting period, but this expected status will need to be confirmed once the next Chief Health Officer’s Report is released.
Information on water pollution–related health problems, which may result from solid waste management failures, are reported in Chapter 6: Water.
3.3.4 Ecological footprint
An ecological footprint is a concept for assessing the sustainability of resource use and pollution of households, cities or nations. It consists of both ‘real land’ (the cropland, pasture, forests, built land and water required to provide the ecosystem services needed for humans) and ‘energy land’ (the land required to absorb the carbon dioxide emitted through the consumption patterns of a given population).
Estimates of the ecological footprint of the ACT have been provided with each of the three previous State of the Environment Reports, as well as the present report, by the Integrated Sustainability Analysis Research Group (University of Sydney). The most recent analysis, based on data for 2011–12, has been published concurrently with the present State of the Environment Report.,37
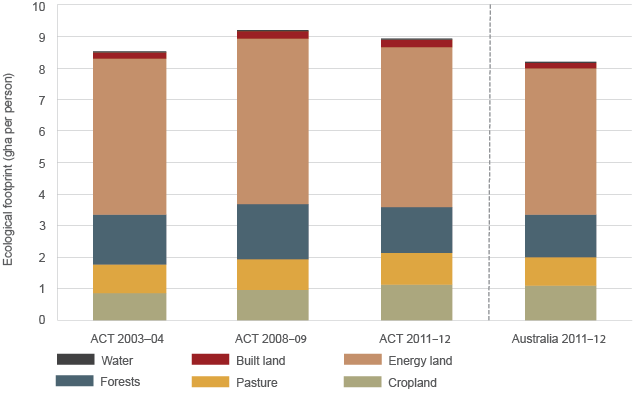
For 2011–12, it is estimated that the average ACT resident had an ecological footprint of 8.9 global hectares (Table 3.5), which is three and a half times higher than the world average and five times higher than the average available biocapacity. Most of the ACT’s ecological footprint is located in other parts of the world that provide the wide range of goods and services consumed by ACT residents.
Table 3.5 Ecological footprint of the ACT and the whole of Australia by land type, 2011–12
| Land type | ACT ecological footprint (’000 gha) |
Australian ecological footprint (’000 gha) |
ACT ecological footprint per person (gha) |
Australian ecological footprint per person (gha) |
|---|---|---|---|---|
|
Cropland |
427 |
24 970 |
1.14 |
1.09 |
|
Pasture |
374 |
21 277 |
1.00 |
0.93 |
|
Forests |
542 |
30 437 |
1.45 |
1.33 |
|
Energy land |
1 902 |
106 259 |
5.08 |
4.63 |
|
Built land |
85 |
4 374 |
0.02 |
0.19 |
|
Water |
1 |
42 |
0.00 |
0.00 |
|
Total |
3 330 |
187 359 |
8.90 |
8.20 |
gha = global hectares
Note: Results are shown in the first two data columns in absolute terms and in the third and fourth data columns as per-capita figures.
Ecological footprint by land type
For the ACT, the majority of the ecological footprint is energy land (57%). This is due to the heavy reliance on fossil fuels, where the major impacts are from using electricity in households (12% of total), flights (5%) and petrol in cars (4%).
In terms of real land:
- the forest footprint has the largest contribution at about 16% of the total ecological footprint (down a few per cent from the 2008–09 footprint), largely reflecting the use of wood for construction and for heating
- the farming lands footprint (cropland and pasture) in the ACT (1.14 and 1.0 global hectares [gha], respectively) is slightly higher than for the average Australian (1.09 and 0.93 gha, respectively), reflecting a higher-than-average consumption of foodstuffs and the fibres embodied in clothing and housing within the ACT
- built land contributes only 2.5% to the ecological footprint of the average ACT resident, again reflecting just how little of a person’s ecological footprint is contained within the urban environment in the ACT.
The average ACT resident had a per-capita ecological footprint of 8.5 gha in 2003–04, rising to 9.2 gha in 2008–09, before falling slightly to 8.9 gha in 2011–12 (Figure 3.19). The average Australian had a per-capita ecological footprint of 7.3 gha in 2003–04, rising to 8.2 gha in 2011–12.
gha = global hectares
Figure 3.19 ACT ecological footprint per capita (2003–04, 2008–09 and 2011–12) and average Australian ecological footprint, 2011–12
Ecological footprint by consumption category
Ecological footprint calculations can also be considered by consumption category. This can help guide community action and government policy aimed at reducing the ACT’s footprint. The consumption categories are food, shelter, energy use, mobility, goods, services and other (Figures 3.20 and 3.21). All upstream impacts are included within each category. For example, the land required to grow wheat and the energy used to harvest the wheat is all included within the food category. The services category covers a large number of services, including telecommunication, financial, medical, entertainment and government.
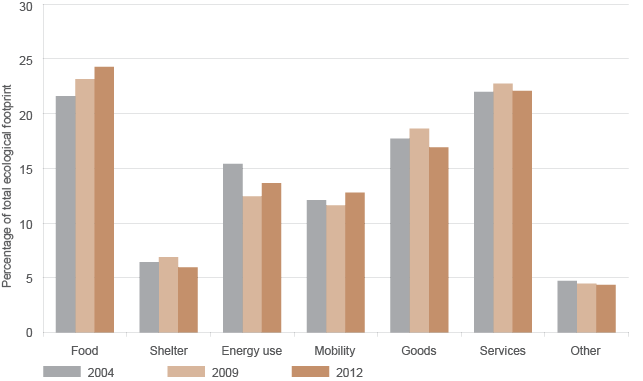
Figure 3.20 ACT ecological footprint by consumption category, 2004, 2009 and 2012
In the ACT, the breakdown by consumption category shows that:
- food and services have the two highest footprints, and together make up around half of the footprint, followed by goods, energy use, mobility and shelter
- energy use impacts have moderated relative to the 2004 footprint, even as per-capita incomes continue to rise.
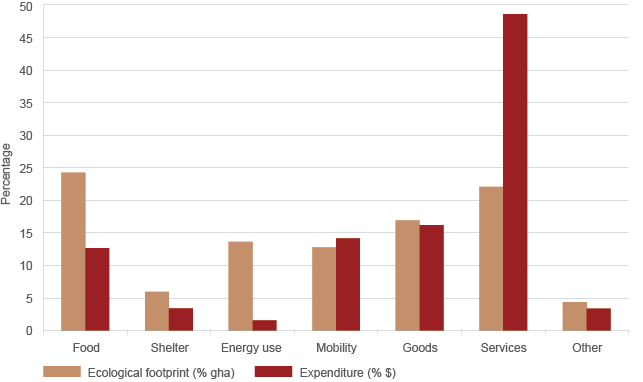
To give an idea of the difference in impacts embodied within the production practices of each category, Figure 3.21 compares the ecological footprint of each consumption category (in brown) to the expenditure in each consumption category of ACT residents (in red).
gha = global hectare
Figure 3.21 Comparison of consumption categories by ecological footprint and expenditure for the ACT, 2011–12
Hence, although food accounts for about 24% of the ACT ecological footprint, it is due to only roughly 13% of an ACT resident’s expenditure (including meals out). In significant contrast, the expenditure on services makes up almost 50% of total expenditure, but has an ecological footprint of 22%.
The Community case study 3.2 shows how communities are working to reduce their ecological footprint.
Community case study 3.2
Communities creating a sustainable Canberra

Sustainable house tour in O’Connor. Photo: Jessica Miller, SEE-Change Canberra
SEE-Change Inc (Society, Environment and Economy) is an Australian Capital Territory (ACT) not-for-profit organisation supporting local community groups to create a more sustainable Canberra. Each SEE-Change activity aims to inspire, inform and support the community to take actions to reduce their ecological footprint, improve the resilience of the ACT’s ecosystems and improve the wellbeing of all Canberrans now and into the future.
The SEE-Change Inc office is located in Downer, and the elected committee and office staff provide support and coordination functions for local groups. Currently, SEE-Change groups of volunteers meet in Belconnen, Inner North, Inner South, Woden and Gungahlin. Each group is different, with members undertaking activities of interest and importance to their local areas.
SEE-Change Inc and member groups are involved in many different activities, including solar panel and electric bike bulk buys, a bike trailer hire service, film nights, seminars, talks, progressive dinners, community festivals, kitchen table conversation events and house blitz – draught-proofing events.

Volunteers making curtains at a SEE-Change workshop. Photo: SEE-Change Canberra
One of the main projects is the Canberra Curtain Retrofit Project, which uses a community-based delivery model to improve the energy performance and living conditions of vulnerable people’s houses. The project brings people together in sewing workshops, and increases home energy efficiency using available materials and volunteer support.
The SEE-Change program of monthly Sustainable House Tours is designed to inform and inspire renovators, home owners and renters by showing them everyday homes built and created around the idea of reducing their ecological footprint. On these tours, visitors can tap into local knowledge to learn how to successfully integrate renewable energy, recycling, food growing and other sustainable practices into their own home and lifestyle.
SEE-Change will soon launch a Transition Streets Canberra Project to encourage and support neighbours to connect, share ideas and enthuse one another to become more energy and water efficient.
SEE-Change is supported by the ACT Government Environment and Planning Directorate. Additional support for specific projects is provided by a number of other organisations.
Source: Jodie Pipkorn, Executive Officer of SEE-Change Inc
3.3.5 Resilience to pressures
A resilience assessment involves looking at the systems, networks, human resources and feedback loops involved in maintaining environmental values (see Chapter 9).
In the case of human needs, it is important to consider both the resilience of the environment to demands made by human needs, and the ability of the environment to meet human needs and support overall livability for humans (see Chapter 9).
Human needs are being met in the ACT, with a high standard of living. However, in many areas, meeting human needs has a potential trade-off in terms of environmental quality.
Human needs are key drivers of threats to ecosystem services, and this in turn can reduce the capacity of ecosystems to provide the services that meet human needs (eg clean air, clean water, open nature spaces). Many processes exist in the ACT that consider human needs as part of their planning, and there is an emerging focus on how environmental condition links to human health and wellbeing. However, there is often a lack of connectivity between strategies supporting human health and wellbeing, and those supporting environmental health.
Livability includes access to green space, natural space and outdoor recreation; maintaining human health via maintaining ecosystem services that support it (eg air quality); and a built environment that supports livability and ecosystem services. Achieving this requires striking a careful balance between private and public space, and considering the ecological footprint of ACT residents beyond the ACT’s borders.
The ACT has well-articulated policies for many areas of livability, such as providing open space for recreation and aesthetics, developing community assets such as bike paths, and planning for development to support livability. A wide range of processes within planning frameworks, as well as public debate and broader political processes, are used to articulate evolving values regarding human needs.
Some aspects of the relationship between human wellbeing and environmental health are well understood and measured – for example, the thresholds at which air quality affects the ability to meet human needs for clean air are well known and monitored. Other aspects, however, are less well understood, with little ongoing monitoring or understanding of thresholds. For example, although there is good understanding that having access to natural and green spaces is beneficial for human health, there is less information on when and how green space matters – what size do green spaces need to be? How should they be structured? What changes represent threats to the ability of these spaces to provide health benefits? Associated with this, feedback on whether we are approaching critical thresholds is limited in areas where there is limited monitoring or understanding of thresholds, particularly where systems have linkages to systems outside the ACT.
The ACT has a diversity of skills and expertise in meeting human needs, but this expertise is not always well connected in the form of networks that consider the linkages between environmental health and human needs. There are few policy makers who examine social dimensions of environmental policy and emerging research in this sector. This limits the ability to identify early feedback that may signal a need to change behaviours to reduce the pressures placed on the environment by human needs.
a The figure differs from the Territory and Municipal Services 2014–15 Annual Report and the related accountability indicator on recycling due to additional data being made available after the release of the annual report.
b Calculated by the OCSE, using data from the ABS,5 as growth in financial-year average population from 2010–11 to 2014–15. Population for the March and June quarters in 2015 was estimated by the OCSE.
c Data provided by the Territory and Municipal Services Directorate
e http://www.environment.act.gov.au/environment/environment_protection_authority/view_all_agreements_authorisations
f The ecological footprint is available at http://www.environmentcommissioner.act.gov.au/ecologoical-footprints.