Earth’s climate has been changing during the past century. The atmosphere and oceans have warmed, glaciers and ice sheets have decreased in size, sea levels have risen, and there has been an increase in extreme weather events. There is strong scientific evidence that human activities that result in greenhouse gases being emitted – such as burning fossil fuels and large-scale land-use change – have been the main cause of these climatic changes. It is also anticipated that there will be further climatic changes as a result of human society’s continuing release of greenhouse gases.
This chapter will:
- define climate change
- explain why climate change is important
- explain how climate change is measured using
- climate change indicators
- greenhouse gas emissions
- describe and assess the magnitude of climate change impacts in the Australian Capital Territory (ACT) on
- humans
- the natural environment
- summarise the relationship between climate change and resilience
- summarise Government and community responses to climate change by way of
- adaptation
- mitigation.
2.2.1 What is climate change?
The United Nations Framework Convention on Climate Change defines climate change as:
… a change of climate which is attributed directly or indirectly to human activity that alters the composition of the global atmosphere and which is in addition to natural climate variability observed over comparable time periods.
The definition of climate change from the Intergovernmental Panel on Climate Change (IPCC) recognises any measurable persistent change in climate that lasts for a decade or longer, whether due to natural variability or as a result of human activity. Both definitions are relevant in the discussion of climate change as a pressure on our environment.
The Australian Capital Territory (ACT) Commissioner for Sustainability and the Environment accepts the definitive assessment of the evidence for climate change comprehensively presented by the IPCC in its Fifth Assessment Report, released in November 2014. This group of more than 3000 scientists from 85 countries concludes that:1
Warming of the climate system is unequivocal, and since the 1950s, many of the observed changes are unprecedented over decades to millennia. The atmosphere and ocean have warmed, the amounts of snow and ice have diminished, sea level has risen, and the concentrations of greenhouse gases have increased.
This assessment is supported by the Australian Academy of Science, which concludes that:2
Earth’s climate has changed over the past century. The atmosphere and oceans have warmed, sea levels have risen, and glaciers and ice sheets have decreased in size. The best available evidence indicates that greenhouse gas emissions from human activities are the main cause. Continuing increases in greenhouse gases will produce further warming and other changes in Earth’s physical environment and ecosystems.

Snow falls in the ACT are predicted to decrease as our climate changes. Photo: Penny Bradfield, Fairfax Syndication
The science behind these statements is supported by extensive studies based on four main areas of evidence:
- Physical principles established more than a century ago tell us that certain trace gases in the atmosphere, such as carbon dioxide and water vapour, restrict the radiant flow of heat from Earth to space. This mechanism, known as the ‘greenhouse effect’, keeps Earth’s surface and lower atmosphere considerably warmer than they would otherwise be (Figure 2.1). The gases involved are called ‘greenhouse gases’. An increase in greenhouse gas concentrations raises the temperature of the surface. The burning of fossil fuels releases carbon dioxide. Because of this, since the start of the industrial era (about 1750), the effect of human activities on climate has, overall, been a warming influence.
- The record of the distant past (millions of years) tells us that climate has varied greatly through Earth’s history. It has, for example, gone through 10 major ice-age cycles during about the past million years. During the past few thousand years of this period, during which civilisations developed, climate was unusually stable. Evidence from the past confirms that climate can be sensitive to small persistent changes, such as variations in Earth’s orbit.
- Measurements from the recent past (the past 150 years) tell us that Earth’s surface has warmed as atmospheric concentrations of greenhouse gases have increased through human activities, and that this warming has led to other environmental changes. Although climate varies from decade to decade, the overall upward trend of average global surface temperature during the past century is clear.
- Climate models allow us to understand the causes of past climate changes and to project climate change into the future. Together with physical principles and knowledge of past variations, models provide compelling evidence that recent changes are due to increased greenhouse gas concentrations in the atmosphere. They tell us that, unless greenhouse gas emissions are reduced greatly and greenhouse gas concentrations are stabilised, greenhouse warming will continue to increase.
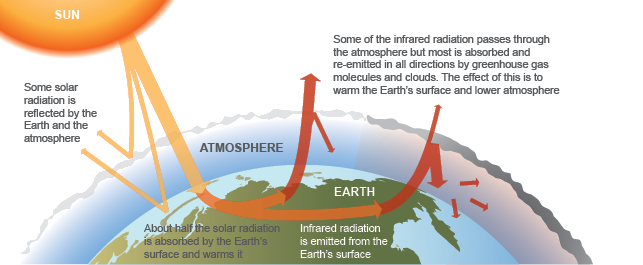
Source: Intergovernmental Panel on Climate Change3
Figure 2.1 The greenhouse effect
Some of the key changes noted by the IPCC report are:3
- Each of the past three decades has been successively warmer at Earth’s surface than any preceding decade since 1850. In the Northern Hemisphere, 1983–2012 was likely the warmest 30-year period of the past 1400 years.
- Ocean warming dominates the increase in energy stored in the climate system, accounting for more than 90% of the energy accumulated between 1971 and 2010. It is virtually certain that the upper ocean (0–700 m) warmed from 1971 to 2010, and it is likely that it warmed between the 1870s and 1971.
- During the past two decades, the Greenland and Antarctic ice sheets have been losing mass, glaciers have continued to shrink almost worldwide, and Arctic sea ice and Northern Hemisphere spring snow cover have continued to decrease in extent.
Climate variability
It should be noted that Australia’s climate has large natural variations, and human-induced climate change is therefore superimposed on natural variability. This variability has existed for many thousands of years, and poses challenges for recording and analysing changes in climate extremes, not just in Australia, but across the whole world.
For the Australian region, the main drivers of natural variability are the:
- El Niño–Southern Oscillation (ENSO; Figure 2.2)
- Indian Ocean Dipole
- Madden–Julien Oscillation
- Southern Annular Mode.
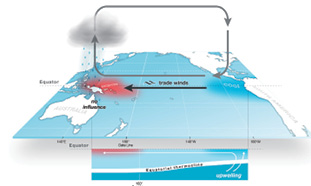
Source: Bureau of Meteorology, http://www.bom.gov.au/climate/enso/history/ln-2010-12/three-phases-of-ENSO.shtml
Figure 2.2 El Niño–Southern Oscillation
Of these, ENSO has the most significant influence on Australia’s – and most likely the global – climate. In particular, it affects south-eastern Australia, including the ACT and surrounding region. ENSO refers to shifts in ocean and atmospheric conditions. There are three phases of ENSO: El Niño, La Niña and the neutral (or ‘normal’) phase. An El Niño phase is associated with abnormally warm central and east equatorial Pacific Ocean surface temperatures, while the La Niña phase is associated with cool ocean temperatures in this region. Both extremes are associated with a characteristic spatial pattern of droughts and floods. An El Niño episode is usually accompanied by drought in south-eastern Australia, Asia, India, south-eastern Africa, Amazonia and north-east Brazil, with fewer than normal tropical cyclones around Australia and in the north Atlantic Ocean.
The frequency and duration of these phases are highly variable. For example, the El Niño phase typically occurs every 3–8 years. Each event evolves and decays on seasonal timescales (ie months), and reaches a peak in intensity before conditions start to return to a near-normal state. However, historically, successive events over several years can and do occur. Two successive La Niña events occurred in 2010–11 and 2011–12, causing the wettest two-year period on record for Australia as a whole. The typical ENSO cycle includes a gradual build-up of ENSO conditions beginning in late Southern Hemisphere autumn or early Southern Hemisphere winter. ENSO typically peaks in late spring or early summer (near the end of the calendar year) and then wanes in late summer or early autumn. Although every El Niño has behaved differently, generally the ENSO cycle spans the course of a year, with autumn being the transitional period. Successive events are more common with La Niña than with El Niño.
The IPCC’s 5th Assessment Report concluded that there is high confidence that ENSO will very likely remain as the dominant mode of interannual variability in the future and, due to increased moisture availability, the associated precipitation variability on regional scales will likely intensify.
2.2.2 Why is climate change important?
Climate change has emerged during the past three decades as the most significant challenge to our environment. It is certain that climate change will affect not only us, but our children and grandchildren as well. Climate change and its impacts therefore pose a serious challenge for governments and communities around the world.2,3
The ACT faces a number of serious challenges related to climate change, including decreased rainfall, and increased temperatures and fire danger.4 It is important to understand the drivers and impacts of climate change to develop strategies that address the risks they pose to human wellbeing. Building resilience in the social and environmental systems of the ACT is a core part of achieving this, as it allows us to focus on maintaining the desired values of the ACT’s environment despite the effects of climate change.

Predicted impacts of climate change in the ACT include higher temperatures and an increased risk of fire Photo: Mark Jekabsons
Climate change and humans
Modern societies are highly dependent on a stable climate. Human civilisations emerged mostly during the past 10 000 years, a timespan that coincides with the geological epoch known as the Holocene, characterised by relatively stable climate conditions. The development of agriculture, the formation of settled towns and cities, and the associated cultural changes may not have been possible without the onset of the Holocene.5–7 Under projected changes to Earth’s climate in the coming decades and centuries, there is significant risk that the conditions that have supported human wellbeing during the past millennia will be disturbed.8 Australia is expected to experience an increase in average temperatures, extreme weather events and fire danger; a change in rainfall patterns; and a decrease in soil moisture and run-off.9 A changing climate also leads to changes in the frequency, intensity, spatial extent, duration and timing of extreme weather events.10
Humans are likely to be affected by climate change in multiple ways, such as through:9,11-14
- negative consequences for water supply and agricultural productivity
- direct and indirect threats to human health
- risks and damage to infrastructure and associated costs
- negative impacts on natural environments and ecosystems.
Climate change and the natural environment
Natural ecosystems are vulnerable to climate change. It is therefore likely that the delivery of ecosystem services will be substantially altered under future scenarios of climate change.15–17
In the ACT, the combined effect of decreased rainfall, increased temperatures and increased fire incidents is likely to substantially alter the function, composition and structure of ecosystems.18 As a result of these various climate change impacts, the capacity of ecosystems to provide benefits such as clean air, food and water may be hampered, and the cultural values of ecosystems may be diminished.
2.2.3 How do we measure climate change?
Measuring climate change involves the use of indicators that establish the current state of the climate, trends or changes in climate, pressures causing the change and the impacts caused by the change.
The ACT State of the Environment Report has adopted, and modified as necessary, indicators developed by the IPCC:19
- state and trend indicators (evidence of climate change)
- changes in local and regional mean temperatures
- changes in local and regional climate variables
- changes in the intensity or frequency of extreme events
- pressure indicators (causes of climate change)
- greenhouse gas emissions levels.
Mean temperatures
Each of the past three decades has been successively warmer at Earth’s surface than any preceding decade since 1850 (Figure 2.3). In the Northern Hemisphere, 1983–2012 was likely the warmest 30-year period of the past 1400 years.
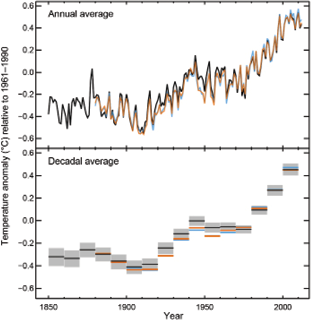
Top: Annual mean values from three datasets. Bottom: Decadal mean values from three datasets, including the estimate of uncertainty for one dataset (black). Anomalies are relative to the mean of 1961−1990.
Source: Intergovernmental Panel on Climate Change
Figure 2.3 Observed global mean combined land and ocean surface temperature anomalies, 1850–2012
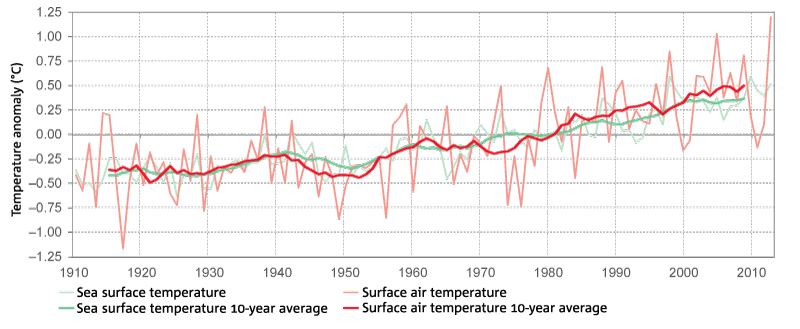
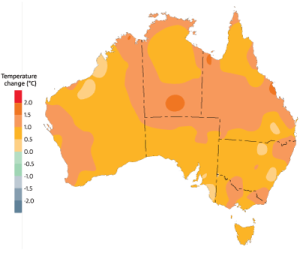
Top: Deviations from the 1961–1990 average of sea surface temperature and temperatures across land in the Australian region. Bottom: Distribution of annual average temperature change across Australia since 1910. Source: Adapted from the Bureau of Meteorology & CSIRO,21 pp 4–5
Figure 2.4 Sea surface temperature and temperatures across land in the Australian region since 1910

An Erickson Air Crane drops water on a bushfire near the eastern edge of the Brindabella Ranges. With a warming climate the ACT will experience increased severe fire danger. Photo: Nick Moir, Fairfax Syndication
The ACT region
The NSW/ACT Regional Climate Modelling (NARCliM) project developed climate change projections for the ACT and region under a range of possible future climates. NARCliM is a multiagency research partnership between the New South Wales (NSW) and ACT Governments, and the Climate Change Research Centre at the University of NSW.
The long-term mean annual daily maximum temperature trend indicates that temperatures in the region have been increasing since around 1950. The most recent decades have experienced the largest increases in three temperature variables (ie average, maximum and minimum). The ACT is expected to experience an increase in all three annual temperature variables in the near future (2020–2039) and the far future (2060–2079) (Figure 2.5).
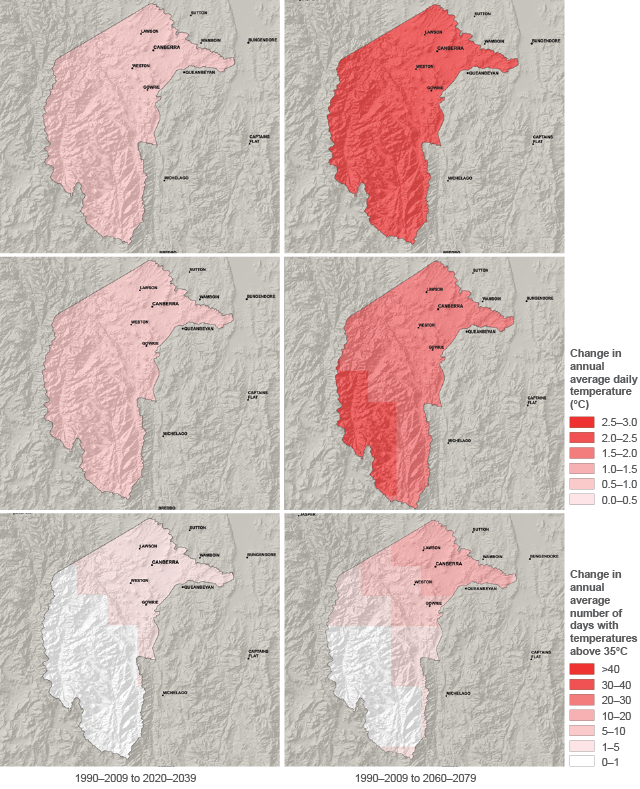
Figure 2.5 Mean annual temperature projections for the ACT, 2020–2039 and 2060–2079
Maximum temperatures are projected to increase by 0.7 °C in the near future and by 2 °C in the far future. Spring will experience the greatest changes in seasonal mean maximum temperatures, increasing by 2.5 °C in the far future. Minimum temperatures are projected to increase by 0.6 °C in the near future and by 2 °C in the far future.
Currently, the ACT experiences an average of around six hot days each year (ie temperatures above 35 °C). The region is projected to experience an additional two hot days in the near future and six hot days in the far future. These increases will be seen mainly in spring and summer, although, in the far future, hot days will also likely extend into autumn.4
Climate variables
In northern Australia, recent rainfall has been higher than average, and in southern Australia, it has been lower than average (Figure 2.6).
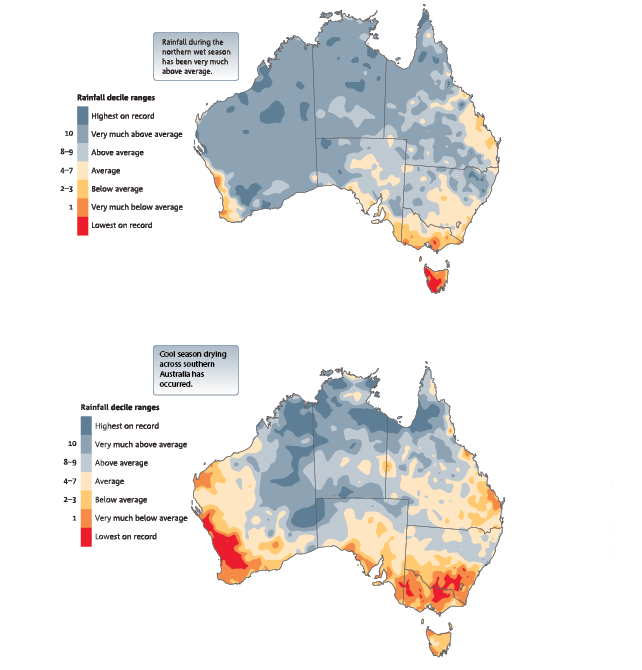
The maps show the relative ranking (in 10% increments) of rainfall from July 1995 to June 2014 compared with the average since 1900 for (top) northern Australian wet season (October–April) and (bottom) southern Australian wet season (April–November). Source: Adapted from the Bureau of Meteorology & CSIRO,21 pp 6–7
Figure 2.6 Rainfall across Australia, July 1995 to June 2014
Australian average annual rainfall has increased since national records began in 1900, largely due to marked increases in rainfall across the north-west from October to April. In recent decades, declines in rainfall have been observed in the south-west and south-east of the continent, with a 17% decline in average winter rainfall since 1970 in the south-west and a 15% decline in the south-east. The cool-season drying across southern Australia in recent decades, and evidence of increased rainfall across the Southern Ocean, is associated with changes in atmospheric circulation. Although natural variability likely plays a role, a range of studies suggest that ozone depletion and global warming are contributing to circulation and pressure changes, most clearly affecting the south-west. However, uncertainties remain, and this is an area of ongoing research.
The reduction in rainfall is amplified in stream flow in our rivers and streams. In the far south-west, stream flow has declined by more than 50% since the mid-1970s. In the far south-east, stream flow during the 1997–2009 drought (referred to as the millennium drought) was around half the long-term average.21
The ACT region
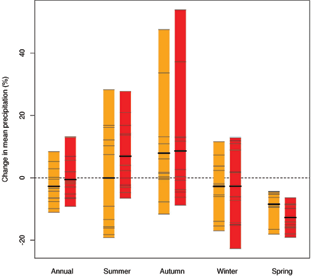
Projections for the region’s annual average rainfall range from a decrease (drying) of 11% to an increase (wetting) of 8% by 2030, and projections still span both drying and wetting scenarios (–9% to +13%) by 2070. The ACT currently experiences considerable rainfall variability across the region, and from season to season and from year to year, and this variability is also reflected in the projections.
All models agree that spring rainfall will decrease in the ACT in the near and far future, but the size of the decrease varies between models for both the near future (–18% to –4%) and the far future (–6% to –19%). Seasonal rainfall projections for the near future span both drying and wetting scenarios for summer (–19% to +28%), autumn (–12% to +48%) and winter (–17% to +12%). In the far future, there are projected changes for summer (–7% to +28%), autumn (–9% to +54%) and winter (–23% to +13%) (Figure 2.7).4
Notes:
1. Yellow bars represent the near future (2020–2039).
2. Red bars represent the far future (2060–2079).
3. Thin grey lines represent the individual models; there are 12 thin lines or models for each bar.
4. The thick line represents the average of all 12 models for the region.
5. The length of the bar shows the spread of the 12 model values for the region.
6. Each line is the average for the region. They do not represent a single location in the region. Source: NSW Office of Environment and Heritage & ACT Government,4 p 12
Figure 2.7 Projected changes in average rainfall for the ACT, annually and by season, in the near future and far future
Extreme events
Changes in many extreme weather and climate events have been observed since about 1950:22
- In a warming climate, extremely cold days occur less often and very hot days occur more often. It is very likely that the number of cold days and nights has decreased, and the number of warm days and nights has increased on the global scale.
- It is likely that the frequency of heatwaves has increased in large parts of Europe, Asia and Australia. Since records began, trends in the frequency, duration and intensity of heatwaves have increased across much of Australia, with these trends accelerating since 1970.
- It is likely that there are more land regions where the number of heavy precipitation events has increased than where it has decreased.
- It is very likely that human influence has contributed to the observed global-scale changes in the frequency and intensity of daily temperature extremes since the mid-20th century.
In Australia, human-induced climate change is superimposed on natural variability. Some changes in Australia’s climate extremes stand out from the background variability. As a whole, the average sea level around Australia is expected to be about 15 cm higher by 2030 relative to 1990. Some models project that tropical cyclones will become less frequent – but more severe in peak rainfall intensity – as the world warms. Bushfires are more likely as the average fire danger index increases, particularly in the south-east and south-west part of the continent.23
The ACT region
Severe and average fire weather is projected to increase. The ACT is projected to experience an increase in average and severe Forest Fire Danger Index in the near and far future. Although these changes are relatively small in magnitude (three more days every decade), they are projected to occur in prescribed burning periods (spring) and the peak fire-risk season (summer). The northern ACT will have the greatest increases, and these increases occur across all seasons.
Autumn is projected to have a decreased severe fire risk in the near future due to the projected increase in autumn rainfall across the region, but there is less confidence in the projections for the far future.
Greenhouse gas emissions
Anthropogenic (human-influenced) greenhouse gas emissions have increased since the pre-industrial era, driven largely by economic and population growth, and are now higher than ever (Figure 2.8). This has led to atmospheric concentrations of carbon dioxide, methane and nitrous oxide that have been unprecedented in at least the past 800 000 years. Their effects, together with those of other anthropogenic drivers, have been detected throughout the climate system and are extremely likely to have been the dominant cause of the observed warming since the mid-20th century.3
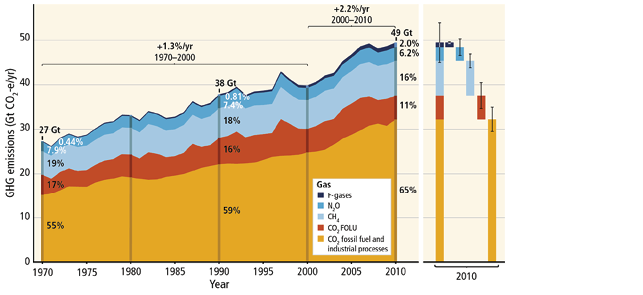
CH4 = methane; CO2 = carbon dioxide; CO2-e = carbon dioxide equivalent; F-gases = fluorinated gases; FOLU = forestry and other land use; GHG = greenhouse gas; Gt = gigatonne; N2O = nitrous oxide; yr = year Source: Intergovernmental Panel on Climate Change,1 p 5
Figure 2.8 Total annual anthropogenic greenhouse gas emissions, by groups of gases, 1970–2010

The ACT Government uses some electric vehicles in an effort to reduce emissions from transport Photo: ACT Government
Greenhouse gases emitted by human activities and measured in the ACT are:
- carbon dioxide, which enters the atmosphere by burning fossil fuels (coal, natural gas and oil), solid waste, trees and wood products, and also as a result of certain chemical reactions (eg manufacture of cement)
- methane, which is emitted during the production and transport of coal, natural gas and oil. Methane emissions also result from livestock and other agricultural practices, and from organic waste decay in municipal solid-waste landfills
- nitrous oxide, which is emitted during agricultural and industrial activities, as well as during combustion of fossil fuels and solid waste
- fluorinated gases, including hydrofluorocarbons, perfluorocarbons, sulfur hexafluoride and nitrogen trifluoride, which are synthetic gases that are emitted from a variety of industrial processes. These gases are typically emitted in smaller quantities, but because they are potent greenhouse gases, they are sometimes referred to as high global-warming potential gases.
The ACT region
Total ACT greenhouse gas emissions
It should be noted that the ACT Greenhouse Gas Inventory includes emissions for electricity consumed in the ACT but produced outside the Territory. These are called scope 2 emissions. The National Inventory Report, prepared by the Australian Government, does not account for scope 2 emissions. Instead, it assigns emissions to the jurisdictions where the emissions are actually generated. The ACT Government has chosen to include scope 2 emissions to recognise and take responsibility for all emissions associated with the consumption of energy, whether or not they occur inside or outside of the Territory.
ACT greenhouse gas emissions rose steadily during the years until 2010 (Figure 2.9), when the ACT Government prescribed a legislative greenhouse gas emissions reduction target (the Climate Change and Greenhouse Gas Reduction Act 2010). The target is a reduction in greenhouse gas emissions of 40% below the 1989–90 level of emissions by 2020. This target is consistent with the IPCC’s recommendations and the most ambitious target in Australia. As a consequence of the legislation and various supporting initiatives (for an example, see Case study 2.1), emissions have steadily fallen since 2010–11 (Figure 2.9 and Table 2.1).
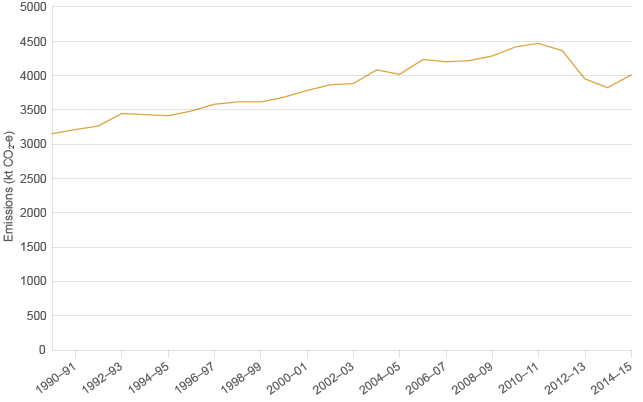
kt CO2-e = kilotonnes of carbon dioxide equivalent
Note: The trends in total ACT emissions are correct; however, methods used in the greenhouse gas inventory have changed over the period. Source: Pitt&Sherry24
Figure 2.9 Total ACT greenhouse gas emissions, 1990–2014
Table 2.1 ACT greenhouse gas emissions, 2010–2015
| 1989–90 | 2010–11 | 2011–12 | 2012–13 | 2013–14 | 2014–15 | 2020 target | |
|---|---|---|---|---|---|---|---|
|
Total emissions including LULUCF (kt CO2-e) |
3185.5 |
4459.7 |
4352.1 |
3869.2 |
3759.8 |
3934.1 |
1911 |
|
Total emissions excluding LULUCF (kt CO2-e) |
4471.6 |
4364.3 |
3939.0 |
3829.6 |
4004.0 |
kt CO2-e = kilotonnes of carbon dioxide equivalent; LULUCF = land use, land-use changes and forestry
Per-capita emissions for the ACT peaked earlier (in 2005–06) than the total Territory emissions and dropped below the 1989–90 level in 2012–13 (Figure 2.10).
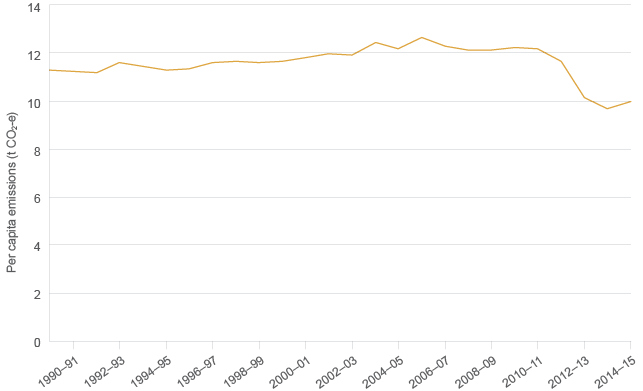
t CO2-e = tonnes of carbon dioxide equivalent
Note: The trends in total ACT emissions are correct; however, methods used in the greenhouse gas inventory have changed over the period. Source: Pitt&Sherry24
Figure 2.10 ACT per-capita greenhouse gas emissions, 1990–2014
Emissions by source
Stationary energy is the dominant source of emissions in the ACT, and produced more than two-thirds of the carbon dioxide equivalent emissions that were attributable to the ACT in 2014–15, as in all previous years.
The transport sector is also very important, with one-quarter of emissions coming from petroleum-based fuels used in transport vehicles. Industrial processes, waste, and fugitive emissions related to the energy sector account for the remainder of emissions. The net effect in 2014–15 of land use, land-use changes and forestry was a reduction in emissions of 69.8 kt of carbon dioxide equivalent.
Figure 2.11 provides the broad breakdown of ACT emissions based on results for the years 2012–2015.
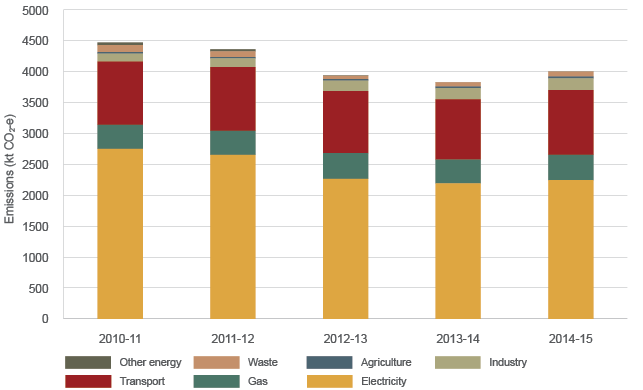
kt CO2-e = kilotonnes of carbon dioxide equivalent
Note: This figure incorporates data from Pitt & Sherry (2015) ACT Greenhouse Gas Inventory for 2014–15: with recalculations for 2012–13 and 2013–14, prepared for the Environment and Planning Directorate ACT Government, Canberra, and from the Independent Competition and Regulatory Commission (2014) ACT Greenhouse Gas Inventory Report 2011–12, ICRC, Canberra. The datasets in the two reports are based on different methods, including updates to emissions factors for methane and nitrous oxide.
Figure 2.11 Annual ACT greenhouse gas emissions, by source, 1989–2014
Emissions relating to some form of energy use accounted for around 93% of emissions in 2014–15. This is the combined emissions of stationary energy, energy for transport and fugitive emissions (which, in the case of the ACT, is the leakage of natural gas). Stationary energy emissions are predominantly attributable to the generation of electricity used in the ACT, but also include emissions from use of natural gas, non-transport use of petroleum fuels, including LPG, heating oil and fuel oil, and use of fuel wood. Emissions attributed to non transport petroleum fuels and fuel wood are very small.
Although electricity production still accounts for the highest proportion of emissions, the overall reduction in ACT emissions since 2010 has been mainly from decreases in stationary energy emissions (Figure 2.11).
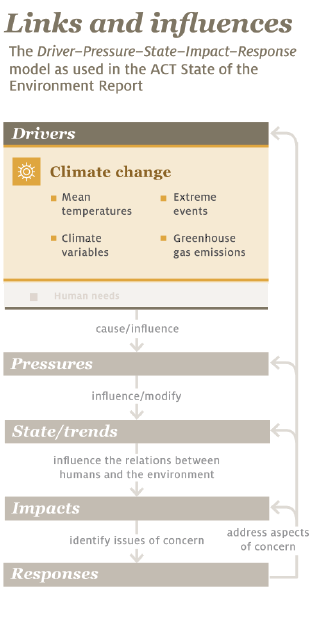
Emissions from energy are determined by two factors: total demand and emissions intensity. The reduction in electricity emissions in the ACT is due to a steady fall in total demand for electricity since around 2010. In addition, since 2010, the emissions intensity of electricity supplied through the National Electricity Market (NEM) has decreased. This holds true up to 2014–15. In 2014–15, a decrease in NEM renewable energy caused an increase in emissions. Roof-top photovoltaic installations have emerged as a significant, zero-emissions source of electricity supply, displacing some purchases of NEM electricity, and thereby further reducing the weighted average emissions intensity of electricity used by ACT consumers. (See Case study 2.1.)
Emissions relating to some form of energy use accounted for around 94% of total emissions (excluding land use, land-use changes and forestry) in 2013–14. This is the combined emissions of stationary energy (electricity, natural gas and fuel wood), energy for transport and fugitive emissions (leakage of natural gas) (Figure 2.12). The use of electricity from fossil-fuelled power stations is by far the biggest single source of emissions in the ACT. The combustion of petroleum-based fuels for transport purposes is the second largest source of emissions, significantly outweighing the third largest emissions source – the use of natural gas for stationary energy purposes (eg home space and water heating). Natural gas leaks (where natural gas escapes before combustion) and the burning of wood for the space heating of ACT homes are relatively small emissions sources. There has also been a small fall in fugitive emissions from natural gas leakage, in line with the small fall in total demand for natural gas.
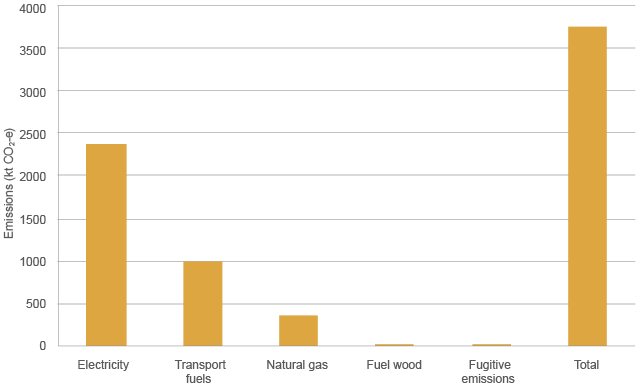
kt CO2-e = kilotonnes of carbon dioxide equivalent
Figure 2.12 ACT greenhouse gas emissions from energy use, 2013–14
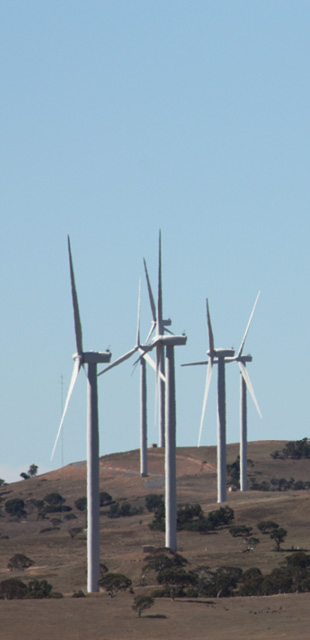
Windfarms contribute to a reduction in emissions from energy production feeding into the national electricity market and used by ACT consumers Photo: ACT Government
Case study 2.1 The Energy Efficiency Improvement Scheme
The Energy Efficiency Improvement Scheme (EEIS) started on 1 January 2013. It sets an Australian Capital Territory (ACT)–wide energy savings target, legislated obligations and options for ACT electricity retailers to meet an individual ‘retailer energy savings obligation’. These activities are determined by the Minister for the Environment and must be carried out in accordance with codes of practice approved by the EEIS Administrator. Retailers incur penalties if they do not meet their targets.
A 2014 review of the EEIS found that it had achieved its four objectives:
- to encourage the efficient use of energy
- to reduce greenhouse gas emissions associated with stationary energy use
- to reduce household and business energy use and costs
- to increase opportunities for priority (low-income) households in the ACT to reduce energy use and costs.
By mid-2015, the EEIS had:
- delivered energy savings in more than 50 000 Canberra households, of which nearly 30% are priority households
- delivered an average savings of $1600 in participating households during the life of energy-saving items, or $318 per year
- installed more than 550 000 energy-saving items, saving about 440 000 tonnes of carbon dioxide equivalent emissions; this includes the replacement and recycling of more than 465 000 incandescent light globes with energy-efficient light globes
- installed more than 43 000 door seals to keep hot air inside during winter and out during summer
- installed more than 85 000 stand-by power controllers, preventing power wastage by equipment left on when not in use
- retired and recycled more than 1500 old, inefficient refrigerators and freezers
- created 35 full-time equivalent private sector jobs, with this number expected to grow.
The ACT Government has extended the EEIS to run until 2020. This recognises the significant success of the EEIS to date, and the potential that remains to implement cost-effective energy savings in ACT households and businesses. The key elements of the EEIS extension are to:
- maintain momentum on ambitious, but achievable, targets for low-cost electricity and gas; households and businesses should see a decrease in their energy bills as a result of energy efficiency improvements
- deliver economic benefits of around $40 million to the ACT economy, and $106 million to householders
- give even greater certainty to energy retailers about their obligations under the scheme
- support competition and business opportunities by harmonising the ACT system with those of other jurisdictions.

ActewAGL electrician installing a downlight. Photo: with permission of ActewAGL
Source: http://www.environment.act.gov.au/energy/energy_efficiency_improvement_scheme_eeis
a http://unfccc.int/files/essential_background/background_publications_htmlpdf/application/pdf/conveng.pdf; the convention entered into force on 21 March 1994.
b For an overview and references to the key technical documents, see http://www.climatechange.environment.nsw.gov.au/Climate-projections-for-NSW/About-NARCliM