


ACT State of the Environment Report 2011
Accurate, timely & accessible information for the community regarding the condition of the environment, underlying pressures, and sustainability trends.
THEME: Climate
Indicator cluster: Mitigation
Download: Indicator cluster: Mitigation.pdf
The indicators for this cluster are:
- Energy supply (R) - energy sources and trends, fuel sales, ACT Government purchase of renewable energy, and effectiveness of renewable energy and energy efficiency programs;
- Emission reduction in waste and transport (R) - effectiveness of initiatives to reduce emissions in Waste and Transport sectors; and
- Emissions reduction by infrastructure, buildings and industry (R) - effectiveness of initiatives to reduce emissions in Infrastructure, Buildings and Industry sectors.
Condition indicators (C) present data that tell us the state of the environment at any particular time.
Pressure indicators (P) present data about the main human activities that could potentially adversely affect the condition of the environment.
Impact indicators (I) present data on the effect that environmental changes have on environmental or human health.
Response indicators (R) present data about the main things we are doing to alleviate pressures, or to improve the condition of the environment.
Summary [top  ]
]
In the ACT, households use more energy per person than households in most of the other Australian States or Territories. Most (98%) of the energy used in ACT comes from outside its borders. Coal is the main source of the Territory's energy. Although electricity sourced from renewable energy is increasing in popularity, voluntary purchases of GreenPower still makes up less than 5% of total electricity bought.
In 2010, the ACT Government set out in legislation the most ambitious greenhouse gas emission targets of any state or territory. However, to date no pathway for reaching these targets has been developed. The second action plan under Weathering the Change (the ACT climate change strategy) is currently being developed and is expected to outline a proposed path.
The primary focus in the ACT to date has been on strategies to reduce greenhouse gas emissions. Of the 43 actions identified in ACT Climate Change Strategy - Action Plan 1, 2007-2011 (ACT Government 2007), 30 are specifically focused on mitigation. Community groups also make an important contribution to emissions reduction in the ACT. However, ACT greenhouse gas emissions have increased.
Introduction [top ]
Addressing the challenges of climate change will require both mitigation of emissions and action to help adapt to potential impacts. Mitigation refers to human intervention to reduce the sources or enhance the sinks of greenhouse gases (IPCC 2001). Adaptation and mitigation actions can differ significantly, but they need to be aligned if they are to achieve an overall effective response to climate change. This paper focuses on mitigation actions undertaken in the ACT to reduce emissions.
Condition indicators [top ]
There are no condition indicators for the Mitigation indicator cluster.
Globally, greenhouse gases continue to increase. This has been reflected in ACT greenhouse gas emissions which have also largely increased since 1990.
Further information and discussion on ACT greenhouse gas emissions is included in the Emissions indicator cluster.
Information on ACT weather patterns in recent decades can be found in the Driving Forces paper.
Pressure indicators [top ]
There are no pressure indicators for the Mitigation indicator cluster.
Carbon dioxide is the most significant contributor to greenhouse gas emissions in the ACT. In particular, carbon dioxide is emitted when electricity used for heating, cooling and lighting buildings is generated using fossil fuels. The second largest emission sources in ACT are petrol and other transport fuels.
Further information on the sources of greenhouse gas emissions in the ACT is provided in the Emissions indicator cluster.
Impact indicators [top ]
There are no impact indicators for the Mitigation indicator cluster.
The most likely future climate scenario for the ACT is warmer temperatures which may affect human health, infrastructure, biodiversity and fire risk, among other aspects of life. Changes to total rainfall are uncertain, but storm events are likely to become more frequent, leading to water and infrastructure impacts. In addition, the distribution of seasonal rainfall throughout the annual cycle is expected to alter.
Expected key impacts of climate change on the ACT are outlined in the Climate vulnerability indicator cluster. Information on ozone depletion can be found in the Emissions indicator cluster.
Response indicators [top ]
Strategic framework
In 2010, the ACT Government legislated the following targets to reduce greenhouse gas emissions in the ACT (ACT Government 2010):
- 40% below 1990 emissions by 30 June 2020;
- 80% below 1990 emissions by 30 June 2050; and
- 0 net emissions by 30 June 2060.
These targets would require greenhouse gas emissions to be significantly reduced from current levels (Figure 1).
Figure 1. The ACT's greenhouse gas emissions targets
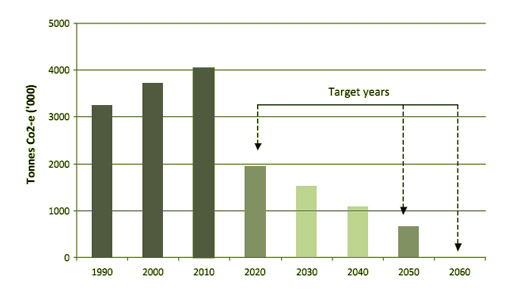
Source: DECCEW 2011
These are the most ambitious greenhouse gas emissions reduction targets of any State or Territory. To date, no pathway for reaching these targets has been developed. The second action plan under Weathering the Change, the ACT climate change strategy (ACT Government 2007), is currently being developed and is expected to outline such a path.
In May 2011, the ACT Government also legislated the following renewable energy targets for the ACT (ACT Government 2010): renewable sources to provide
- 15% of total electricity usage by 2012; and
- 25% of total electricity usage by 2020.
There is a lag in reporting against renewable energy levels. Latest figures indicate that for 2009-10, 91.1% of electricity sold in the ACT was sourced from non-renewable energy sources (ICRC 2011, ORER 2011). Recent increases in renewable energy generation resulting from the Feed-in Tariff schemes and the ACT Government's commitment to increasing its use of GreenPower (that is, power from renewable sources; GreenPower 2011) to 100% will assist in meeting the 2012 target.
The Australian Government's Clean Energy Future package (CEF 2011) is also likely to stimulate homes and businesses in the Territory to buy GreenPower, by ensuring that greenhouse gas savings associated with GreenPower are counted as additional to the national emissions reduction target.
To date, there is no pathway developed to achieve the ACT renewable energy targets, but such a pathway for the 2020 target is expected to be in either the Climate Change Action Plan 2 or the ACT's Sustainable Energy Policy (e.g. DECCEW 2009), both currently being developed.
In 2007 the ACT Government committed to achieving carbon neutrality in its own buildings and services. No strategic pathway to achieve this has been published. A report on ACT Government Agencies' Environmental Performance Reporting (OCSE 2010) has indicated that to achieve carbon neutrality, agencies need to significantly strengthen and coordinate their collection of data on energy use, and their management reporting and implementation of resource management plans. Agencies have taken steps to improve energy efficiency, although a draft framework for ACT Government carbon neutrality is not expected to be released until 2012, four years after the commitment was made. Over the reporting period, the ACT Government has allocated funding for action by individual agencies. For example, during 2007 Housing ACT was allocated $20 million over a 10-year period to improve the energy efficiency of its stock (Spotless 2011). In the 2011-12 ACT Budget a further $8 million was announced for further energy efficiency improvements to ACT Housing properties over four financial years (Spotless 2011). To date, significant work has included actions such as draught-sealing, and installation of pelmets, water-efficiency improvements and wall insulation in 216 houses, ceiling insulation in 765 houses and photovoltaic panels in 2 houses (Spotless 2011).
During the reporting period, the ACT Government's use of renewable energy increased from 22.9% in 2006-07 to 32.9% in 2010-11. This is in line with longer term trends in increasing use of renewable energy (Figure 2). Total energy use has remained relatively steady throughout the reporting period.
Figure 2. ACT Government consumption of renewable energy
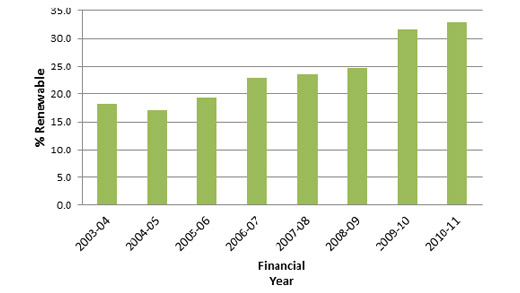
Source: TAMS
The primary focus of the ACT Government climate change strategy to date has been on reducing greenhouse gas emissions. Of the 43 actions identified in ACT Climate Change Strategy - Action Plan 1, 2007-2011 (ACT Government 2007), 30 are specifically focused on mitigation. A review of Action Plan 1 in 2010 identified that for many actions, there was insufficient data to quantify the emissions abated (DECCEW 2010). Only 12 of the actions were of a type that could be quantitatively assessed for their cost effectiveness and efficiency in reducing emissions (Table 1). For the other 31 actions, quantitative assessment of emissions reductions was not applicable. They included the development of policies, strategies and frameworks (e.g. development of an energy policy, undertaking a carbon sequestration audit and developing a connectivity map).
Table 1. Effectiveness and efficiency of climate change mitigation actions
| Action | Effectiveness: Absolute metrics of CO2 abated | Efficiency: Marginal cost of abatement ($/tonne) |
|---|---|---|
| Pursue carbon neutrality in Government buildings | Insufficient data to quantify CO2 abated. | Insufficient data to quantify the marginal cost of abatement |
| Establish a $1million Energy Efficiency Fund for ACT Government agencies | Insufficient data to quantify CO2 abated. | Insufficient data to quantify the marginal cost of abatement. |
| Legislate for GreenPower to be offered to all new electricity customers | Based on 1.19% of all electricity used in the ACT being GreenPower. Annual abatement = 35,036 tonnes of CO2-e per year. | GreenPower has an abatement cost of approximately $45 - $70 per tonne. |
| Implement energy efficiency improvements in government housing | Insufficient data to quantify CO2 abated. | Insufficient data to quantify the marginal cost of abatement. |
| Provide a solar hot water rebate | The approximate greenhouse abatement of 50 solar electric water heaters = 175 tonnes of CO2-e per year. | The estimated cost of abatement to the ACT Government based on $1000 grant per water heater = $29 per tonne. |
| Assist schools become carbon neutral | Some schools have recorded a 25% reduction in their energy use since their audits were conducted. | Insufficient data to quantify the marginal cost of abatement. |
| Undertake ACTION CNG bus fleet replacement | The average diesel bus in the ACTION fleet emits 1.079 kg of CO2-e per kilometre. The 16 CNG buses purchased for Action 12 emit 1.22 kg of CO2-e per kilometre. | According to departmental advice the new CNG buses cost $525,942 plus GST compared to $478,100 plus GST for the latest M.A.N. Euro 5 clean diesel buses. |
| Undertake energy efficient street light replacement |
According to departmental advice Action 13 has resulted in the following emissions abatement: 2007-08 = 1075 tonnes CO2-e 2008-09 = 3016 tonnes CO2-e 2009-10 = 157 tonnes CO2-e |
Insufficient data to quantify the marginal cost of abatement. |
| Introduce a feed-in tariff for renewable micro generation | The feed-in tariff supported 1.56 MW of renewable energy in January 2010. The annual abatement is 2285 tonnes CO2-e. | Department advises abatement cost = $500 per tonne. |
| Pursue an urban forest replacement program | Insufficient data to establish a base year | Insufficient data to quantify the marginal cost of abatement |
| Plant one million new trees | An average tree will capture 268 kg of CO2-e over its lifetime. 61,000 trees are to be planted in the Murrumbidgee River corridor by September 2009. The annual abatement of these trees is 884 tonnes of CO2-e per year. If the ACT reaches its goal, 14,486 tonnes of CO2-e will be sequestered per year. | Based on the existing budget information provided the marginal cost of abatement for this Action is approximately $1903 per tonne. |
| Showcase renewable and energy efficiency technologies. | Insufficient data to quantify the CO2 abatement of all projects. Solar array on Tidbinbilla Visitor's Centre saves approximately 4.9 tonnes CO2-e per year | Insufficient data to quantify the cost of abatement of all projects. Marginal cost of abatement for solar array on Tidbinbilla Visitor's Centre is approximately $273 per tonne. |
Source: DECCEW 2010
Many of the strategies have not been, or cannot be, monitored or assessed, so it is difficult to comment on which strategies have been most effective in achieving emissions reduction. Further, there is usually a lag in climate change emissions measurements, with data not available for two years. This means evaluation of action within the reporting period is even more difficult.
Energy supply
A very small portion (approximately 2%) of energy consumed within the ACT is produced within the Territory. These internal sources include (Engineers Australia 2010):
- Belconnen Landfill Gas Power Plant (1 MW capacity);
- Mugga Land Landfill Gas Power Plant (3.45 MW capacity);
- Mt Stromlo Water Treatment Plant (0.7 MW capacity);
- Googong Dam mini hydro power plant (0.6 MW capacity); and
- an increasing number of small, private renewable generators (e.g. solar panels).
It is noted that capacity does not equate to output and it is understood that the hydro plant in particular has not been operating for some time.
The remainder of the ACT's electricity supplies are sourced from various power plants across the east coast of Australia (Engineers Australia 2010).
Electricity
Over 90% of electricity sold in the ACT is sourced from non-renewable energy sources (Figure 3).
Figure 3. Electricity sales in the ACT
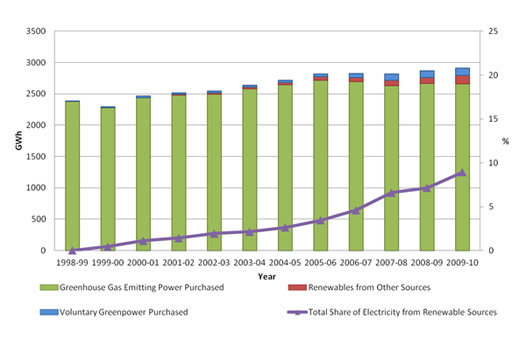
Source: ICRC 2010
Household consumption of energy per person is relatively high in the ACT, possibly because of high average disposable incomes and cold winters. However, the overall (combined residential and non-residential) average is low because the ACT has little industrial activity (Engineers Australia 2010). Further information on energy use can be found in the Emissions indicator cluster.
A number of actions have been put in place to increase use of renewable sources of energy.
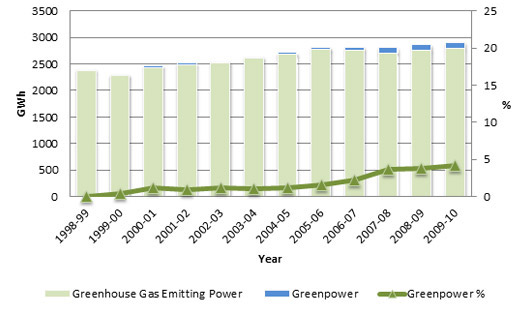
Green powerThe population of the ACT has been encouraged to purchase green (renewable) energy, and there has been a substantial increase in the total sales of GreenPower to both non-residential and residential consumers between 2006 and 2009 (Figure 4), and a steady increase in numbers of new customers choosing GreenPower through the same period. However, GreenPower still only makes up less than 5% of total energy sales in the ACT and most is bought by non-residential purchasers (Figure 4). Residential sales have fluctuated, but increased little.
Figure 4: Sales of GreenPower in the ACT
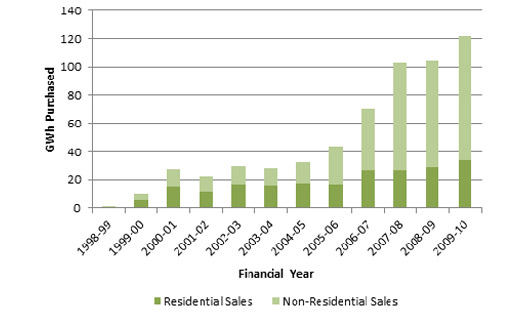
Source: TAMS 2010a
From April 2009 all ACT electricity retailers have offered all customers access to accredited GreenPower products (ICRC 2009). Increases in green energy purchases translated into a reduction in the per capita emission of greenhouse gases over the same period. The cost of green energy is higher than alternative 'non green sources' within the ACT, which has been identified as a factor restricting uptake of green energy by ACT residents and businesses.
Feed-in TariffThe ACT Government commenced a feed-in tariff scheme in March 2009 to encourage small-scale renewable energy generation to feed into the grid. The tariff is designed to encourage investment in renewable electricity generation by paying small-scale generators a premium rate for the gross amount of electricity they generate (Engineers Australia 2009). The prices set for connected systems made the ACT's feed-in tariff arrangements among the most generous in Australia, resulting in a high rate of installations, as shown in Figure 5.
Figure 5: Cumulative installed solar energy generation systems in the ACT over time
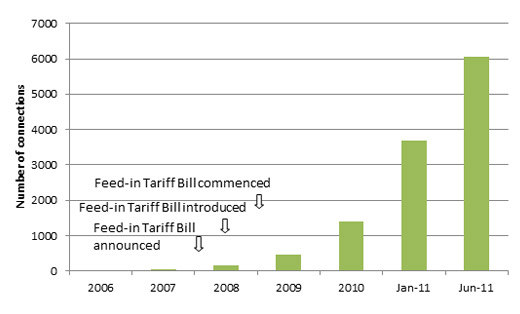
Source: TAMS
The Government set a cap on the total installed capacity of micro- and medium-scale generators which would be funded under the scheme, and on 31 May 2011 the micro-scale cap was reached. A medium-scale generator category was introduced in March 2011, for installations greater than 30 kW and up to 200 kW. In June 2011 the medium-scale scheme was revised to incorporate users producing less than 30 kW, with a cap of 30 MW. The scheme officially commenced on 12 July 2011, but the 30 MW cap was fully committed by midnight on the 13 July 2011. Despite its popularity, the total installed capacity of renewable generators at 30 June 2011 was about 14 MW (ICRC 2011). Total metered output by renewable electricity generation from 1 March 2009 to 30 June 2011 was 11,840 MWh (ICRC 2011).
A recent report by the Grattan Institute has questioned the effectiveness of rebate programs such as the ACT Feed-in Tariff. The report indicated that rebate programs have lifted sales in some products but they have also created boom-bust cycles which can disrupt the development of industry capacity and undermine investor confidence (Grattan Institute 2010). Further, such programs only reduced emissions a little. The benefits to emissions reduction as well as the benefits to the renewable energy industry should be assessed before future renewable energy policy initiatives are determined.
Despite action to increase the use of renewable sources of energy, total ACT greenhouse emissions from electricity and gas have not yet seen a discernible reduction. For more information on emissions trends in the ACT see the Emissions indicator cluster paper.
Firewood
Firewood is used in the ACT to heat some homes. Sales of firewood within the ACT have been declining since 2001. The primary identified cause for this decline is households switching to alternative energy sources for heating.
In 2009, total firewood sales increased, to 15,126 tonnes (TAMS 2010b). Nevertheless, burning of firewood is estimated to contribute only 0.3% of the total ACT greenhouse gas emissions (DECCEW 2010).
Compared with other non-renewable sources, firewood is generally preferable for limiting net greenhouse gas emissions in domestic heating (Paul et al. 2003). In principle, firewood is a renewable energy source because the carbon dioxide emitted when it burns is taken up by other trees. Forestry management practices play a role in this renewal as well. Domestic burning of firewood can have adverse effects if a wood heater is operating inefficiently. Air pollution can result from incomplete combustion of volatile substances that are then released from the wood (Hamilton 2008). See the Local air quality indicator cluster for more information.
Emission reduction in waste and transport
Transport
The most commonly sold fuel in the ACT is petrol (gasoline), followed by automotive diesel and liquid petroleum gas (LPG) (TAMS 2010c). The distribution of sales between the various sources has remained fairly constant over the years 2007-2010, with an increase in total sales from 399,855 kL in 2007-08 to 402,547 kL in 2009-10 (TAMS 2010c).
Use of biofuels such as E-10 (90% petrol and 10% ethanol) more than doubled over the reporting period, from 20,512 to 46,896 kL. The ACT has no biofuel policies, but because ACT's fuel comes through NSW, the NSW Government's Biofuel (Ethanol Content) Act 2007 and Biofuel (Ethanol Content) Amendment Act 2009 determine biofuel content in the ACT. The Biofuel Act establishes mandated minimum ethanol content per total volume of petrol sales. The minimum amount has increased over the reporting period from 2% in 2007 to 4% by January 2010 and 6% by January 2011. The increase could also indicate that more E-10-compatible cars are in use, or that drivers are more aware of the impacts of greenhouse gas emissions.
Fuels differ in the amount of carbon and energy they contain, and therefore in their emissions of greenhouse gases. The total emissions for the various fuel types in the ACT are shown in Figure 6.
Figure 6. Emissions by fuel type, ACT
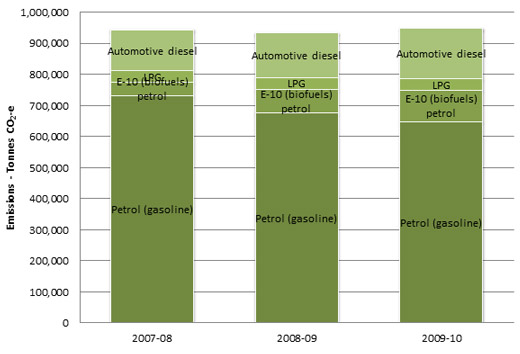
Source: TAMS 2010c. (Note: Aviation gasoline and aviation turbine fuel figures are too small to appear on the figure.)
During the reporting period, emissions from transport (calculated from fuel purchases in the ACT) have largely remained steady (Figure 6). Transport contributes 23% of the emissions directly attributable to the ACT, in addition to a significantly larger share when interstate travel and freight are considered. Reducing transport emissions will be fundamental in achieving the ACT Government's greenhouse gas reduction targets.
The ACT Government has no specific targets for reducing the greenhouse gas emissions attributable to the transport sector, but it has focused on actions to increase use of sustainable transport options (cycling, walking and public transport) in an effort to reduce emissions. The ACT Government's Sustainable Transport Plan (TAMS 2006) sets targets to change the mode of travel used for work trips, from car to public transport and walking and cycling. Even if the ACT is on track to achieve these targets, transport sector emissions are still projected to increase to 50-60% above 1990 transport sector emissions levels (ICRC 2011, Heuris Partners 2010)1. This suggests that transport policy will have to be seriously reassessed if offsetting and disproportionate emissions reductions in other sectors are to be avoided.
No targets have been set for non-work modes of travel, or for total vehicle kilometres travelled. A number of initiatives, such as the development of additional park'n'ride facilities, expanded buslanes and rechargeable MyWay cards, have been implemented over the reporting period, and are expected to increase use of sustainable transport options. There is some evidence of an increase, although to date there has been little change in public transport patronage. For information on modes of transport used in the ACT see the Transport indicator cluster.
National legislation governs standards for vehicular emissions from vehicles, which include reduced emissions of carbon dioxide. Under this legislation, national average carbon dioxide emissions for passenger and light cars have reduced from 252.4 g/km in 2002 to 212.6 g/km in 2010 (NTC 2011).
The Green Vehicle Guide is a national website developed to provide information about the environmental performance of new light vehicles2 sold in Australia since mid-2004. It is updated regularly as new models come onto the market.
In 2008, the ACT Government introduced incentives for ACT drivers to switch over to low emission cars. The Green Vehicles Duty Scheme prices stamp duty according to the car's emissions, based on a combination of greenhouse gas and particulate emissions. It is difficult to assess the effectiveness of this scheme because there have been significant socio-economic changes over the reporting period: for example, significant petrol price increases, and the global financial crisis. There was an increase in sales of 'environmentally leading cars' from 2% to 4% between 2008 and 2010. However, vehicles with above-average environmental performance still make up less than 20% of the total ACT fleet in 2009-2010. See the Local air quality indicator cluster for more information.
Emissions from motor vehicles are affected not only by the emissions emitted per vehicle but also by the number of vehicles, the total distance travelled and the age of vehicles. The total number of vehicles registered in the ACT continued to rise, with an increase of 15.6% between 2005 (219,552) and 2010 (253,848) (ABS 2011a). The total distance travelled had decreased during the last reporting period (from 3234 million km in 2004 to 3014 million km in 2006) but has increased further during this reporting period (to 3539 million km in 2010) (ABS 2011b). This increase in number of vehicles and distance travelled does not appear to be reflected in fuel sales data which increased by less than 1% over the period.
The ACT Government has commissioned research to identify opportunities and gaps, to find effective options for reaching the greenhouse gas emission targets (Heuris Partners 2010). The report indicated that investments in urban form and integrated community planning, road pricing and public transport will require further work and engagement with the community (Heuris Partners 2010).
Waste
Although waste makes little contribution to the ACT's carbon dioxide emissions, it makes up a large percentage of the ACT's emissions of two other important greenhouse gases: methane (13%) and nitrous oxide (18%) (DECCEW 2010b). Methane is not retained in the atmosphere for as long as carbon dioxide or nitrous oxide, but it is more effective at trapping heat and therefore has a larger impact over a shorter period of time.
Three strategies have been employed by the ACT Government to reduce waste emissions: reductions in total waste to landfill; recycling of waste materials; and methane capture and subsequent burning for electricity generation.
Some years ago, the ACT Government set a goal of achieving no waste going to landfill, through the No Waste by 2010 - Waste Management Strategy for Canberra (ACT Government 1996). Despite the gains achieved by this Strategy, the total amount of waste generated by the ACT has increased by 276,092 tonnes (34.7%) during the period from 2007-08 to 2010-11. Over this period, the amount of waste to landfill increased by 29.1% and the amount of resource recovery increased by 36.7%. The ACT is currently considering the Draft Sustainable Waste Strategy 2010-2025. The draft strategy has a focus on managing organic waste (a key contributor to methane emissions in landfill) and incorporates targets of over 80% resource recovery by 2015 and over 90% resource recovery by 2025 (DECCEW 2010b). For more information see the Waste indicator cluster paper.
In 2008, 13% of the ACT's methane emissions came from landfill. The West Belconnen and Mugga Lane landfills have implemented facilities to capture methane and transform it into a renewable source of energy, rather than burning it as a waste gas. The equivalent quantity of carbon dioxide abated from methane capture in the two facilities is shown in Figure 7. Total methane consumed at the Mugga Lane facility has increased over the last decade (from 2706 tonnes in 2002-03 to 5115 tonnes in 2009-10), providing an increasing waste-to-energy source (from 12,527 MWh in 2002-03 to 22,808 MWh in 2009-10). However, methane capture and use fell slightly over the reporting period. At the West Belconnen site methane capture and power generation have declined over the same period, probably because the site has been decommissioned for active waste disposal (DECCEW 2010b).
Figure 7: Methane consumed from the two ACT landfills, 2002-2011
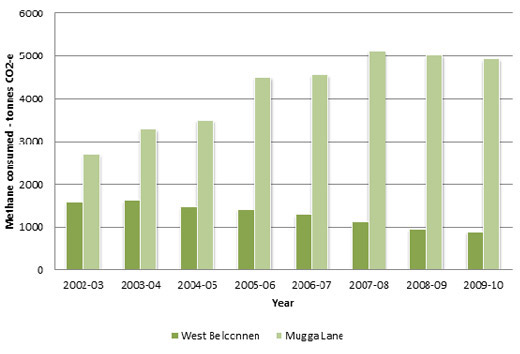
Source: TAMS,2009
Table 2 shows estimates of the total greenhouse gas emissions mitigated by the recycling of various waste materials in the ACT. For further information on recycling in the ACT see the Waste indicator cluster.
Table 2. Greenhouse gas savings from recycling
| Material | Tonnes recycled 2008-09 | Greenhouse gas emissions savings (CO2-e tonnes) |
|---|---|---|
| Paper | 57,000 | 88,000 |
| Timber | 31,000 | 5000 |
| Glass | 16,000 | 5000 |
| Aluminium | 2000 | 30,000 |
| Steel Cans | 1000 | 1000 |
Source: DECCEW 2010b
Emissions reduction by infrastructure, buildings and industry
Infrastructure emissions reductions
Infrastructure typically has a life-span of several decades, and is an important component of a government's budget. Consequently, the ACT Government has invested in emissions reduction schemes such as energy efficient lighting, which has projected cost savings of $187,446 over three and a half years (Figure 8) and energy savings of 50 kWh (Figure 9).
Figure 8. Projected savings from street lamp retrofit
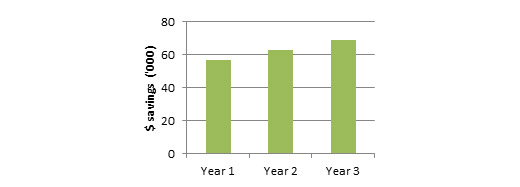
Source: TAMS 2010d
Figure 9. Comparison of energy use pre- and post-retrofit
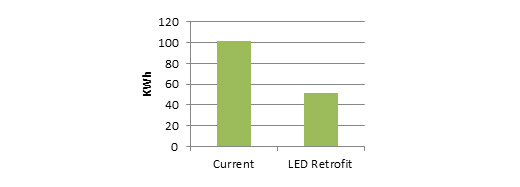
Source: TAMS 2010d
In addition, the ACT Government has implemented initiatives to both reduce electricity consumption and increase renewable energy uptake, including mandating building energy efficiency. The effectiveness of these actions has not been measured, but with emissions from electricity consumption being the largest contributor to total greenhouse gas emissions, it is important to assess the effectiveness of emission reduction actions in this sector.
Building emission reduction
There are a number of voluntary systems for measuring the sustainability of new buildings. Some, such as the National Australian Built Environment Rating System (NABERS), measure the actual performance of the building, and can include behaviour and appliances. Others, such as Green Star, which is used to rate buildings in the ACT, predict performance at the building-design stage.
Since 2006 the Australian Government has required that all new government office leases comply with Green Lease Schedules, which stipulate a NABERS energy rating of at least 4.5 stars energy (exclusive of GreenPower) for all new leases. This has resulted in an incremental upgrading of commercial buildings in Canberra, for example when Australian Government departments have changed tenancies or constructed purpose-built facilities.
There are 24 green-star buildings in the ACT (Green Building Council 2011), of which 2 are 6-star, 12 are 5-star and 10 are 4-star, and there are 6 buildings registered for green-star education design, office design or office interiors. The 6-star buildings in the ACT are 9/31 City West Offices and AEI Premises in Trevor Pearcey House.
In 2011 the ACT Government released draft amendments to the Territory Plan which aim to improve solar efficiency of houses through aspects of their design and position on a block. The amendments have been implemented in the new suburbs of Coombs and Wright, and multi-unit developments there will have to meet a 7-star energy rating under the Nationwide House Energy Rating Scheme (NatHERS).
For more information see the Urban quality indicator cluster paper.
A recent report has identified a number of opportunities for emission reductions in the ACT in the buildings in the residential and commercial sectors (Heuris Partners 2010). This work should be considered in the development of the new Climate Change Action Plan as well as in relevant planning documents.
Community engagement
The ACT Government runs a number of programs to support the community in energy, waste and transport efficiency (Table 3). As Table 3 shows, programs have ranged in their levels of uptake.
Table 3. ACT Government programs with a community environmental focus
| Type | Name and date commenced | Uptake |
|---|---|---|
| Commercial / Business resource efficiency programs | CitySwitch, 2009 | 16 organisations participating |
| Residential energy efficiency programs | HEAT program, 2005 |
Inquires - 32,308 Audits - 5217 Rebates - 2416 |
| Low income energy efficiency programs | Outreach, 2010 | 1002 individuals |
| WEST Plus program, 2011 |
Audits – 54 Education Sessions – 16 Retrofits - 20 |
|
| Waste reduction programs | ACT Smart Business & Office, 2009-10 |
52 organisations accredited 281 organisations participating |
| Transport | TravelSmart, 2007 | 11,000 household pilot (not ACT-wide) |
| Schools | AuSSI ACT School Program, 2007-08 |
Registration - 120 schools Energy Audits - 67 schools |
| Renewable energy | Solar feed-in tariff, 2009 (closed 2011) | 6057 connections |
Source: DECCEW, ICRC 2011
Amounts of emissions reduced by such programs are not available and are difficult to quantify. In 2010-11, the ACT Government also provided a grants program targeting climate change action. Eight community organisations received grants for actions, such as the 2011 Canberra International Electric Vehicle Festival, and the Residential Greenhouse Gas Reduction Awards. It is likely that the climate change grants will be incorporated into wider environmental grants in the future.
Community groups also make an important contribution to emissions reduction in the ACT though activities to encourage sustainable transport, energy efficiency and education and awareness. Community groups in the ACT are also increasingly focused on climate change; for instance, SEE-Change, and Canberra ♥ 40% are taking on community leadership in solar energy and emission reduction activities.
More information on community engagement to reduce emission is provided in the Community engagement indicator cluster paper.
Footnotes [top ]
1. Calculations are based on ICRC transport emissions data from the 2009 Greenhouse Gas Emissions Inventory (ICRC 2011) and ACT Government-commissioned research into existing policy baseline projections to 2050(Heuris Partners 2010), as well as estimates of a 3% reduction based on mode-share shifts detailed in the Draft Sustainable Energy Policy 2010-2020 (DECCEW 2009).
2. up to 3.5 tonnes gross vehicle mass
Glossary [top ]
GreenPower: GreenPower is a voluntary government accredited program that that allows electricity retailers to purchase renewable energy on behalf of customers. For details see, http://www.greenpower.gov.au/
Carbon neutrality: Carbon neutrality, or having a net zero carbon footprint, refers to achieving net zero carbon emissions by balancing a measured amount of carbon released with an equivalent amount sequestered or offset, or buying enough carbon credits to make up the difference. It is used in the context of carbon dioxide releasing processes, associated with transportation, energy production and industrial processes
CO2-e carbon dioxide equivalents - they express the global warming potential of all greenhouse gases as single figure based on the potential warming of carbon dioxide
References [top ]
ABS 2011a. Motor Vehicle Census, Australia. Cat.no. 9309.0. Australian Bureau of Statistics. Australian Government. Canberra. http://www.ausstats.abs.gov.au/ausstats/subscriber.nsf/0/03CFF66BA0471A68CA257829001168D6/$File/93090_31%20Mar%202010.pdf (accessed 17/11/11)
ABS 2011b. Survey of Motor Vehicle Use, Australia, 12 months ended 31 October 2010. Cat.no. 9208.0 Australian Bureau of Statistics. Australian Government. Canberra. http://www.ausstats.abs.gov.au/ausstats/subscriber.nsf/0/4576F71CCF2E9F65CA2578F4001E5E98/$File/92080_12%20months%20ended%2031%20october%202010.pdf (accessed 4/9/11)
ACT Government 1996. No Waste by 2010 - A Waste Management Strategy for Canberra. Canberra. http://www.tams.act.gov.au/__data/assets/pdf_file/0013/12460/nowasteby2010strategy.pdf (accessed 3/5/11)
ACT Government 2007. Weathering the Change. ACT Climate Change Strategy - Action Plan 1, 2007-2011. Canberra. http://www.environment.act.gov.au/__data/assets/pdf_file/0005/144527/Climate_Change_Action_Plan.pdf (accessed 28/11/11)
ACT Government 2010. Climate Change and Greenhouse Gas Reduction Act 2010. Current on 5 November 2011. Canberra. http://www.legislation.act.gov.au/a/2010-41/current/pdf/2010-41.pdf (accessed 15/8/11)
CEF 2011. Working Together for a Clean Energy Future. Clean Energy Future. Australian Government. Canberra. http://www.cleanenergyfuture.gov.au/ (accessed 1/12/11)
DECCEW 2009. Draft Sustainable Energy Policy 2010-2020. Department of the Environment, Climate Change, Energy and Water. Act Government. Canberra. http://www.environment.act.gov.au/__data/assets/pdf_file/0006/174687/Draft_Sustainable_Energy_Policy_FINAL.pdf (accessed 7/11/11)
DECCEW 2010. ACT Climate Change Strategy: Weathering the Change - Action Plan 1 Review. Department of the Environment, Climate Change, Energy and Water. ACT Government. Canberra. http://www.environment.act.gov.au/__data/assets/pdf_file/0005/201110/Kinesis_review_Action_Plan_1.pdf (accessed 5/9/11)
DECCEW 2010b. Draft Sustainable Waste Strategy 2010-2025. Department of the Environment, Climate Change, Energy and Water. ACT Government. Canberra http://www.environment.act.gov.au/__data/assets/pdf_file/0009/210501/SustainableWaste_Strategy_WEB.pdf (accessed 1/10/11)
DECCEW 2011. Sustainable Energy Policy: Energy for a Sustainable City 2010-2020. Department of the Environment, Climate Change, Energy and Water. ACT Government. Canberra. http://www.environment.act.gov.au/__data/assets/pdf_file/0003/232284/EDS_ACT_Sustainable_Energy_Policy_FA_web_A.PDF (accessed 7/11/11)
Engineers Australia 2010. ACT Infrastructure Report Card. Canberra. http://www.engineersaustralia.org.au/shadomx/apps/fms/fmsdownload.cfm?file_uuid=C8F26346-DB84-45EF-E104-B53E726D4A61&siteName=ieaust (accessed 20/6/11)
Grattan Institute 2010. Learning the Hard Way: Australia's Policies to Reduce Emissions. Melbourne. http://www.grattan.edu.au//publications/077_report_energy_learning_the_hard_way.pdf (accessed 14/10/11)
Green Building Council 2011. Green Star Project Directory. Sydney. http://www.gbca.org.au/greenstar-projects/ (accessed 19/06/11)
GreenPower 2011. GreenPower: Accredited Renewable Energy. Green Power. Australian Government. Canberra. http://www.greenpower.gov.au/ (accessed 28/11/11)
Hamilton, L. 2008. Firewood and Woody Biomass and their Role in Greenhouse Gas Reduction. Department of Primary Industries. Australian Government. http://www.homeheat.com.au/pdf/Heating_Greenhouse_Gas.pdf (accessed 27/7/11)
Heuris Partners 2010. ACT Greenhouse Gas Emissions: Existing policy baseline projections to 2050 - Research Report. Heuris Partners. Canberra. http://www.environment.act.gov.au/__data/assets/pdf_file/0008/187217/ACT_Greenhouse_Gas_Emissions.pdf#ACT%20Greenhouse%20Gas%20Emissions (accessed 7/11/11)
ICRC 2009. Electricity Feed-in Renewable Energy Premium: Determination of Premium Rate, Report 9 2009. Independent Competition and Regulatory Commission. Canberra. http://www.icrc.act.gov.au/__data/assets/pdf_file/0009/172629/Report_9_of_2009_November_2009.pdf (accessed 11/11/11)
ICRC 2011. ACT Electricity Feed-in Scheme Activity Summary: 1 March 2009 to 30 June 2011. Independent Competition and Regulatory Commission. Canberra. http://www.icrc.act.gov.au/__data/assets/pdf_file/0015/230208/Electricity_Feed-in_Summary_Report_JuneQ11_Final.pdf (accessed 1/8/11)
IPCC 2001. Climate Change 2001: Synthesis Report - A Contribution of Working Groups I, II, III to the Third Assessment Report of the Intergovernmental Panel on Climate Change. Intergovernmental Panel on Climate Change. Cambridge and New York. http://www.ipcc.ch/pdf/glossary/tar-ipcc-terms-en.pdf (accessed 19/6/11)
NTC 2011. Carbon Dioxide Emissions from New Australian Light Vehicles 2010 - Information Paper. May 2011. National Transport Commission, Melbourne. http://www.ntc.gov.au/DocView.aspx?DocumentId=2135 (accessed 18/11/11)
OCSE 2010. Report on an Audit/Assessment of ACT Government Agencies' Environmental Performance Reporting. Office of the Commissioner for Sustainability and the Environment. Canberra. unpublished.
Paul, K., Booth, T., Elliot, A., Jovanovic, T., Polglase, P. and Kirschbaum, M. 2003. Life Cycle Assessment of Greenhouse Gas Emissions for Domestic Woodheating - Greenhouse Gas Emissions from Firewood Production Systems. Australian Greenhouse Office. Australian Government. Canberra. http://utting.net.au/doc/lifecycle.pdf (accessed 12/3/11)
Spotless 2011. Energy Efficiency and Climate Change Strategy 2011 to 2017. Report by Spotless to Department of Housing and Community Services. ACT Government. Canberra
TAMS 2006. Sustainable Transport Plan for the ACT. Department of Territory and Municipal Services. ACT Government. Canberra. http://www.tams.act.gov.au/move/sustainable_transport/sustainable_transport_plan_actions/sustainable_transport_plan (accessed 13/4/11)
Other data sources
In addition to these published reports, data for this paper were also sourced from:
- ACT Department of the Environment, Climate Change, Energy and Water (DECCEW) - now Environment and Sustainable Development Directorate (ESDD)
- ACT Department of Territory and Municipal Services - now Territory and Municipal Services Directorate (TAMSD)
- Independent Competition and Regulatory Commission (ICRC)


Share this page: