ACT State of the Environment Report 2011
Accurate, timely & accessible information for the community regarding the condition of the environment, underlying pressures, and sustainability trends.
Headline Indicators
Download: Headline Indicators.pdf
The impact that Canberra has on both local and global natural environment is continuing to increase. This section looks at the key indicators of the city's impact on the environment. Canberra is a very liveable city. However, as a largely urban population with high levels of consumptions of goods and services, we are increasing the impact on the natural environment globally and locally.
Ecological Footprint [top  ]
]
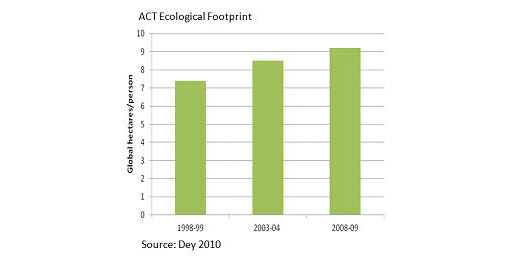
An ecological footprint is a calculation of the area of land and water required to support our use of resources and our disposal of wastes (expressed in 'global hectares'). This measure accounts for the land needed to support only the human population, and not other species. In 2008-09 the size of the average ACT resident's ecological footprint was 9.2 global hectares. This has increased by 8% in 5 years and nearly 25% in 10 years.
Our 2008-09 ecological footprint was 13% above the Australian average and nearly 3.5 times the global average. If everyone in the world lived in the same way as the average person in the ACT, we would need 5 Earths to give us enough land (and surface water) to provide our resources and absorb our wastes. Associated with this over-consumption is increasing waste generation and greenhouse gas emissions.

Waste [top  ]
]
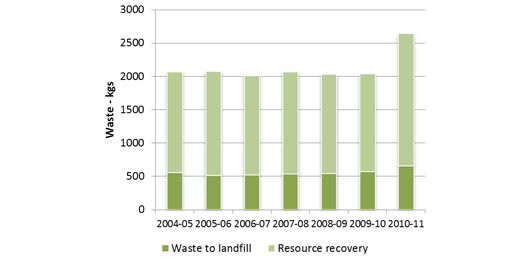
ACT waste generation per person (ACT and Queanbeyan)

Source:TAMSD
Total waste generation has increased by about 35% since the last reporting period. While we continue to recycle over 70% of our waste, we also continue to increase the amount of waste sent to landfill. Consequently, waste generation per person has increased by 28% since the previous reporting period, while population has increased by only 5.5%. This has implications for the environment through potential contamination of environmental assets and land used for landfill.
Greenhouse gas emissions [top  ]
]
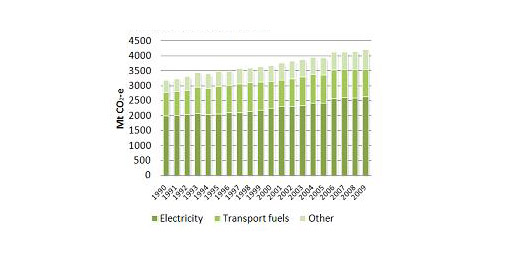
ACT Greenhouse gas emissions

Source: ICRC 2011
Globally, both anthropogenic emissions and atmospheric concentrations of greenhouse gases continue to increase. This increase has been reflected in the ACT with emissions rising by 7% between 2005 and 2009. Our lifestyles that demand a considerable use of resources are driving the increase of these emissions.
Electricity produced by burning fossil fuels remains the largest contributor to our greenhouse gas emissions, followed by natural gas and transport fuels. It is thus clear that efforts to reduce emissions need to focus on these sectors.
Physical Climate Effects [top  ]
]
Changes in weather phenomena
| Year | 1961-1990 Average | 2008-2010 Average |
|---|---|---|
| Days 35°C or more | 5 | 11 |
| Days 30°C or more | 30 | 43 |
| No. Frosts | 99 | 65 |
| No. Thunderstorms | 23 | 20 |
| No. Fogs | 44 | 39 |
| No. Strong Wind Days | 26 | 24 |
| No. Rain Days | 105 | 101 |
| Mean Daily Pressure (isobars) | 1016.7 | 1017.4 |
Source: Davis and Lindesay 2011
Having a relatively stable and predictable climate is important for many reasons including human wellbeing, the health of ecosystems, maintenance of water resources, conservation of biodiversity and for food security. During the reporting period, the weather in the ACT was generally warmer than the long-term average (1961-1990), with drier conditions in 2008 and 2009 and wetter conditions for 2010. During the reporting period, the ACT region recorded below average rainfall for 7 of the last 10 years (2001-2010). Long-term trends indicate that temperatures have been increasing with more marked increases over the past 10 years, in line with overall trends for Australia (Davis and Lindesay 2011). These results tend to reflect the impacts of El Nino Southern Oscillation events. While climate variability has been evident over the reporting period, longer-term trends are consistent with the climate change predictions of hotter and drier conditions with more extreme climate events.
Land and Water [top  ]
]
Weather events and urban pressures impact the health of our natural environment. Recovery from fire and drought and a number of catchment management projects are likely to have contributed to the overall improved land health in the ACT over the reporting period. However comprehensive data on land health are not available. Generally, water flowing out of the ACT at Halls Crossing is of no less quality than that flowing into the Territory at Angle Crossing. Changes in geology, urban run-off and return of treated sewerage are impacting on a number of water quality indicators (pH, conductivity, total nitrogen and chlorophyll 'a').
Biodiversity [top  ]
]
The area of land zoned for urban use in the ACT increased by about 9% during the reporting period (ACTPLA). This has grown at the expense of areas of native and modified vegetation. Three new nature reserves were added to Canberra Nature Park conservation reserves during the reporting period, namely, Callum Brae, Jerrabomberra West and Kama. In addition, approximately 80 hectares have been added to the existing reserves. However, in 2010, 17 species and 2 communities were listed as endangered and 15 as vulnerable under the Nature Conservation Act 1980 (ACT). During the reporting period 3 new species (the Little Eagle, Glossy Black-Cockatoo and Pink-Tailed Worm Lizard) were listed as vulnerable.
References [top  ]
]
Davis, C. and Lindesay, J. 2011. Weather and Climate of the ACT 2007-11 and decadal trends. Office of the Commissioner for Sustainability and the Environment. Canberra
Dey, C. 2010. The 2008-09 Ecological Footprint of the Population of the ACT. Sydney. http://envcomm.act.gov.au/_data/assets/pdf_file/0015/211182/ACT_Ecological_Footprint_08-09_final_report.pdf (accessed 17/11/11)
ICRC 2011. ACT Greenhouse Gas Inventory Report for 2008-09. Independent Competition and Regulatory Commission. Canberra. http://www.icrc.act.gov.au/__data/assets/pdf_file/0009/235719/ACT_Greenhouse_Gas_Inventory_Report_2009_Final.pdf (accessed 11/10/11)Intergovernmental Panel on Climate Change (IPCC). 2001. IPCC Third Assessment Report (IPCC, 2001 a,b,c): Annex B Glossary of Terms, http://www.ipcc.ch/pdf/glossary/tar-ipcc-terms-en.pdf (accessed 19/6/11)
Other data sources
In addition to these published reports, data for this paper were also sourced from:
- ACTPLA. ACT Planning and Land Authority (now Environment and Sustainable Development Directorate, ESDD)
- Department of Territory and Municipal Services (now Territory and Municipal Services Directorate, TAMSD)
- Environment Protection Authority, ACT Department of Environment, Climate Change, Energy and Water, DECCEW - now Environment and Sustainable Development Directorate (ESDD)


Share this page: