


ACT State of the Environment Report 2011
Accurate, timely & accessible information for the community regarding the condition of the environment, underlying pressures, and sustainability trends.
THEME: People
Indicator cluster: Transport
Download: Indicator cluster: Transport.pdf
The indicators for this cluster are:
- Transport assets (C) - includes length of busways and cycle paths, and land area used for roads;
- Transport modes and use (C) - includes modal split and trends in transport use and vehicle size;
- Transport accessibility (C) - includes pedestrian access to shops;
- Commuting and congestion (P) - includes time spent commuting and levels of congestion;
- Transport and human health impacts (I) - includes health impacts from transport infrastructure and use, such as noise, pollution, accidents, safety, obesity; and
- Transport management (R) - effectiveness of transport management responses.
Condition indicators (C) present data that tell us the state of the environment at any particular time.
Pressure indicators (P) present data about the main human activities that could potentially adversely affect the condition of the environment.
Impact indicators (I) present data on the effect that environmental changes have on environmental or human health.
Response indicators (R) present data about the main things we are doing to alleviate pressures, or to improve the condition of the environment.
Summary [top  ]
]
Transport is a major contributor to the environmental footprint of urban areas, particularly in the ACT where road provision and use are extensive. Roads comprise around 7.5% of our built area, while the transport sector is the ACT's second-largest source of greenhouse gas emissions - a share that is projected to increase significantly.
Transport patterns and trends in the ACT reveal a mixed picture: high dependence on cars and low usage of public transport, but higher rates of cycling than the Australian average. Walking appears to be more common than the national average for work trips but less common for non-work or school trips. Although in the 5 years to 2006 there was a modest shift away from the private car to public transport, this trend has reversed since 2006. Public transport patronage has stagnated while motor vehicle travel has begun to grow again. On the positive side, cycling continues to increase, although it accounts for only a small share of work related travel.
As environmental awareness has increased, different transport goals have emerged. Traditional concerns about traffic congestion have been joined by concerns about greenhouse gas emissions, air pollution and the health effects of sedentary lifestyles. In 2010, the Time to Talk phase of the Canberra 2030 planning process revealed strong and widespread support for a change in transport priorities, with a focus on improved public transport and reduced greenhouse gas emissions.
A key challenge for increasing the use of more sustainable transport modes in the ACT is to bridge the disconnection between Government and community goals for greater use of sustainable transport options, as identified in the Sustainable Transport Plan and the Time to Talk: Canberra 2030 process, and the on--ground reality of Canberrans' transport behaviour.
Introduction [top ]
Transport assets, systems and transport choices have significant impacts on the ACT community and Canberra, as well as on the quality of the environment. Different transport modes such as private vehicles, public transport and walking, have different impacts on the environment and human health. The amount of travel by each form of transport is influenced by land use and transport policies as well as by individual behaviours and choices.
Condition indicators [top ]
Transport assets
The ACT road system, which is extensive in relation to its population and in comparison to other Australian cities, comprises a connected network of toll-free freeway-standard roads (parkways). There is no heavy or light urban rail infrastructure beyond an interstate rail connection at Kingston and, following closure of the short Belconnen busway in 2009, no fully segregated roadways for buses. However, there is a modest but growing network of on-road bus lanes, and the ACT also has the nation's most extensive (relative to population) network of bicycle paths and on-road cycle lanes.
In June 2011 there were approximately 3319 km of roads, 16 km of bus or transit lanes and 2120 km of footpaths in the ACT. There were also around 377 km of on-road cycle lanes and 342 km of off-road cycle paths (Table 1). Accurate data are not available on the total area of land covered by roads in the ACT but, based on a minimum lane width of 3.5 m, the 6397 km of lanes in the ACT are likely to cover at least 22.39 km² (TAMS 2011a). This is equivalent to roughly 7.5% of the 300 km² occupied by the Canberra urbanised area at the 2006 census. Housing blocks also contain driveways and garages and some of the lanes on roads in the ACT are significantly wider than 3.5 m, so the area of land devoted to vehicular transport is likely to be larger than this estimate.
From 2007 to 2011 the length of bus lanes increased by 3.85 km, or 32%, and the length of footpaths increased by 150 km, or 7.6% (Table 1). Over the same period 131.14 km of on-road cycle paths and 10.19 km of off-road cycle paths were built, representing increases to existing cycle-path infrastructure of 53.5% and 3% respectively, while 381 km of new road lanes were also built, an increase of about 13% (Table 1).
Table 1. Transport assets (accumulated), 2007-2010
| Infrastructure type | 2007-08 | 2008-09 | 2009-10 | 2010-11 |
|---|---|---|---|---|
| Road length (km) | 2937.64 | no data | 3302.96 | 3318.90 |
| Bus/transit lane length (km) | 12.15 | 12.15 | 12.3 | 16 |
| On-road cycle lane length (km) | 245.86 | 312.06 | 338.69 | 377 |
| Off-road cycle lane length (km) | 331.9 | 336.76 | 339.35 | 342 |
| Footpath length (km) | 1970 | 2045 | 2078 | 2120 |
Source: TAMS 2011a, TAMS
Parking
The ACT Parking and Vehicular Access Guidelines (Urban Services 2000) and the yet-to-be-finalised Draft ACT Parking Strategy (TAMS 2007) aim to provide an adequate supply of convenient and reasonably priced car parking to support economic and social activities (TAMS 2007). A comprehensive parking inventory and use survey for the Canberra central business district (CBD, i.e. Civic and surrounds) and the town centres in 2001 recorded almost 57,000 off-street public and tenant-only parking spaces, with an average usage rate of 58%, well below that of other Australian capital cities (TAMS 2007). In 2009, there were 22,000 off-street parking spaces in Canberra's CBD and 24,467 spaces in total, of which around a third were vacant at the time of survey. This represents two parking spaces for every three CBD workers (ACT Government 2010a:17, 7).
The largest employer in the ACT is the Australian Government; it is also the largest supplier of employee parking. Most of this parking, particularly in the Parliamentary Triangle, is provided free, reducing the effectiveness of incentives to use alternate forms of transport.
Public transport vehicles and services
Canberra's sole bus operator, ACTION, had 458 buses in service at 30 June 2011, similar to the 1991 fleet of 463 vehicles (ACTION 1992). Of the 2011 fleet, 200 are wheelchair-accessible buses, 155 are low-emission vehicles compliant with or better than Euro 3 standards, and 257 are fitted with bike racks. ACTION is the only public transport operator in Australia with a significant number of buses carrying bike racks. ACTION's bus fleet travelled 19.2 million km in 2010-11, representing a 10% increase in five years and a reversal of service cuts made in response to reduced funding in 2006 and 2007. However, the figure is still below the 20 million km run in 1990-91, when Canberra's population and area were around a quarter smaller than now.
Canberra's bus services operate at different frequencies, different stopping distances, in differing directions and over varying daily and weekly time periods. The most high frequency service is the Blue Rapid limited-stop route, which connects the town centres of Belconnen, Civic, Woden and Tuggeranong (formerly called the intertown route), with services every 5 minutes or better on weekdays and every 15 minutes during evenings and weekends. The Red Rapid service between Gungahlin, Civic and Fyshwick, introduced as a trial in 2009 and now made permanent, provides services every 15 minutes until 7 pm on weekdays, but does not operate during evenings or weekends. Most local routes operate at 20-30 minute intervals in peak period, with half-hourly or hourly off-peak services and hourly evening services. A separate network operates on weekends, with hourly and occasionally 2-hourly service intervals in some areas. A third Expresso network provides peak-period connections to the CBD and other major employment nodes such as Barton and Fyshwick, while a separate school bus network is available only to students. Demand-responsive Flexibus services were introduced for evening travel in 2005, but withdrawn following negative feedback from passengers.
Transport modes and use
The last comprehensive travel survey in the ACT was conducted in 1997 and is now out of date. More up-to-date information is available from the most recent Survey of Motor Vehicle Use (ABS 2011c), which covers the 12 months to 31 October 2010, and the 2009 survey of national transport usage patterns (ABS 2009)1. There are also data from the 2006 national census (2011 census data will not be released until 2012) and other sources such as bus patronage estimates from ACTION and bicycle commuter counts by Pedal Power ACT.
For non-work travel, the 2009 survey (ABS 2009) asked people aged over 18 which transport modes they used for "day to day trips other than to work or full-time study". Respondents could nominate more than one transport mode. Although the small sample size suggests results should be treated with caution, Canberra had:
- the highest rate of car use of the seven capitals, at 94% (Sydney was lowest with 82%);
- the lowest rate of public transport usage, at 10% (Hobart was second-lowest at 13%, Sydney highest with 29%);
- the highest cycling rate, 11% (followed by Perth, 8%); and
- the second-lowest walking rate, 38% (Brisbane was lowest with 31%; Melbourne highest with 49%).
In 2006 Canberra had the second-lowest usage of public transport (after Hobart), for travel to work, of the Australian state and national capital cities2 (ABS 2008a). Approximately 82% of Canberra people travelled to work by car or truck - either as drivers or passengers, a percentage considerably higher than the national urban average (76%), but lower than in Hobart, Perth or Adelaide. The proportion of people travelling as car or truck drivers, around 73%, was also slightly lower than in Melbourne (Figure 1). However, this is not necessarily an indicator of rates of car-pooling: some car passengers will be chauffeured (e.g. by another family member), in which case the chauffeur may be making two car trips to serve the single trip made by the passenger.
The most recent comparable statistical data (ABS 2007) showed that more people cycle to work in Canberra than in any other Australian capital city, though walking to work in Canberra is twice as popular as cycling (the national ratio is closer to 4:1) (Figure 1). The total proportion of people walking and cycling, the most sustainable modes of travel, is the second-highest nationally, after Hobart. The finding partly results from the smaller physical size of both cities compared with cities such as Sydney and Melbourne. It may also mean that a large proportion of the workforce live within a short distance of the CBD.
Figure 1. Mode of travel to work in Australian capital cities, 2006
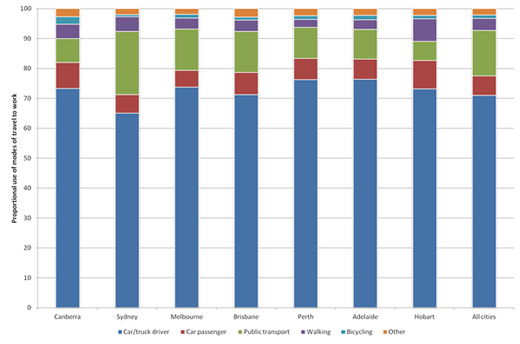
Source: based on Mees, Sorupia and Stone 2007
Figure 2 shows modes of travel to work at several centres of employment in the ACT in 2006, based on Table A1 (Annex). While the car was the dominant mode for trips to all centres, the extent of its dominance varies from a low of 71% in Civic to 100% in Hume. Conversely, use of sustainable modes of travel is highest for Civic, Woden, Belconnen and Tuggeranong.
Figure 2. Modes of travel for work trips to major centres of employment, ACT 2006
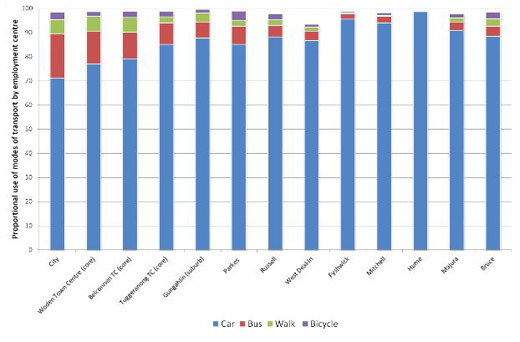
Source: based on ACTPLA 2009a
Travel distance influences the mode of transport used to travel to work. People who live close to their work location are most likely to commute by foot or bicycle. Where there has been significant residential development in inner-city locations, such as in Turner and Braddon, more people now walk to their jobs. Table 4 shows that between 2001 and 2006 the number of residents of Turner walking to work more than doubled (from 167 to 433), while the number of people cycling jumped from 83 to 110. However, these increases resulted more from a large increase in the total number of Turner residents travelling to work, from 700 to 1569, than from a rise in the share of Turner residents using sustainable modes of travel: in fact, the proportion of people cycling decreased by nearly 50% (ABS 2007)3. This finding suggests that proximity to workplaces, rather than increased residential densities of themselves, may be the most important factor in promoting walking.
Across Canberra generally, the proportion of workers travelling by public transport varied significantly depending on residential location (Figure 3). Low public transport shares in inner-city areas such as Turner are influenced by the high proportion of walkers, but in most other areas public transport's competitor is the car. The highest usage of public transport is found among people who live in areas where the bus services are very good (e.g. near Belconnen and Woden town centres) and/or where large numbers of the residents work in Civic (e.g. people living in Cook, Dickson and Lyneham), regardless of housing density. (See also Figure 2 in the Urban quality indicator cluster).
Figure 3. People who travelled to work by public transport in Canberra, 2006
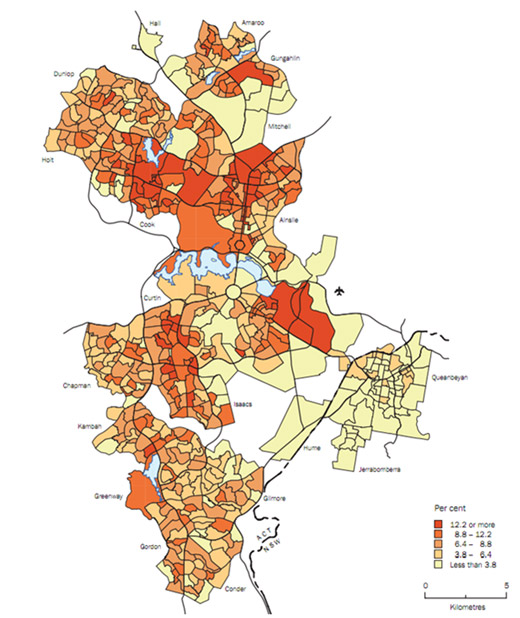
Source: ABS 2008b
Employment location
Employment location has a strong influence on travel patterns, at least for the journey to work. Employment location was a major focus of the Y-Plan in 1967 (ACT Government 2004; ACTPLA 2007) and subsequent plans for Canberra, with dispersal of employment to new town centres designed to promote self-containment - that is, people working near to home - and reduce traffic congestion. The Urban quality indicator cluster paper shows changes in employment distribution between 2001 and 2006, and in self-containment between 1991 and 2006. The long-term trend has been toward higher self-containment.
The growth in jobs in Civic has been particularly striking, with a 44% increase in the 5 years to 2006. This was accompanied by an increase in the share of Civic workers using public transport, from 12.5% to 18%; the share walking also increased, from 3.9% to 6.4%. As a result, Civic accounted for 82% of the growth in public transport work trips between 2001 and 2006, and around half the growth in walking trips (Stone and Mees 2011). The number of jobs in other in town centres remained roughly constant over the same period.
Motor vehicle registrations and usage
In 2010, there were 253,848 motor vehicles registered in the ACT (ABS 2011a). From 2005 to 2010 the number of motor vehicle registrations grew by 15.6% and from 2009 to 2010 registrations grew by 2.8% (ABS 2011a). The growth in motor vehicle registrations was higher than the average annual population growth rate, which increased by 1.7% over the same period (ABS 2011b).
Passenger vehicles accounted for 84% of all motor vehicle registrations in the ACT, which was the highest proportion of any state or territory in Australia (ABS 2011a), reflecting the lack of heavy industry and associated freight transport. Car ownership in the ACT has increased from 541 cars per 1000 people in 1998 to 596 per 1000 in 2009 (ABS 2011a). Transport was the second highest-household expenditure, after housing, for Canberrans (ACT Government 2010b). In 2003 car travel in the ACT was estimated to cost the community $1.8 billion annually, including ownership, operating and other associated costs (ACT Government 2010b).
Total travel by ACT-registered vehicles increased steadily between 2001 and 2004, from 3048 million km to 3234 million km, and then declined to 3014 million km in 2006 (Table 2). This trend, which was noted in the 2007-08 State of the Environment Report, was at least partly due to rising petrol prices, although it also matches increases in the share of trips made by public transport (see below). However, the trend has reversed since 2006: rising car use has been accompanied by falling patronage of public transport, despite continuing high petrol prices. Cuts to public transport services in 2006 and 2007 (Figure 7), and major road improvements, are likely to have played a part in these changes. In 2010, motor vehicles registered in the ACT travelled 3539 million km in total, including interstate trips. This represents an increase of more than 17% since 2006, more than double the Australia-wide increase of 8.2%, and the second-highest highest rate of growth in the nation (after Western Australia).
Table 2. Population, motor vehicle ownership and usage trends for ACT, including interstate trips, 2004-2010
| 2004 | 2005 | 2006 | 2007 | 2010 | |
|---|---|---|---|---|---|
| ACT population | 327,475 | 330,164 | 334,119 | 341,054 | 358,600 |
| ACT motor vehicle ownership | 215,581 | 217,036 | 220,827 | 227,031 | 252,771 |
| Motor vehicle travel (million km) | 3234 | 3104 | 3014 | 3160 | 3539 |
| Travel per capita (km) | 9876 | 9401 | 9021 | 9265 | 9869 |
| Vehicles per capita | 0.658 | 0.657 | 0.661 | 0.666 | 0.705 |
Source: ABS 2011c, ABS (various years)
Based on the Survey of Motor Vehicle Use (ABS 2011c), although the distance travelled per person in Canberra (7387 km per resident, excluding interstate travel) is increasing, it remains the lowest of any Australian capital city. Melbournians travel the furthest (9244 km). Reasons for the smaller distances include Canberra's small size compared with the mainland capitals, the relative absence of heavy industry and accompanying freight travel, and the fact that commuters from NSW are excluded. It is also likely that the relatively high rates of self-containment arising from Canberra's longstanding planning policies (see the Urban quality indicator) have played a part.
Public transport patronage
Bus patronage was virtually static at the end of the last reporting period (Table 3), although the 2006 census results showed a slight increase in the proportion of work trips made on public transport in the ACT since 2001. Over the current reporting period, 2007-2011, bus patronage has remained approximately the same when measured as total number of boardings, but has fallen in terms of boardings per capita (Table 3). This pattern matches changes in motor vehicle travel over the same period, suggesting that people are choosing to travel by car rather than bus. Difficulties with ACTION's ticketing system in recent years mean that it is not possible to assess how much of this recent shift has been for work and how much for non-work travel.
Table 3. Total and per capita bus boardings in Canberra, 1983-84, 1989-90, and 2002-2011
| Financial year |
Annual boardings (million) |
Canberra population (30 June) |
Per capita boardings |
|---|---|---|---|
| 1983-84 | 23.2 | 245,000 | 95 |
| 1989-90 | 25.1 | 273,000 | 92 |
| 2002-03 | 16.3 | 323,004 | 50 |
| 2003-04 | 16.3 | 323,468 | 50 |
| 2004-05 | 16.8 | 325,405 | 52 |
| 2005-06 | 17.1 | 333,715 | 51 |
| 2006-07 | 16.8 | 340,561 | 49 |
| 2007-08 | 16.9 | 345,999 | 49 |
| 2008-09 | 17.6 | 351,766 | 50 |
| 2009-10 | 16.9 | 357,931 | 47 |
| 2010-11 | 16.7* | (est) 365,000 | 46 |
Source: TAMS, ABS (various years), ACTION 1992
* Patronage figures affected by partial failure of the bus ticketing system
1983-84 was the year of ACTION's highest per capita usage, and annual boardings peaked in 1989-90 (Table 3). Bus patronage fell by around a third during the 1990s, down to 16-17 million annual trips by the end of the decade. Patronage has remained around this figure ever since, despite continued growth in population, with the result that public transport usage rates are now barely half those achieved in the mid to late 1980s (Table 3).
Comparison of per capita boardings (Table 3) and census data reaffirm the findings from the 2009 ABS travel survey that Canberra has by far the lowest usage of public transport nationally for non-work/non-school trips (ABS 2009). In the mid-1980s, Canberra had the third-highest overall public transport usage rate in Australia, following Sydney and Melbourne. The share of work trips made by public transport was higher than in Adelaide in 1991, but is now second-lowest nationally after Hobart (Figure 1).
Walking and cycling trends
More people cycle to work in Canberra than in any other Australian capital4 (Figure 1), and the 2009 survey suggests that the same holds true for non-work and non-school trips as well (ABS 2009). Nevertheless, in comparison to cities in Europe and on some other continents, few people cycle in Canberra. For example, Victoria, capital city of British Columbia in Canada, is of similar size and population density to Canberra but has twice as many people cycling and walking to work (Table 4). Canberra's percentage of cyclists approximates more to that seen in Ottawa, Canada, which has a much denser population and public transport usage rates three times that of Canberra (Table 4).
Table 4. Density and method of travel to work in selected Australian and Canadian cities, 2006
| City | Population | Density (per ha) | Public transport (%) | Walk (%) | Bicycle (%) |
|---|---|---|---|---|---|
| Canberra | 368,129 | 10.8 | 7.9 | 4.9 | 2.5 |
| Victoria, BC | 330,088 | 11.1 | 10.2 | 10.4 | 5.7 |
| Ottawa | 846,802 | 17.2 | 21.2 | 7.6 | 2.2 |
Source: Australian and Canadian censuses 2006
The cycling advocacy group Pedal Power ACT has conducted cordon-counts of cyclists entering the Civic-Acton area annually since 2004 (except for 2007). The Pedal Power counts give higher figures than the census (1541 cyclists for 2006, compared with census count of 1255), because they include all cyclists, not just workers; that is particularly important because Acton includes the Australian National University. Weather conditions may also be a factor, because the cordon-counts are conducted in summer, February-March, while the census is in winter, in August. Despite these limitations, the Pedal Power survey provides a useful account of cycling trends in inner Canberra. The results (Figure 4) show that in-bound cycling numbers during morning peak-hour have increased by two-thirds during the 7 years between 2004 and 2011, and by 41% since 2006, the year of the last census.
Information about people walking to work is more difficult to obtain, possibly because it lacks dedicated advocacy organisations to promote it. The 2006 census found that walking was twice as prevalent as cycling, on work trips, and the 1997 household survey found walking was six times as prevalent as cycling for all trip types. In 2009, walking was twice as prevalent as cycling and public transport combined, for non-work or non-school trips. Even so, Canberra people walked less than the Australian average (ABS 2009). A survey conducted in the ACT in 2010 found that respondents thought they would walk more if the routes were greener and had more trees, and if there were more amenities (such as cafes and shops) along them, as well as improved lighting and security (SKM 2010).
Figure 4: Inward and outward bicycle counts for Civic and Acton, 2004-2011
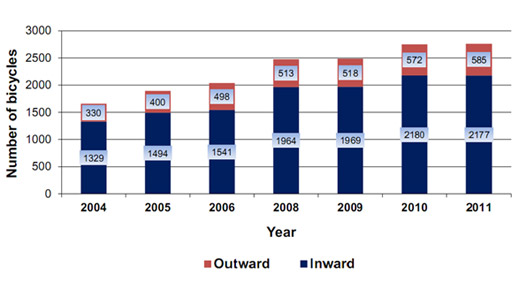
Source: Pedal Power ACT 2011
Freight, business and air travel
The total amount of freight transport in the ACT (489 million tonne-kilometres) is small compared to other states and territories (56,918 million tonne-kilometres in NSW, for example), even when population size is taken into account. The ACT's small physical size and lack of heavy industry, mining and agriculture are the main factors here. The second lowest road freight travel for an Australian state or territory is in the Northern Territory, where the tonne-kilometres travelled (2710 million) are more than five times that of the ACT (ABS 2011c).
Air travel has not been included in most systems of monitoring for reducing greenhouse gas emissions, but it is an important and growing source of greenhouse gas emissions globally. The Australia Institute (2008) estimated that flights to and from Canberra airport in 2005 were responsible for 117,000 tonnes of greenhouse gas emissions as carbon dioxide equivalent, or approximately 3% of total ACT emissions. If current plans for airport growth are successful, the Institute estimates that aviation will account for 9% of the Territory's total allowance under the ACT Climate Change Strategy by 2025, and that by 2050 aviation emissions will be twice as large as the ACT's total emissions allowance under the strategy.
Transport accessibility
Accessibility has been defined as "the proportion of households that can access main facilities and services (e.g. employment, education, health and cultural facilities) by public transport within 60 minutes" (Infrastructure Australia 2010:94). It is not possible to estimate how many of Canberra's residents enjoy this level of accessibility but it is worth noting that, outside peak period, many bus services only run every 60 minutes.
For people with disabilities, accessibility also means being able to travel to, and get onto and off, public transport vehicles. As indicated above, 43% of ACTION's current fleet is wheelchair-accessible, and the organisation plans to increase this to 55% by the end of 2012. However, as the ACT Auditor-General notes in her 2010 report on ACTION's services, accessible buses need to be complemented by accessible bus stops, and many bus stops lack facilities such as connecting footpaths (AG 2010:57-58).
The Auditor-General also noted that some parts of Gungahlin, Woden and Tuggeranong do not satisfy the objective in the Territory Plan that all residences should be within a 500 m walk of a bus stop; and rural areas such as Hall and Tharwa are not served by buses at all (AG 2010:59-60). However, it is estimated that currently around 95% of ACT residents live in areas that do meet this standard. The Auditor-General also expressed concern at unequal service frequencies between areas near to and far from shopping and business centres. Faraway suburbs often have higher proportions of disadvantaged residents (AG 2010:58). However, note that differing service frequency standards between inner and outer areas of Canberra are an expressly adopted policy under ACTION's draft Strategic Public Transport Network Plan (see Transport management, below).
Canberra's small suburban shopping centres may include a small supermarket and some have other services such as a pharmacy (ACTPLA 2009b,c). Local centres such as these are readily accessible, potentially reducing car use and encouraging active travel such as walking or cycling. It is important that transport and planning policies support the continuing viability of these centres.
Pressure indicators [top ]
Commuting and congestion
Time spent commuting (both in vehicles and between the vehicles and ultimate destinations) has impacts on the Territory's economy, as well as on the community's health and well-being and available leisure time.
It takes almost twice as long on average, door-to-door, to travel by public transport as by car in peak period in Canberra (ACT Government 2004); at other times, the difference is even greater. A number of ACTION bus services have become progressively slower over the years, particularly on the intertown high-usage routes. For example, in 1994 the intertown service from Belconnen to Tuggeranong was timetabled to take 44 minutes in peak period and 42 minutes on weekends. By contrast, in 2011 the Blue Rapid is allowed 62 and 64 minutes respectively for the trip, with the longer weekend time allowing the bus to service an additional local centre.
The costs and benefits of time spent travelling by walking or cycling are difficult to calculate, but the physical exercise involved in these modes of travel means the additional time should be seen as a net benefit.
Traffic congestion is difficult to measure and value because comparison with a non-congested scenario is always hypothetical, and because commuters are responsive to changes in the ease of their travel route, tending to travel further by car in low-congestion areas. The Bureau of Infrastructure, Transport and Regional Economics (formerly the Bureau of Transport and Regional Economics) has estimated the costs of congestion in Australian capital cities to be about $9.4 billion in 2005. It has projected that costs will increase to $20.4 billion by 2020 (BTRE 2007). The Bureau estimated congestion costs for Canberra to be $118 million in 2005, rising to around $200 million by 2020. Costs included time, additional fuel consumption and reduced air quality.
The ACT Government estimates that by 2030 about 80 km of roads in Canberra will suffer congestion in peak periods. The government expects the congestion to extend travel times, reduce productive work hours, and increase the health risks associated with air pollution and reduced amounts of physical activity and increased stress (ACT Government 2010b). However, Australian researchers have compared data from a range of world cities and have found no relationship between traffic speeds and overall time spent travelling, although the study found that higher traffic speeds were associated with less travel by active transport, and therefore less physical activity (Newman and Kenworthy 1999).
Impact indicators [top ]
Transport and human health impacts
Transport accidents
Road traffic crashes have a direct impact on people's health and often cause injuries and fatalities. Between 2000 and 2009 there were a total of 5220 casualties from motor vehicle accidents: 70% of the people required medical treatment, 27% required admission to hospital and 3% died (Figure 5).
Figure 5. Trends in traffic accident casualties, 2000-2009
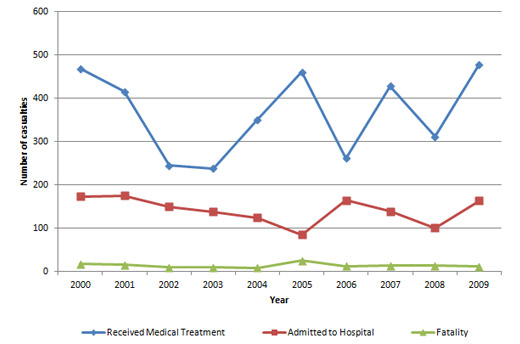
Source: TAMS 2010
The number of accidents involving fatalities has generally remained constant over this period, although the number of people requiring medical treatment has fluctuated considerably. As a small jurisdiction, ACT has crash statistics (particularly fatalities) that can be expected to vary from year to year. These fluctuations may also result from difficulties with reporting crashes involving injury, and from the recent introduction of new reporting systems.
Figure 6. Trends in traffic accident fatalities, 2002-2011
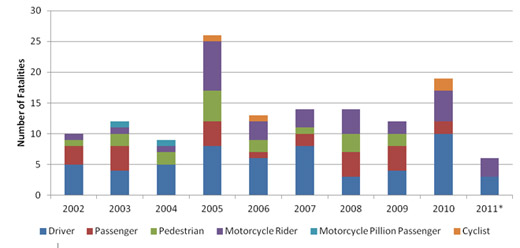
Source: BITRE 2011
* Data for 1 January to 30 June 2011
In 2007, transport accidents and injuries comprised 7% of all leading underlying causes of mortality for ACT residents (ACT Health 2010). From 1999-00 to 2007-08, there were 1308 admissions to hospital involving injury from bicycle accidents. Of these, nearly 80% involved males, with the most common age group being 10 to 19 years (ACT Health 2010). Between 2007 and 2011, 28 drivers, 12 passengers, 6 pedestrians, 17 motorcycle riders and 2 cyclists received fatal injuries in the ACT (Figure 6). The mode of travel involved in these fatalities, as well as the number of fatalities, varied significantly from year to year. However, motorcycle riders consistently represented a disproportionate share of fatalities; 26.2% while only accounting for 1.38% of total vehicle kilometres (ABS 2011a, BITRE 2011).
Physical inactivity
The health impacts of physical inactivity are discussed under the Urban quality indicator and include obesity, cardiovascular disease, diabetes and possibly some cancers (AIHW 2011). Walking and cycling are the healthiest modes of travel, and walking to and from public transport or car parks is also a form of incidental exercise. In one study (Infrastructure Australia 2010) it was found that, on average, Brisbane commuters walk an extra 2 km per day to and from public transport. A study from Victoria found that public transport users walk five times more than car drivers, who on average walk for only 8 minutes per day (VDoT 2009).
Air pollution
Common pollutants from car and truck transport include nitrogen dioxide (NO2), carbon monoxide (CO), sulphur dioxide (SO2), ozone (O3) and particulate matter (PM); these have substantial health effects, especially chronic and acute respiratory and cardiovascular disorders (AIHW 2011).
Long-term exposure to elevated concentrations of particulate matter has been found to increase mortality, and SO2, which is a by-product of diesel fuel, is also associated with increased mortality (AIHW 2011). Reducing air pollution may improve life expectancy and quality of life. For more information on the impacts of air pollution, see the Local air quality indicator cluster paper.
Greenhouse gas emissions and energy efficiency
Road transport is a significant source of greenhouse gas emissions, and passenger vehicles account for the largest proportion of these emissions. The prevalence of car use and the relative lack of heavy industry in the ACT mean that around 22% of the total greenhouse gas emissions in the ACT are transport related (ICRC 2011) - a significantly higher proportion than in other states and territories. Greenhouse gas emissions are closely associated with energy used, except where energy is produced from low-emissions sources such as hydroelectricity (in Tasmania, for example).
As discussed in the 2007-08 State of the Environment Report, local data regarding transport energy efficiency are poor, and therefore national and international information has been used to assess the efficiency of different transport modes in the ACT. The most efficient forms of transport are walking and cycling, which for practical purposes can be regarded as emissions-free. Public transport, such as buses, is usually more efficient than the passenger car (ABS 2010, ACT Government 2010b), but the efficiency depends on how many people are in each vehicle; one passenger travelling by bus will be associated with more emissions than the same passenger travelling by car. Bus occupancies need to rise beyond 4 before public transport is more efficient (calculated from IPCC estimates, using a car-occupancy rate of 1.5). ACTION bus average occupancy rates were calculated at 7.4 passengers per bus in 2007-08, the second-lowest figure nationally after Perth (6.9). The highest rate (15.8 passengers per bus) was in Brisbane, followed by Sydney (13.9) (BITRE 2009:Tables 2, 3). If "dead running" is included - because empty buses still produce emissions - ACTION bus occupancy rate is only 5.6 passengers, not far above the critical threshold of 4 passengers.
Over the last 50 years the average fuel economy of the Australian passenger car fleet has remained roughly constant; the average car used 11.3 L of fuel to travel 100 km in 2010, compared with 11.4 L at the time of the first survey in 1963 (ABS 2011c; Mees 2010:43). Engines have become more efficient but vehicles have not, because engine improvements have been offset by larger vehicle sizes (especially four-wheel-drives) and the addition of accessories such as air conditioning. While bus occupancies have been roughly stable for at least a decade, car occupancy rates continue to fall: the fastest-declining mode of travel on journeys to work in Canberra is as a passenger in a car (Mees, Stone and Sorupia 2007).
For more information on transport and greenhouse gas emissions, see the Emissions and Mitigation indicator cluster papers, in the Climate theme.
Response indicators [top ]
The 2007-08 ACT State of the Environment Report recommended that the Office of the Commissioner for Sustainability and the Environment should annually assess progress made in implementing the Sustainable Transport Plan (ACT Government 2004). In response, the ACT Government agreed to provide information on progress so that such an assessment could be made (OCSE 2009). This Transport indicator cluster paper provides the most comprehensive assessment of sustainable transport in the ACT since that agreement.
The ACT Government's actions in response to the environmental impacts of the transport system have two prongs: reducing emissions from individual vehicles through technological change, and shifting travel-to-work from the private car to less polluting modes.
Reducing emissions from individual vehicles
From 1 July 2010, new cars in Australia were required to comply with Euro 4 emission standards that lowered the maximum outputs allowed per car as carbon monoxide, hydrocarbons, oxides of nitrogen, and particulates. Euro 4 standards came into force for light diesel vehicles in 2007 and for heavy diesel vehicles in 2008. Australia is lagging behind the European Union, where tougher Euro 5 standards have been in place since 1 January 2011, but the adoption of the Euro 4 standard should gradually reduce local air pollution as the national car fleet is renewed, even if traffic volumes continue to increase.
The ACT Government has introduced Australia's first stamp duty discount scheme for fuel-efficient vehicles. The Green Vehicles Duty Scheme (Australian Government 2010) charges differential duty rates on new cars depending on the environmental performance of the vehicle. There are four categories, ranging from D (below-average performance, e.g. four-wheel-drives) to A (environmental leading-edge, e.g. the Toyota Prius), and vehicles in category A pay no duty. Over the first two years of the scheme's operation, the percentage of registrations in category A roughly doubled, from 2% to 4% of the total, creating a small overall improvement in the ACT vehicle fleet's performance. It is unclear if this improvement was a result of the scheme, or whether other factors (e.g. petrol prices, or environmental awareness) were more significant. The scheme is being reviewed by the ACT Government in late 2011.
Travelling by more sustainable modes: transport policies
The ACT Sustainable Transport Plan, released in 2004, sets out long-term strategic policy targets for improving the share of work trips made by sustainable modes of travel in the ACT (Table 5). Although these targets are a step in the right direction, it should be noted that the 2001 baseline used in the Sustainable Transport Plan was the lowest recorded since the census began, with the 2011 public transport target still lower than the 9.9% achieved in 1991 (ACTPLA 2009a:15).
Table 5. Sustainable Transport Plan targets: percentage of work trips by walking, cycling and public transport
| Mode | 2001 (%) | 2011 (%) | 2026 (%) |
|---|---|---|---|
| Walking | 4.1 | 6.0 | 7.0 |
| Cycling | 2.3 | 5.0 | 7.0 |
| Public transport | 6.7 | 9.0 | 16.0 |
| Total | 13.1 | 20.0 | 30.0 |
Source: ACT Government 2004
While these are targets against which to measure travel to work, they do not relate to the sustainability of the ACT's transport sector as a whole. It is possible for motor vehicle travel, and therefore greenhouse gas emissions and other emissions, to increase even if some work trips are shifted to sustainable modes. Targets and data inclusive of non-work trips would provide greater understanding of travel patterns, as well as direction for reductions in total transport sector emissions.
The 2007-08 State of the Environment Report recommended that the ACT Government amend the Sustainable Transport Plan to include greenhouse gas emissions, energy efficiency and/or carbon neutrality targets for the transport sector. Although the ACT Government agreed to this recommendation (OCSE 2009), there is no available evidence that it has been addressed within this reporting period. Outcome 6 of the Draft Sustainable Energy Policy 2010-2020, which was released in 2009, suggests that the travel-to-work targets will continue to provide the basis of the sector's emissions reductions, and no whole-of-sector emissions reduction targets are set out.
If, by 2020, the ACT is on track to meet a target of 30% of work journeys by modes other than car by 2026, it is calculated that the transport sector will (by 2020) have achieved a 10% reduction in emissions from business-as-usual levels (DECCEW 2009). However, in relation to 1990 levels, this would still represent an increase in transport-sector emissions of either 50% or 58%, depending on the incorporation of autonomous energy efficiency improvements into business-as-usual calculations5 (Heuris Partners 2010, ICRC 2011). This presents a key challenge if the legislated greenhouse gas emissions reduction targets of 40% by 2020, based on 1990 levels, are to be achieved without disproportionate reductions in other emission areas (for more information see the Mitigation indicator cluster, in the Climate theme).
In order to implement the Sustainable Transport Plan targets, the ACT Government intended to release a Sustainable Transport Action Plan for 2010-2016 in 2009. A draft of the plan was re-titled Transport for Canberra: 2011-2031; however, as of the end of this reporting period (30 June 2011) it is yet to be released for public comment. In the interim a number of individual initiatives have been undertaken, including construction of bus and transit lanes, installation of bike rails at bus stops, launch of the MyWay rechargeable ticketing system, and expanded park'n'ride facilities.
Although these initiatives are a step in the right direction, the total investment in sustainable transport options, particularly cycling and walking, is modest when compared to investment in car-based infrastructure. As of 30 June 2011, combined bicycle and walking paths comprised $48.8 million of the Territory and Municipal Services (TAMS) Directorate's $6.1 billion in infrastructure assets, while roads and bridges made up over $3 billion (TAMS 2011:61). In contrast the city of Copenhagen, which has a population of 500,000 and a significantly smaller built area, has over $792 million of existing cyclepath infrastructure assets, with an ongoing annual investment of $9 million (Infrastructure Australia 2009). Between 2001 and 2011, over $700 million has been invested in roads, parking and freight, with $300 million invested in public transport, and only $80 million in active travel options and infrastructure (ESDD 2011). As stated in a recent Infrastructure Australia report, those countries that have successfully increased cycling rates have: specific measureable policies; cross-integration of relevant government agencies; and have made major investments into cycling-related infrastructure and education (Infrastructure Australia 2009:2).
The TAMS Directorate exceeded its targets for construction of new on-road cycle paths and community paths (including off-road cycle paths) in 2008-09 (TAMS 2009). In 2009-10 and 2010-11, construction of on-road cycle paths fell short of the 50 km per year target by approximately 50%. However, construction of community paths again exceeded annual targets with 40 km and 54 km built in 2009-10 and 2010-11, compared to targets of 20 km and 35 km (TAMS 2010, 2011). Targets for constructing bus-priority lanes remained at a modest 1 km per year during the last three years of the reporting period. That target was met; however the length of transit lanes continues to represent less than 1% of the total road length in Canberra. If the ACT is to create a genuinely sustainable transport system, investment in, and construction of infrastructure for more sustainable travel options must be seriously reconsidered.
A Strategic Public Transport Network Plan (ACT Government 2011b) was released during the reporting period, but many of its components (for example, development of a City West Interchange and a Frequent Service Network for higher-density areas), have not yet been implemented, and the network is not intended to be completed until 2031. It therefore remains to be seen whether shifting to a two-tier network in which denser areas receive frequent bus services (every 15 minutes or better), while most of Canberra receives hourly bus services, will lead to a return to higher public transport commuter levels. Notably, the high usage of buses in 1991 was achieved with services every 15 minutes in peak periods and 30 minutes in off-peak periods to nearly all built up areas, not just those with high residential densities.
The 2007-08 State of the Environment Report recommended development of an ACT Walking Plan to ensure that walking as a mode of transport was encouraged wherever possible. One response has been that in 2010 the ACT signed up to the International Charter for Walking. More significantly, in 2009 a Cycling and Walking Feasibility Study was completed for the ACT Government, identifying priority actions that should help Canberra people achieve the ACT's 2011 and 2026 cycling and walking targets (SKM 2009). These included:
- cycling training and education programs;
- standardisation, mapping and linking of cycling and walking infrastructure;
- connectivity with public transport for multi-modal travel;
- provision of cyclist facilities (such as showers and secure lockers) at all employment centres;
- marketing programs; and
- improved data collection and policy coordination.
It is recommended that all of these components be incorporated into the upcoming Transport for Canberra plan.
Although non-government research indicates that more people may be cycling, the apparent reduction in public transport patronage, coupled with the increased distances now being travelled by car, are particularly problematic if the Sustainable Transport Plan travel-to-work targets are to be achieved. These observations suggest that the transport policies operating to date may not be sufficient to reduce car-based travel overall, for work and non-work trips.
Figure 7. ACTION expenditure and kilometres travelled, 2002-03 to 2010-11
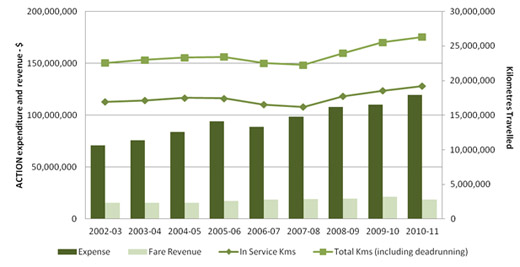
Source: TAMS
Over the last three reporting periods, revenue raised from public transport has remained static whereas expenditure relative to revenue raised has increased significantly. In 2010-11, revenue raised from bus fares was only $18.5 million, relative to total expenses of almost $120 million (Figure 7). Although the increased in-service kilometres travelled is a positive sign, the amount of "dead running" (out-of-service travel) has increased disproportionately, to over 27% of the total distance travelled in 2010-11 (TAMS 2011a).
An assessment of the new ACTION network (introduced at the end of the last reporting period) was to have been made in this report, but problems with bus ticketing machines, changes to eligibility for fares for concession, student and free travel, and the transfer to the new MyWay ticketing system have meant that accurate detailed data are not available for the current reporting period. For the next reporting period, a more comprehensive assessment of the new network should be possible using MyWay data and data from the 2011 census. It should then be possible to assess whether the network has allowed the ACT to meet its travel-to-work public transport targets.
Travelling by more sustainable modes: land-use and transport planning
Land use and transport policies are major influences on the forms and patterns of use of transport within any given area. Planning and transport policies are not always aligned, which can lead to contradictory outcomes. For example, the Central City Area Action Plan (ACT Government 2010a) combines conflicting goals, namely to: reduce car reliance; provide 17,000 publicly accessible parking spaces (currently 12,000); and complete road network improvements. The most recent ACT Government Infrastructure Plan continues to promote car travel over other transport options, allocating $144.5 million between 2011-12 and 2014-15 for major road projects and only $4 million for major public transport improvements, of which most is allocated to feasibility and design work (ACT Government 2011a:82).
The central land-use planning target for the ACT under the current Canberra Spatial Plan is promotion of a more compact city, with residential intensification occurring within 7.5 km of the city centre, and other development restricted to a 15 km radius. Higher populations in areas close to the CBD and town centres have led to significantly more people walking, but there is no evidence of similar effects from increased housing density in other less central locations, such as Gungahlin. Additionally, data on the influence of population or housing densities on usage of public transport in cities indicate that density is not necessarily the most significant factor (Currie 2008; ACT Government 2010c). Brisbane, as noted above, has Australia's highest bus occupancy rates; its loadings are more than double those in Canberra, and full-fare-paying patronage per bus is around four times the level in Canberra. Yet Brisbane has the lowest gross population density in Australia; the figure being around 15% below that of Canberra (see the Urban quality indicator for more information).
The Canberra Spatial Plan also encourages growth in Civic and the town centres, and along a series of north-south and east-west transport corridors. These corridors include many locations for which the car is currently the most common choice of transport, such as Hume (the most car-intensive destination in Figure 2, with an effective share of zero workers using sustainable transport) and Canberra airport. The growth of employment and retailing in airport-related business parks is also of particular concern, because people are more likely to travel there by car than if these parks were in town centres or Civic. If sustainable transport policy is to be effective, land-use planning must encourage employment and other major Canberra destinations to be located in Civic and the town centres, and continue to encourage diverse housing options, including higher-density housing, to be developed within walking distance of these centres (ACTPLA 2009:18-21). This approach should be included in the new ACT Planning Strategy, which is currently under development.
In 2010-11, the ACT Government began integrated studies into transport and land use in the Erindale-Tuggeranong corridor. The outcome of those studies is likely to assist in better understanding of opportunities to integrate transport and land-use. New housing developments planned for Molonglo, in the west-central area of Canberra, and East Lake on Lake Burley Griffin, are also being designed with sustainable transport as a focus from the outset of the planning process. For example, the main local and group centres in the Molonglo Valley will be located adjacent to the major transit corridor of the development, to create easy access for residents. Park'n'ride, bike'n'ride, and cycle and pedestrian infrastructure are also being planned early in the development process, to make sustainable travel choices the easy option for these new residential areas.
Land-use policies that support people to use public transport will work more effectively if backed by parking policies that discourage use of private cars. The 2007-08 State of the Environment Report noted that a Draft ACT Parking Strategy had been released in March 2007, and recommended that it be finalised and implemented. The strategy aimed to discourage parking on both ACT Government land and in the Parliamentary Triangle (in partnership with the Australian Government). The ACT Government agreed to this recommendation, however to date no ACT Parking Strategy has been released. The ACT Government has increased parking charges in Civic and in some town centres, but substantial free parking is provided in private business parks, for short-stay in town centres and by the Australian Government. An important aspect in achieving more sustainable transport outcomes in the ACT will be a commitment to greater cooperation by the Australian Government.
Footnotes [top ]
1. The small sample size for this survey means that the results for the ACT, which has less than 2% of Australia's population, have a high margin of error.
2. Darwin is commonly excluded from ABS capital city comparisons because of its significantly smaller population.
3. The suggestion in the 2009 report Employment Location in Canberra, of a 10-fold increase in the share of Turner residents walking to work (ACTPLA 2009a:18) appears to be based on a data error.
4. Not including Darwin which is commonly excluded from ABS capital city comparisons because of its significantly smaller population.
5. Calculations based on ICRC transport emissions data from the 2009 Greenhouse Gas Emissions Inventory (ICRC 2011) and ACT Government-commissioned research into existing policy baseline projections to 2050 (Heuris Partners 2010).
References [top ]
ABS 2007. Census of Population and Housing Fact Sheets. Cat.No. 2914.0 - 2006. Australian Bureau of Statistics. Australian Government. Canberra. http://www.abs.gov.au/AUSSTATS/abs@.nsf/DetailsPage/2914.02006?OpenDocument (accessed 15/6/11)
ABS 2008a. Australian Social Trends, 2008. Cat.No. 4102.0 Australian Bureau of Statistics. Australian Government. Canberra. http://www.abs.gov.au/AUSSTATS/abs@.nsf/Lookup/4102.0Chapter10102008 (accessed 20/9/11)
ABS 2008b. Canberra: A Social Atlas, 2006 Census of Population and Housing. Cat.No. 2030.8 . Australian Bureau of Statistics. Australian Government. Canberra. http://www.abs.gov.au/AUSSTATS/subscriber.nsf/log?openagent&20308_2006.pdf&2030.8&Publication&F084CC2518A2F7C3CA25740E0079DE65&&2006&17.03.2008&Latest (accessed 11/7/11)
ABS 2009. Environmental Issues: Waste Management and Transport Use, Mar 2009. Cat.No. 4602.0.55.002. Australian Bureau of Statistics. Australian Government. Canberra. http://www.abs.gov.au/ausstats/subscriber.nsf/log?openagent&4602055002_Mar%202009.pdf&4602.0.55.002&Publication&3E3CECBBAC078860CA257673001C024B&&Mar%202009&09.12.2009&Latest (accessed 21/9/11)
ABS 2010. Australia's Environment Issues and Trends. Special issue: Climate Change. Cat.No. 4613.0. Australian Bureau of Statistics. Australian Government. Canberra. http://www.ausstats.abs.gov.au/Ausstats/subscriber.nsf/0/41D729B432E03FA0CA2576B800164E89/$File/46130_2010.pdf (accessed 15/8/11)
ABS 2011a. Motor Vehicle Census, Australia, 31 Mar 2010. Cat.No. 9309.0. Australian Bureau of Statistics. Australian Government. Canberra. http://www.abs.gov.au/AUSSTATS/subscriber.nsf/log?openagent&93090_31%20Mar%202010.pdf&9309.0&Publication&03CFF66BA0471A68CA257829001168D6&&31%20Mar%202010&23.03.2011&Latest (accessed 17/11/11)
ABS 2011b. Regional Population Growth, Australia, 2009-10. Cat.No. 3218.0. Australian Bureau of Statistics. Australian Government. Canberra. http://www.abs.gov.au/AUSSTATS/abs@.nsf/DetailsPage/3218.02009-10?OpenDocument (accessed 21/11/11)
ABS 2011c. Survey of Motor Vehicle Use, Australia, 12 months ended 31 October 2010. Cat.No. 9208.0. Australian Bureau of Statistics. Australian Government. Canberra. http://www.abs.gov.au/AUSSTATS/subscriber.nsf/log?openagent&92080_12%20months%20ended%2031%20october%202010.pdf&9208.0&Publication&4576F71CCF2E9F65CA2578F4001E5E98&&12%20months%20ended%2031%20October%202010&23.08.2011&Latest (accessed 21/11/11)
ACT Government 2004. Sustainable Transport Plan. Canberra. http://www.tams.act.gov.au/__data/assets/pdf_file/0010/167941/Sustainable_Transplan_Plan.pdf (accessed 18/11/11)
ACT Government 2010. Making Walking Count - Canberra. SKM. Canberra. http://www.transport.act.gov.au/references-docs/Making%20Walking%20Count.pdf (accessed 3/11/11)
ACT Government 2010a. Canberra City Area Action Plan 2010-2016. Canberra. http://www.laps.act.gov.au/__data/assets/pdf_file/0011/161867/Canberra_City_Area_Action_Plan_2010-2016.pdf (accessed 2/11/11)
ACT Government 2010b. Time to Talk: Canberra 2030 - Getting Around. Canberra. http://timetotalk.act.gov.au/files/download/?id=158 (accessed 5/7/11)
ACT Government 2010c. Time to Talk: Outcomes report. Canberra. http://timetotalk.act.gov.au/files/download/?id=147 (accessed 23/9/11)
ACT Government 2011a. Infrastructure Plan 2011-2021. Canberra. http://www.cmd.act.gov.au/__data/assets/pdf_file/0013/220306/infrastructureplan2011.pdf (accessed 23/8/11)
ACT Government 2011b. Public Transport Planning: Strategic Public Transport Network Plan. Canberra. http://www.transport.act.gov.au/public_transport_planning.html (accessed 23/10/11)
ACT Health 2010. Chief Health Officer's Report. ACT Government. Canberra. http://www.health.act.gov.au/c/health?a=sendfile&ft=p&fid=1285049820&sid= (accessed 18/11/11)
ACTION 1992. Annual Report 1991-92. ACT Internal Omnibus Network. ACT Government. Canberra.
ACTPLA 2007. The Canberra Spatial Plan - 1C New Structure. ACT Planning and Land Authority. Act Government. Canberra. http://apps.actpla.act.gov.au/spatialplan/1_future/1C_new_structure/index.htm (accessed 1/5/11)
ACTPLA 2009a. Employment Location in Canberra. ACT Planning and Land Authority. Canberra. http://www.actpla.act.gov.au/__data/assets/pdf_file/0004/14269/Employment_distribution.pdf (accessed 18/11/11)
ACTPLA 2009b. Retailing in Canberra. ACT Planning and Land Authority. Canberra. http://www.actpla.act.gov.au/__data/assets/pdf_file/0007/15838/Retailing_in_Canberra.pdf (accessed 21/10/11)
ACTPLA 2009c. Supermarket Retailing in the ACT. ACT Planning and Land Authority. Canberra. http://www.actpla.act.gov.au/__data/assets/pdf_file/0006/15837/Retailing_in_the_ACT.pdf (accessed 9/11/11)
AG 2010. Delivery of ACTION Bus Services. ACT Auditor General's Office. Canberra. http://www.audit.act.gov.au/auditreports/reports2010/Final%20ACTION%20report%20for%20website%2026%20Aug.pdf (accessed 15/9/11)
AIHW 2011. Health and the Environment: a Compilation of Evidence. Australian Institute of Health and Welfare. Australian Government. Canberra. http://www.aihw.gov.au/publication-detail/?id=10737418534 (accessed 24/11/11)
Australia Institute 2008. Aviation and Greenhouse Gas Emissions in the ACT. Research Paper 50. Canberra. https://www.tai.org.au/file.php?file=web_papers/WP109.pdf (accessed 6/8/11)
Australian Government 2010. Green Vehicle Guide. Canberra. http://www.greenvehicleguide.gov.au/GVGPublicUI/Home.aspx (accessed 26/5/11)
BITRE 2009. Urban Public Transport: Recent Bus Statistics, Information Sheet 33. Bureau of Infrastructure, Transport and Regional Economics. Australian Government. Canberra. http://www.bitre.gov.au/publications/45/Files/BITRE_IS33.pdf (accessed 16/8/11)
BITRE 2011. Fatal Road Crash Database. Bureau of Infrastructure, Transport and Regional Economics. Australian Government. Canberra. http://www.infrastructure.gov.au/roads/safety/road_fatality_statistics/fatal_road_crash_database.aspx (accessed 21/11/11)
BTRE 2007. Estimating Urban Traffic and Congestion Cost Trends for Australian Cities, Working Paper 71. Bureau of Transport and Regional Economics. Australian Government. Canberra. http://www.btre.gov.au/publications/56/Files/wp71.pdf (accessed 8/7/11)
Currie, G. 2008. Sustainable Transport and Canberra - Challenges and Opportunities. Supplementary paper for the ACTPLA Transport Workshop, 24 September. Canberra. http://www.actpla.act.gov.au/__data/assets/pdf_file/0015/10383/Graham_Currie_paper.pdf (accessed 21/6/11)
DECCEW 2009. Draft Sustainable Energy Policy 2010-2020. Department of the Environment, Climate Change, Energy and Water. ACT Government. Canberra. http://www.environment.act.gov.au/__data/assets/pdf_file/0006/174687/Draft_Sustainable_Energy_Policy_FINAL.pdf (accessed 7/7/11)
ESDD 2011. Transport for Canberra 2011-2031- Draft for Public Comment. Environment and Sustainable Development Directorate. ACT Government. Canberra. http://www.timetotalk.act.gov.au/storage/Transport%20Policy%2014%20October%20Full.pdf (accessed 10/11/11)
Heuris Partners 2010. ACT Greenhouse Gas Emissions: Existing policy baseline projections to 2050 - Research Report. Canberra. http://www.environment.act.gov.au/__data/assets/pdf_file/0008/187217/ACT_Greenhouse_Gas_Emissions.pdf#ACT%20Greenhouse%20Gas%20Emissions (accessed 17/10/11)
ICRC 2011. ACT Greenhouse Gas Inventory Report for 2008-09. Independent Competition and Regulatory Commission. Canberra. http://www.icrc.act.gov.au/__data/assets/pdf_file/0009/235719/ACT_Greenhouse_Gas_Inventory_Report_2009_Final.pdf (accessed 11/10/11)
Infrastructure Australia 2009. Cycling Infrastructure for Australian Cities. Major Cities Unit. Australian Government. Canberra. http://www.infrastructureaustralia.gov.au/publications/files/Cycling_Infrastructure_Background_Paper_16Mar09_WEB.pdf (accessed 17/11/11)
Infrastructure Australia 2010. State of Australian Cities 2010. Major Cities Unit. Australian Government. Canberra. http://www.infrastructureaustralia.gov.au/publications/files/MCU_SOAC.pdf (accessed 18/4/11)
Mees, P. 2010. Transport for Suburbia: Beyond the Automobile Age. Earthscan. London
Mees, P., Sorupia, E. & Stone, J. 2007. Travel to Work in Australian Capital Cities. 1976-2006: An Analysis of Census Data. Australasian Centre for the Governance and Management of Urban Transport (GAMUT). http://www.abp.unimelb.edu.au/gamut/pdf/travel-to-work.pdf (accessed 18/6/11)
Newman, P. and Kenworthy, J. 1999. Sustainability and Cities. Island Press. Washington DC
OCSE 2009. Annual Report 2008-09. ACT Office of the Commissioner for Sustainability and the Environment. Canberra. http://www.environmentcommissioner.act.gov.au/__data/assets/pdf_file/0009/169290/OCSE_Annual_Report_2008-09_web.pdf (accessed 18/9/11)
Pedal Power ACT 2011. Cycling Cordon Count: Civic and Acton, 2011 Update. Canberra. http://www.pedalpower.org.au/documents/cordon%20count%20report%202011.pdf (accessed 16/11/11)
SKM 2009. Cycling and Walking Strategy Feasibility Study. Sinclair Knight Merz. Canberra. http://www.transport.act.gov.au/references-docs/SKM,%202009,%20ACT%20Government%20Cycling%20and%20Walking%20Stategy%20Feasibility%20Study.pdf (accessed 3/6/11)
Stone, J. and Mees, P. 2011. Spatial Distribution of the Journey to Work by Sustainable Modes in Australian Cities. 34th Australasian Transport Research Forum. Adelaide. http://www.atrf11.unisa.edu.au/Assets/Papers/ATRF11_0042_final.pdf (accessed 21/11/11)
TAMS 2007. Draft ACT Parking Strategy. Territory and Municipal Services. ACT Government. Canberra.
TAMS 2010. 2009 Road Traffic Crashes in the ACT, Traffic Management and Safety. Territory and Municipal Services. ACT Government. Canberra. http://www.tams.act.gov.au/__data/assets/pdf_file/0014/190031/ACT_CRASH_Report_2009.pdf#ACT%20Crash%20Statistics%202009 (accessed 14/10/11)
TAMS 2011. Annual Report 2010-2011 Volume 2. Territory and Municipal Services. ACT Government. Canberra. http://www.tams.act.gov.au/__data/assets/pdf_file/0017/233180/Volume_2_10-11.pdf (accessed 21/10/11)
Urban Services 2000. ACT Parking and Vehicular Access Guidelines. Department of Urban Services. ACT Government. Canberra. http://www.legislation.act.gov.au/ni/2002-246/20020404-2972/pdf/2002-246.pdf (accessed 8/8/11)
VDoT 2009. Victorian Integrated Survey of Travel and Activity. Department of Transport. Victorian Government. Melbourne
Other data sources
In addition to these published reports, data for this paper was also sourced from:
- ACT Department of the Environment, Climate Change, Energy and Water (DECCEW) - now Environment and Sustainable Development Directorate (ESDD)
- ACT Department of Territory and Municipal Services (TAMS) - now Territory and Municipal Services Directorate (TAMSD)
- Australian Bureau of Statistics (ABS)
- Australian Year Book
- Department of Infrastructure and Transport
- European Commission, Enterprise and Industry
- Statistics Canada
Annex [top ]
Table A1. Proportions of various modes of travel used to access major employment centres, ACT 2006
| Centre | Car (%) | Bus (%) | Walk (%) | Bicycle (%) |
|---|---|---|---|---|
| City | 71.0 | 18.3 | 6.0 | 3.1 |
| Woden Town Centre (core) | 77.0 | 13.5 | 6.2 | 1.9 |
| Belconnen TC (core) | 79.2 | 10.9 | 6.1 | 2.6 |
| Tuggeranong TC (core) | 85.1 | 8.9 | 2.5 | 2.3 |
| Gungahlin (suburb) | 87.7 | 6.6 | 3.8 | 1.5 |
| Parkes | 85.0 | 7.6 | 2.4 | 3.9 |
| Russell | 88.1 | 4.7 | 2.4 | 2.4 |
| West Deakin | 86.6 | 3.9 | 1.6 | 1.3 |
| Fyshwick | 95.5 | 2.2 | 0.5 | 0.4 |
| Mitchell | 93.9 | 2.7 | 0.4 | 1.2 |
| Hume | 98.6 | 0.0 | 0.0 | 0.2 |
| Majura | 90.7 | 3.7 | 1.7 | 1.6 |
| Bruce | 88.5 | 4.0 | 3.1 | 2.9 |
Source: ACTPLA 2009a


Share this page: