


ACT State of the Environment Report 2011
Accurate, timely & accessible information for the community regarding the condition of the environment, underlying pressures, and sustainability trends.
THEME: People
Indicator cluster: Urban quality
Download: Indicator cluster: Urban quality.pdf
The indicators for this cluster are:
- Urban density (C) - covers urban density across the ACT and changes over time;
- Housing types (C) - includes housing stock, type, and size;
- Community facilities (C) - number, type and use of community facilities;
- Open space, amenity and recreation areas (C) - includes open space, parks and recreational areas in terms of area, distribution, standards, use and distance to access;
- Urban trees (C) - the number and distribution of urban trees;
Condition indicators (C) present data that tell us the state of the environment at any particular time.
Pressure indicators (P) present data about the main human activities that could potentially adversely affect the condition of the environment.
Impact indicators (I) present data on the effect that environmental changes have on environmental or human health.
Response indicators (R) present data about the main things we are doing to alleviate pressures, or to improve the condition of the environment.
- Urban development (P) - greenfield and infill split;
- Housing demand (P) - housing demand, changes in household composition and other social influences on housing type and size;
- Community safety (P) - safety statistics relating to people and property, and perceptions of safety;
- Noise complaints (P) - details on type and number of noise complaints;
- Urban areas and human health impacts (I) - includes obesity rates and other urban health problems;
- Green star development (R) - type, number and location of green star development;
- Inner city and higher density developments (R) - includes diversification of town centres;
- Efficiency of development (R) - includes commentary on efficiency of development; and
- Open space management (R) - covers management of open space and recreational areas, including connectivity, accessibility and quality.
Summary [top  ]
]
Residential development in Canberra is still characterised predominantly by single detached houses, although the housing mix is becoming more diversified with many townhouses and apartments being built recently. In the past 20 years the average residential dwelling size has increased, while the average number of occupants has decreased. The ageing population, together with a growth in one-person households, is increasing the demand for a range of types of housing in the ACT.
The ACT offers a range of community and recreational facilities, and compared with other major Australian cities it maintains a large network of open space, recreation areas and urban trees. Despite this, the ACT, like many other Australian communities, is experiencing human health problems such as an increase in obesity which may be, in part, related to the form of the city and the way that interacts with people's lifestyles.
Challenges facing the ACT Government in maintaining the urban quality of Canberra include its ageing population, and the relatively high costs of fuel and of developing land and housing, along with the effects of warming temperatures, lower rainfall and more extreme weather events predicted to accompany climate change. All levels of government in Australia are increasingly facing similar challenges in managing cities. There is an appreciation that the planning and organisation of cities affects the national economy, as well as the social well-being of cities' residents and the environment in general.
The Council of Australian Governments (COAG) has established 9 criteria for future strategic planning of capital cities, and it is developing measures for use in reporting achievements. They will guide the ACT Government's management of Canberra's urban form during the next State of the Environment reporting period.
Introduction [top ]
The ACT is approximately 2352 km2 in area, with about one quarter of the land area under urban development (ACT Government 2010). This indicator cluster considers the provision and maintenance of land for urban purposes, including residential and commercial land, as well as facilities for the amenity and wellbeing of residents and workers, such as open space and recreation areas, community facilities and urban trees. Urban quality also refers to the sustainability of urban growth, including the efficiency of urban development.
Condition indicators [top ]
Urban density
The density of housing in a city affects the city's sustainability and liveability. When residential areas are near to employment, shopping and other services and infrastructure, people tend to do more walking and cycling and the amount of land required to support a growing population reduces. Increased housing density compared to that in suburbs comprising single detached houses generally means there will be a wider choice of types of housing available, such as townhouses and apartments as well as free-standing houses. That mix can generally better meet the changing needs of the population. The amenity of suburbs is maintained through including adequate green space, urban trees and sustainable transport infrastructure. The 2007-08 ACT State of the Environment Report recommended continuing to implement the Canberra Spatial Plan, particularly focusing on achieving higher densities and maintaining ecological corridors.
The several methods for calculating urban density do not necessarily give comparable figures, and that needs to be noted when making comparisons across locations or when looking at trends through time.
Gross population density is calculated by dividing the area of a given tract of land by the known population of that area.
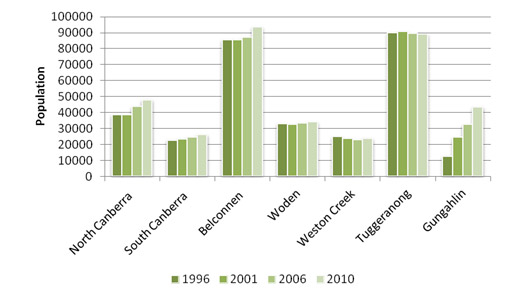
Between 2001 and 2010, the gross population density of Canberra increased from 12.9 to 13.5 persons per hectare (ACTPLA 2011a). In North Canberra, the population density increased in all suburbs with the most marked increases being in Braddon and Turner, reflecting urban renewal and the redevelopment of commercial land for residential and mixed use. In contrast, districts such as Weston Creek and Tuggeranong experienced a gradual decline in population (Figure 1), reflecting an ageing demographic and shrinking household sizes.
Figure 1. District population change, 1996-2010
Source: ACTPLA 2007, 2011a
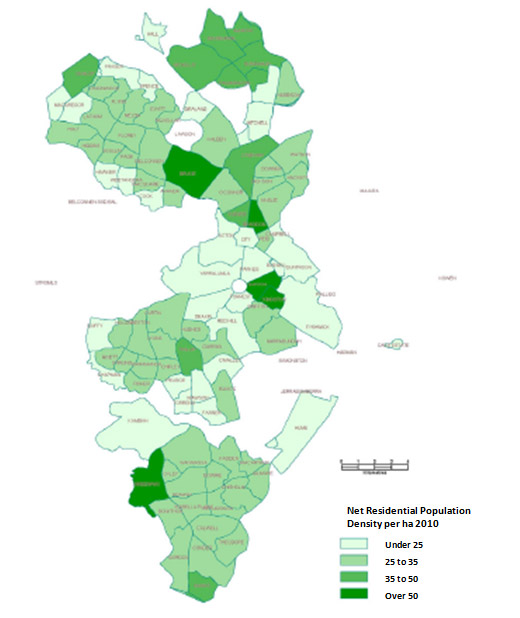
Net residential density is a measure of the population density in the residential areas only. For Canberra, ACTPLA calculates the net residential density at 29.2 persons per hectare in 2010, based on ABS data. Again, there were relatively high residential population densities in the town centres and the suburbs of Bruce, Kingston and the suburbs along Northbourne Avenue, reflecting the shift towards redeveloping commercial land for residential uses and creating higher density developments around transport corridors and existing infrastructure. Figure 2 illustrates the net population by suburb for Canberra in 2010.
Figure 2. Net residential population density in Canberra in 2010
Source: ACTPLA 2011a
Using a different method, the ABS also produces density figures for 'urban centres' at each census (ABS 2006:32-33). The ABS figures enable comparisons between different Australian cities, although the ABS method results in slightly lower density estimates than the ACTPLA method (Table 1).
Table 1. Comparison of densities for Australian cities, 2006
| City | Population | Density (per ha) |
|---|---|---|
| Canberra | 368,129 | 10.8 |
| Sydney | 4,119,189 | 20.4 |
| Melbourne | 3,592,592 | 15.7 |
| Brisbane | 1,763,129 | 9.2 |
| Perth | 1,445,073 | 12.1 |
| Adelaide | 1,105,839 | 13.8 |
| Hobart | 200,524 | 10.3 |
| All cities | 12,594,475 | n/a |
Source: based on Mees, Sorupia and Stone 2007
Note: the ABS defines urban land to include industrial as well as residential areas, unlike the ACTPLA definition
Housing types
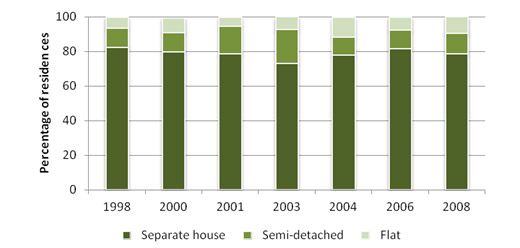
Separate houses remain the dominant form of residential dwelling in the ACT (Figure 3). Between 1991 and 2011, the average size of houses in ACT increased from 149 m2 to 213 m2. During the same period the dwelling occupancy (average number of persons per dwelling) continued to decrease with an average occupancy rate now of 2.54 people (CMD 2010b).
The ACT provides twice as much public housing as the national average; public housing is the major source of low-cost rental stock. Compared to other major Australian cities, Canberra has the lowest rate of homelessness (0.4% of the population at the 2006 census). However, the rate of homelessness rose marginally from 40 to 42 people per 10,000 between 2001 and 2006 (CMD 2010b).
Figure 3. Types of private dwellings in the ACT, 1998-2008
Source: ABS 2010a
Note: Components do not total 100% because "other" dwellings are not included
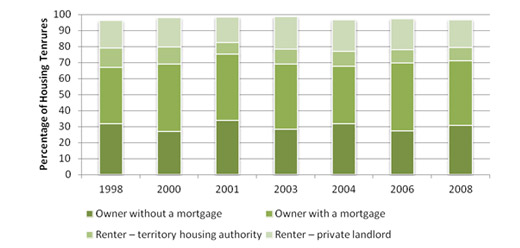
In the ACT, home ownership rates are generally higher on the outskirts of Canberra than in areas closer to the city centre (ABS 2008). Between 1998 and 2008 the proportion of households renting in Canberra declined. Rates of outright ownership also declined between 2001 and 2008, and home purchase rates increased (Figure 4).
Figure 4. ACT housing tenure, 1998-2008
Source: ABS 2010a
Note: Components to not total 100% because "other renters" and those with "other tenure" are not included
Community facilities
In 2011, 1409 ha in the ACT were designated for community facilities by the Territory Plan; that amounted to 0.5% of the total land use in the ACT (ACTPLA 2005 cited in ACTPLA 2011a). Community facilities play an important role in bringing people together, developing social capital, maintaining quality of life and community wellbeing, and enhancing the skills and resilience essential to strong communities. They can encompass a wide range of sectors including education, health, culture and recreation. Community facilities also provide venues for service delivery, special events and meeting spaces.
Over the reporting period the ACT Government undertook a number of building and enhancement projects including 15 new social housing developments. These were jointly funded through the national Economic Stimulus Plan (Social Housing Initiative) (Australian Government 2011) and provided 421 dwellings. In addition, photovoltaic cells were installed at 20 community facilities.
At 30 June 2011 there were 84 schools in the ACT (DET 2011). As part of the ACT Government's Towards 2020: Renewing our Schools program (DET 2006), 23 government schools and preschools either closed at the end of 2006 or over the next two years (Purdon 2008). The future use of most of the school sites has been determined. Many remain owned by the ACT Government and are now used for community purposes. For example, Flynn, Melrose and Cook primary schools are now used as community hubs, Village Creek (Kambah) Primary has been converted to a health hub, and Rivett Primary houses aged-care and supportive-housing facilities. A small number, including Giralang and McKellar preschools, have been sold for use by community organisations.
From 1996 to 2011 the ACT has had a steady increase in the number of licensed long-daycare childcare centres: from 80 centres and 3952 places in 1998, to 126 centres and 7766 places in 2011. The ACT has the highest percentage of children aged 0-12 using childcare, of any jurisdiction. In June 2005, 58.2% of children aged 0-12 in the ACT used childcare compared with the national average of 45.8%.
The West Belconnen Child and Family Centre, another ACT Government project, jointly funded by the Australian and ACT governments, opened on 2 May 2011. The Centre is an example of incorporating environmental sustainability features into new community facilities. Designed with community input from children and Aboriginal and Torres Strait Islander families, the Centre features a rainbow serpent, an Indigenous Garden with yarning pit, and mosaic art by local artist Dira Horne. The Centre also features a Sustainable Energy Showcase that includes five solar panels, a small wind turbine, green walls and rainwater tanks.
The ACT Social Plan (CMD 2011) recognises there are a number of key challenges with future provision of community facilities, including more flexible use of schools, libraries and civic places, and investing in community infrastructure that promotes connection and allows for diverse activities. Since the earlier 2004 Social Plan was released, the ACT has continued to allocate more than two-thirds of all ACT Government expenditure to human and community services (CMD 2011).
The ACT Government has also arranged to compensate for its services being used by people who live in NSW but work in the ACT. It is developing more detailed data in this area so it can plan for and manage these demands on services and infrastructure.
Open space, amenity and recreation areas
A city's environment, including its liveability and amenity, depends in considerable measure on its green infrastructure. Green infrastructure is the city's natural features such as vegetation, parks, waterways and assets, designed to help improve the quality of the urban environment. The health benefits provided by green infrastructure include positive physical, social, mental and spiritual health outcomes. Canberra enjoys an extensive network of reserves connected by open spaces and urban trees. Open space can be urban open space, wilderness areas, national park and reserves, and water catchments.
As in previous reporting periods, conservation remains the main land use in the ACT with over 50% of the ACT consisting of national park, nature reserves and water catchments including the Namadgi National Park, Tidbinbilla Nature Reserve and Cotter River water catchment area. Urban open space and Canberra Nature Park comprise less than 3% and 4% respectively of the ACT's total land area (PCL 2009).
Canberra Nature Park areas are primarily native grass and bushland, and also the district and town parks, local parks and lakes and ponds. These spaces are important to the health and wellbeing of Canberra residents and their sense of place. Compared to some other Australian cities, the area of nature reserve or conservation area per person in Canberra (340 m2) is high (Figure 5). That figure does not include Namadgi National Park or Tidbinbilla Nature Reserve, nor the Googong Foreshores. However, if all park areas are included, the area of nature or conservation reserve rises to around 794 m2 per resident, compared (on the same basis) with 61 m2 in Melbourne and 133 m2 in Brisbane City (OCSE 2011a).
Canberra's area of parks and open space is a major asset, as well as a management challenge (OCSE 2011b). The urban open-space system contributes to Canberra's image as the bush capital and provides an attractive environment and opportunities for active and passive recreation. It also performs a utilitarian function as community paths, stormwater drainage and minor public utilities (ACTPLA 2008).
Figure 5. Area of nature reserve or conservation reserve per person
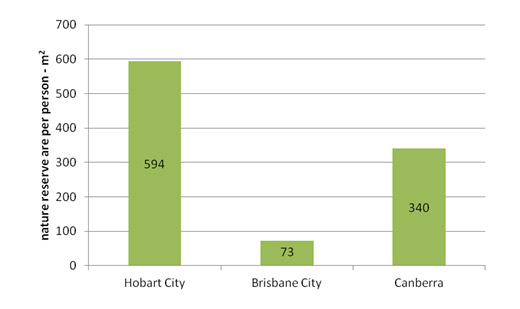
Source: OCSE 2011b
Note the figure for Canberra does not include Namadgi National Park or Tidbinbilla Nature Reserve, nor Googong Foreshores
Recreational areas include facilities such as sports grounds and swimming pools. The ACT Government is responsible for the maintenance of sports grounds distributed across about 80 locations throughout Canberra, in nearly every suburb. Facilities range from small neighbourhood ovals about 2 ha in area with one or two marked fields, usually adjoining primary schools, through to large district playing fields up to 12 ha with 10 or more marked fields. Convenient access to these facilities for residents and visitors is a major factor in the ACT's high levels of participation in physical activity.
During the reporting period the sports grounds have been in fairly consistent use except when affected by factors such as weather, water restrictions and changes to sporting clubs. Since the lifting of water restrictions in late 2010, all the major sports grounds are in full use again; a small number remain as low maintenance sports grounds.
The National Arboretum Canberra has been progressively established since 2005. The area (250 ha) was formerly a pine plantation. Since the pines were destroyed by bushfires in 2001 and 2003 the area has been transformed into a mosaic of 100 forests of rare and endangered tree species and other tree species that have particular ethnic, botanical or symbolic values (EDD 2011). The ACT Government has spent or committed approximately $50 million in capital since 2004-05 to this arboretum, which overlooks Lake Burley Griffin and the Parliamentary Triangle. The aim is to open the National Arboretum Canberra officially in 2013, as the centrepiece of the National Capital's centenary celebrations.
One of the recommendations made by the 2003 Bushfire Recovery Taskforce was to develop a world-class multi-use, recreational sporting facility available to both recreational and professional users at the base of Mt Stromlo in the central west of the ACT. In response, the Stromlo Forest Park has been established with a purpose-built event pavilion, criterium cycling circuit, grass cross-country running track, equestrian tracks and mountain bike tracks, and various other trails suitable for runners and walkers. In 2008 and 2009 the ACT Economic Development Directorate estimates there were 216,000 visitors to Stromlo Forest Park (SGS 2010), an average of 590 visitors per day, which is 35% more people than in the equivalent period in 2007-08 (SGS 2010). Ongoing visitor counts and surveys guide the future strategic management of the park, which is continuing to be developed.
For other areas of plantation forestry burnt in the 2003 bushfire, the determination of long-term land use agrees with the recommendation of the 2007-08 ACT State of the Environment Report. Land in the lower Cotter catchment and west of the Murrumbidgee River has been set aside for water catchment and is being replanted with native vegetation (see the Land health indicator cluster paper). Other areas have been reassigned to residential, community or recreation use, including the National Arboretum and the valley of the Molonglo River downstream of Scrivener Dam on Lake Burley Griffin. Areas for which the future land use has not yet been determined have been replanted or allowed to regenerate naturally with pine trees to retard soil erosion, pending a decision. At present there are no proposals to change the existing uses of land currently zoned for forestry.
Urban trees
Urban trees are important in Canberra. They are pleasant to the eye and give summer shade and winter shelter for people and habitat for wildlife. They are also a physical link between Canberra's past and its future. Canberra has an estimated 734,268 trees in streets, parks and open space (OCSE 2011a).
Urban-tree management is primarily the responsibility of the ACT Government, but there are also around 20,000 trees located on the national capital estate managed by the Australian Government's National Capital Authority (NCA).
Overall, there are a large number of trees to be managed: 1.6 urban street and park trees per resident compared with 0.7 trees per resident in Melbourne (OSCE 2011a). Like Canberra's open-space assets, the large number of trees in urban areas creates management challenges.
Pressure indicators [top ]
Urban development
Urban development is primarily driven by population growth and changes in household size, and it commonly takes place both in greenfield areas (land not previously urban) and as infill development in spaces within the urban area. Although infill development often reduces existing urban green infrastructure, greenfield development is generally seen to be less sustainable, environmentally. Greenfield development takes over existing natural habitat (even on agricultural land) and can reduce ecological connectivity (see also the Threatening processes indicator cluster paper), and the larger the urban area the more the transport required, with associated greenhouse gas emissions and embodied infrastructure energy.
Trends in greenfield and infill development in the ACT over the reporting period are shown in Table 2. Continuing the trend identified in the 2007-08 ACT State of the Environment Report, there has been more greenfield development than infill.
Table 2. Greenfield and infill development in the ACT, 2006 to May 2011, number and proportion of dwellings approved
| Year | Infill | Greenfield |
|---|---|---|
| 2006-2007 | 156 (7.4%) | 1966 (92.6%) |
| 2007-2008 | 828 (23.9%) | 2642 (76.1%) |
| 2008-2009 | 791 (18.8%) | 3417 (81.2%) |
| 2009-2010 | 1893 (46.6%) | 2168 (53.4%) |
| 2010 to May 2011 | 1110 (22.2%) | 3890 (77.8%) |
Source: LAPS
There are specific targets for urban infill in Sydney, Melbourne, Perth and Adelaide, as well as in south-east Queensland, but there is no such target for the ACT. Nonetheless, the ACT Government's indicative land release program for 2011-12 to 2014-15 shows that it expects urban infill to provide 45% of new dwellings over that period (Table 3), representing a significant shift from previous land release patterns.
Table 3. Proposed greenfield and infill development in the ACT, 2011-12 to 2014-15
| Detached dwellings | % of total greenfield or infill | Attached dwellings | % of total greenfield or infill | Apartments | % of total greenfield or infill | Total dwellings | % of total greenfield or infill | |
|---|---|---|---|---|---|---|---|---|
| Greenfield | 7110 | 70% | 2950 | 29% | 100 | 1% | 10160 | 55% |
| Infill | 220 | 3% | 2230 | 26% | 5890 | 71% | 8440 | 45% |
| Total | 7330 | 5180 | 5990 | 18500 |
Source: ESDD 2011
The current urban development policy in the ACT, as set out in the Canberra Spatial Plan (ACT Government 2004a), is based on a concentric model that restricts all urban growth to within 15 km of Civic, and intensifies residential development so that 50% of it occurs within a 7.5 km radius of Civic (ACT Government 2004a). The policy does not specify whether the urban intensification should use previously developed areas or be in urban open space.
Table 4. Trends in urban development location relative to the Canberra Spatial Plan objectives
| 2004-05 | 2005-06 | 2006-07 | 2007-08 | 2008-09 | 2009-10 | |
|---|---|---|---|---|---|---|
| Residential development within 7.5 km of Civic | 43.6% | 40.5% | 53.3% | 48.5% | 37.8% | 28.5% |
| Residential development within 15 km of Civic | 93.0% | 92.1% | 91.4% | 92.2% | 95.4% | 96.7% |
Source: ACTPLA
As shown in Table 4, performance against the objective to contain residential development within 15 km of the city centre (Civic) has improved over the reporting period, though some development has occurred outside that area. More significantly, the share of development occurring within a 7.5 km radius of Civic fell to 28.5% of total development in 2009-10.
Figure 6 shows the various dwelling types approved in each state or territory for 2009-10. More townhouses and apartments were built in Canberra in that year than in the other jurisdictions. The trend towards more townhouses and apartments was also noted in the previous reporting period, and is in line with the targets of the Canberra Spatial Plan.
Figure 6. Proportion of various types of dwellings approved, 2009-10, Australia
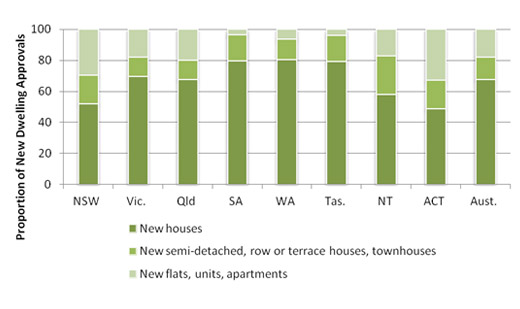
Source: ABS 2010b
Land was released in the ACT for 4297 dwelling sites in 2009-10. For 2010-2012, land releases for housing are projected to provide for 5000 dwellings per year. After that, releases for dwellings are expected to drop to 3500 per year (AG 2011). By comparison, land releases in 2004-05 and 2005-06 catered for 468 and 780 dwellings.
Faster releases of land can make housing more affordable and accessible, but they can also add to the challenges posed by increased urban sprawl and impacts on natural resources.
Housing demand
By 2031, it is estimated that around 49,000 additional residential dwellings will be needed in the ACT.
Consistent with Australia as a whole, the population in ACT has been ageing: from 2001 to 2006 the proportion of ACT people aged 65 years or more increased from 7.8% to 9.5% (ACTPLA 2007). If this trend continues there will be an increase in the demand for housing that caters for elderly people.
The mix of people in households (household composition) in the ACT is also changing. Statistical projections of household composition in 2026 are shown in Table 5. Family households are still expected to be the most numerous, but the number of one-person households is projected to increase by 48-114% above the number that there were in 2001, while one-parent households are projected to increase by 21-43% (ABS 2004). The projections suggest the ACT will need a wider range of housing choices than exists now.
Table 5. Household composition projections 2006-2031
| Household consumption | 2006 | 2031 | % Increase |
|---|---|---|---|
| One-person households | 29,000 | 43,000-62,000 | 48-114 |
| One-parent households | 14,000 | 17,000-20,000 | 21-43 |
| Family households | 87,000 | 100,000-109,000 | 15-25 |
Source: ABS 2004
In 2007 the ACT Government adopted an Affordable Housing Action Plan (Phase 1 and 2) to address the shortage of affordable rental and home ownership options. There are over 80 policy recommendations, which include: increasing the supply of affordable land to the market; expanding the supply of community housing; making more effective and targeted use of public housing; and introducing land rent and shared equity schemes (AHURI 2009).
The ACT Government is tracking progress of delivery on the Affordable Housing Action Plan through regular reporting against milestones with the most recent publicly available report documenting the following examples of outcomes:
- the Land Development Agency is on track to deliver the land releases as programmed for 2009; the land release program has been expanded from 3014 dwelling sites to 4061; the targets for 2010-11 and 2011-12 are now 5000 dwelling sites;
- the ACT Government and Community Housing Canberra have entered into an agreement for a $50 million revolving-finance facility to enable 1000 new affordable dwellings within 10 years; and
- procedures have been reviewed to ensure top priority applicants are now being housed within 3 months.
Community safety
Community safety refers to the perception of safety as well as actual threats to the safety of an individual in the community, particularly in relation to crime.
In 2006 in the ACT, 5.1% of individuals said they felt unsafe or very unsafe at home alone after dark, compared with 6.7% of individuals in Australia as a whole. In 2005-06, 9.9% of individuals were victims of physical or threatened violence (compared with 10.8% in Australia as whole) and 12.8% of individuals were victims of actual or attempted break-ins (compared with 9.4% in Australia as whole) (ACT Health 2010).
These figures show that Canberra people generally felt safer in the community in 2006 than Australians felt as whole, even though actual or attempted break-ins were affecting more people in the ACT than the Australian average.
During 2010-11, the ACT recorded significantly fewer of most types of reported crime than in the previous financial year. There were 37.3% fewer reported motor vehicle thefts, and 32.4% fewer burglaries, and 21.5% fewer offences relating to property damage. Crimes against people also decreased: 14% fewer weapons and assault offences than in the previous quarter, and there were 20% fewer robberies than in the 12 months to June 2010 (JCSD 2011).
Noise complaints
Environmental noise is defined as unwanted sound that may cause annoyance, disturb communication, or interfere with sleep and mental tasks (AIHW 2011). One measure of the impact of environmental noise is the type and number of noise complaints occurring in a community.
Over the reporting period, noise complaints averaged 1432 per year, about noises from a range of sources (Figure 7). Most complaints were about amplified music from commercial and licensed premises and entertainment venues in commercial-residential mixed-use areas. Complaints mainly related to venues set up in existing commercial buildings that had not been built to enclose noise (ORS). There were also complaints about amplified music from neighbours in residential areas. Advances in the technology of modern sound systems are giving people a greater capacity to amplify music in their homes.
Figure 7. Noise complaints received between 2007 and 2010
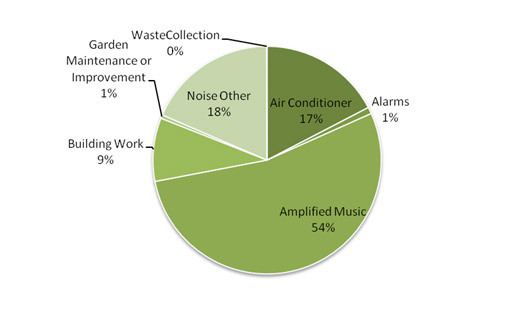
Source: DECCEW
Other types of environmental noise in the ACT (18% in Figure 7) include car and aircraft noise. Under its environmental responsibilities, Airservices Australia has established a Noise and Flight Path Monitoring System (NFPMS) at Canberra airport. Airservices Australia reports quarterly on aircraft noise relative to a threshold sound volume of 70 decibels (dB). While not an "exceedance level", 70 dB provides a guide to noise levels from aircraft (Table 6). In general, external sounds quieter than 70 dB should not inconvenience people listening to radio, television or conversational speech in a typical room with windows open. There is no curfew at Canberra airport, but there is a noise abatement area. Aircraft will normally be routed to avoid the noise abatement area, which includes Gungahlin, North Canberra, Belconnen, South Canberra, Woden, Tuggeranong and Queanbeyan.
Table 6. Number of aircraft noise events above 70 dB
| Year | Number of aircraft noise events above 70 dB |
|---|---|
| 2007 (from 1 July) | 4689 |
| 2008 | 12,232 |
| 2009 | 14,588 |
| 2010 | 13,902 |
| 2011 (to June 30) | 5807 |
| Total | 51,218 |
Source: Airservices Australia
Note: 2009 noise events are for two locations: Jerrabomberra and Hackett
Impact indicators [top ]
Human health impacts
Increasingly, connections are being made between the design and layout of urban areas and aspects of human health such as obesity, mental health and respiratory problems such as asthma. Potential impacts on adult health are being monitored via both positive (exercise and vegetable intake) and negative indicators (such as bodyweight and asthma) in people aged 18 years or more.
Table 7. Human health indicators for the ACT, 2007-08
| Indicator | Proportion of adults |
|---|---|
| Overweight or obese | 57.8% |
| Sufficient physical activity | 57.0% |
| Sufficient vegetable consumption | 7.2% |
| Adults reporting asthma | 9.6% |
Source: ACT Health 2010
At the start of the reporting period in 2007-08, nearly 58% of adults were considered to be either overweight or obese in the ACT (Table 7; ACT Health 2010). Two years later, in 2009, 64.9% of men and 50% of women were considered overweight or obese; that is, 42.1% of people over 18 were classified overweight and 25.6% were classified obese (ACT Government 2011c).
The walkability1 of the built environment can play a role in obesity rates. Recent studies of American cities and Australian cities other than Canberra have found a relationship between neighbourhood walkability, physical exercise taken, and obesity rates (AIHW 2011). While Canberra's liveability and health indicators compare favourably with other jurisdictions, reliance on car travel is likely to contribute to overweight and obesity.
Fresh vegetables are readily accessible to Canberra people, with locally produced fresh food available through various farmers' markets and supermarkets. In addition, the Canberra Organic Growers Society (COGS n.d.) operates 12 community gardens in the ACT region, at Charnwood, Cook, Cotter, Dickson, Erindale, Holder, Kaleen, Kambah, Mitchell, Oaks Estate, O'Connor, and Queanbeyan. COGS is currently exploring the opportunity to develop a city farm/community hub (COGS n.d).
With regard to respiratory problems, in 2007 approximately 9.6% of adults reported having asthma, a decrease from 12.3% in 2001. The reduction may indicate an improvement in air quality, among other possible reasons (ACT Health 2010).
Response indicators [top ]
Sustainable development and buildings
The sustainability and energy efficiency of buildings can be measured in multiple ways using rating tools that can be grouped into two broad types:
- predictive - those that predict performance at the building design stage, including house energy-rating tools such as AccuRate, and commercial building-rating tools such as Green Star;
- performance - those that measure the actual performance of the building, and can include behaviour and appliances, such as the National Australian Built Environment Rating System (NABERS).
For residential buildings, the ACT has required the mandatory disclosure of house energy rating at the point of sale since 1999, and until recently it was the only jurisdiction to do so. It is expected that disclosure of energy-efficiency ratings for residential buildings will soon be mandatory throughout Australia.
The Building Code of Australia in 2003 set mandatory requirements for the energy efficiency of Class 1 residential buildings, and in 2010 it increased the energy-efficiency requirements from 5 stars to 6 stars for all new Class 1 buildings. Class 1 buildings contain a single dwelling unit. Class 2 buildings (multi-dwelling units such as apartment blocks) have also been required to achieve 6 stars since 2010, compared to 3.5-4 stars in 2005.
For commercial buildings, since 2006 the Australian Government has required that all its new government office leases comply with Green Lease Schedules as a key component of its Energy Efficiency in Government Operations policy. The Green Lease Schedule stipulates a NABERS energy rating of at least 4.5 stars energy (exclusive of GreenPower) for all new leases. As a result, there has been an incremental upgrading of many of the commercial buildings in Canberra as Australian Government departments have changed tenancies or constructed purpose-built facilities. The ACT Government is also examining implementation of Green Lease Schedules.
Since 1 November 2011, the energy efficiency of all large commercial office buildings must be disclosed2 to potential buyers or lessees, these buildings must also have a current Building Energy Efficiency Certificate. It is anticipated that this will also contribute to a gradual improvement in the energy efficiency of Canberra's commercial buildings, although it is too early to determine the impact of this program.
Voluntary systems for measuring the sustainability of new buildings include the Green Star environmental rating system, which was established by the Green Building Council of Australia (GBCA) in 2002 (GBCA 2011a). In Canberra currently there are 24 Green-Star-accredited buildings, with all but one being office buildings (Table 8). This is a further illustration of the commitment by some businesses to use sustainable practices (see also the Community engagement indicator cluster) to reduce environmental impacts.
The Green Star environmental rating system is only one way of identifying commitments to reducing the environmental impact of buildings, and additional response indicators can also be considered.
Table 8. Green Star developments in the ACT, 2011
| Type | Registered for accreditation | 4 star | 5 star | 6 star |
|---|---|---|---|---|
| Office | 2 | 10 | 11 | 2 |
| Education | 4 | 0 | 1 | 0 |
Source: GBCA 2011b
For precinct-level development, sustainability can also be measured by voluntary rating tools. The Loop community precinct in Belconnen is the first GBCA community-rated project in Australia. Precinct rating tools include EnviroDevelopment, which has been used to rate the sustainable development precinct at Wright, a new suburb in the Molonglo Valley. The ACT Land Development Agency facilitates display houses in its new estates that showcases affordable and practical sustainability features at display houses in its new housing estates.
In 2011 the ACT Government released draft amendments to the Territory Plan that aim to improve the solar efficiency of houses by defining and limiting a building's envelope and by improving the design and orientation of new lots. In a solar efficient subdivision (ACTPLA 2011b:31):
Residential blocks should be oriented and proportioned so that a house can be designed with daytime living areas facing north and sunlit private open space, while limiting the overshadowing of adjoining residential blocks.
Inner city and higher density developments
Increasing housing densities in established areas such as town centres can make it easier for residents to reach places of work, leisure and community facilities, as well as public transport.
Under the Canberra Spatial Plan (ACT Government 2004a) the ACT planning strategy seeks to capitalise on Canberra's polycentric city structure, by achieving strategically located pockets of medium-density development around town centres. The aim is to support more distributed employment and services, linked by rapid and frequent bus services.
Figure 8 shows the change in the number of dwellings approved in each of Canberra's town centres from 2007-08 to 2010-11. Approvals for apartments have increased in 2010-11 in Woden, Tuggeranong and Civic, while fewer dwellings (about 100) have been approved in Belconnen in 2010-11 than in previous years. Gungahlin is an emerging town centre, and it has had a steady number of apartments approved in most years since its establishment.
Figure 8. Dwelling approvals in Canberra's town centres, 2007-2011
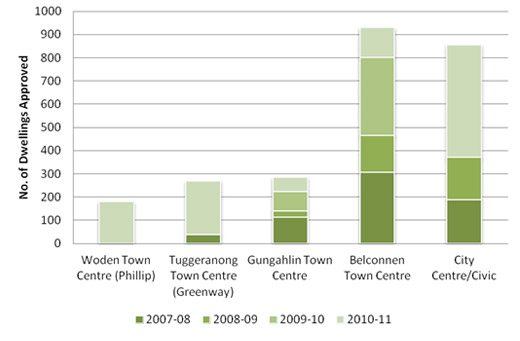
Source: LAPS
Efficiency of development
ACT as part of a region
The ACT is near to urban growth areas in NSW. As a consequence there are cross-border issues in relation to water supply, land release, service and infrastructure. As well as the ACT, the region comprises 17 different local government bodies in NSW, which means that there are multiple jurisdictions administering the region's urban quality.
It is estimated that more than 20,000 people live in the surrounding region and travel to work in the Territory each day. NSW residents in the region use the range of public and private services that are located in the ACT. These include schools and other educational facilities, hospital and other medical treatments, entertainment, leisure, and air travel (ACT Government 2011).
In the opposite direction, Canberra people enjoy proximity and easy access to coastal and mountain areas in the region, particularly for recreation, and they make use of regional infrastructure and services.
The 2004 Spatial Plan recommended a Regional Management Framework be prepared between the ACT and NSW governments to ensure fiscal responsibility. The aim of the recommendation was also to achieve co-operation on vital issues such as the location and sequencing of development, and co-ordination and cost effective delivery of essential services and infrastructure. Although numerous regional strategies, agreements and forums addressing sector-specific issues are in evidence, to date this recommended framework has not been delivered.
However, the ACT Government has given support to regional development by administering Australian Government funding to Regional Development Australia (ACT) and in providing important documents that assisted in informing the development of two ACT Strategic Regional Plans (2010 and 2011-12). The support is a welcome indication of progress towards comprehensive regionally-based planning.
ACT land development (cost and supply)
Development of greenfield land is primarily the responsibility of the ACT Government, through the Land Development Agency. Land development and infrastructure development have been subject to two evaluations recently.
The Auditor General has inquired into land development (AG 2011) and found that supplying and developing residential land within the ACT is a complex activity that involves several ACT Government agencies and methods. Further, the inquiry found that, to date, the process and programs for land supply and release have not been achieving the Government's stated objectives. Those objectives include: meeting demand for land; providing affordable land and housing; and establishing an inventory of serviced land.
The inquiry also found that the accelerated land-release programs of recent years have significantly escalated land supply and release activity. The extra workload has placed increased pressure on existing agency resources as well as on inter-agency relationships and protocols. It is hoped that the recent reconfiguration of the ACT Public Service will address some of these issues (AG 2011).
The Auditor General also noted that the true cost of land development has not been recognised and that ongoing benchmarking of land-development costs needs to be established as a practice. The extra land release and development has significant impacts on ecosystems and natural resources in the ACT. Currently, those impacts are not effectively measured and monitored (see Threatening processes indicator cluster and Biodiversity theme paper for more discussion).
For infrastructure in the ACT, the ACT Government Infrastructure Plan provides an overview of planned investment. In the 2008-09 Budget, the ACT Government established the $1 billion Building the Future Fund. This five-year infrastructure program will increase the ACT's infrastructure assets base by 10% (ACT Government 2011).
The Engineers Australia annual Infrastructure Report Card for 2010 (Engineers Australia 2010) found that most of the ACT's infrastructure is in a good condition. Three exceptions were noted: rail, which is considered inadequate for both current and anticipated future purposes, and wastewater and stormwater, both of which are rated as only adequate. The ACT's stormwater infrastructure is currently being improved through the development of constructed urban wetlands (see Water quality and River, lakes and wetlands health indicator cluster papers).
These findings are good when compared to other Australian jurisdictions. However, it will be challenging to maintain or improve these ratings in the future, for several reasons. First, the ACT infrastructure needs expansion to meet growing demand. Also, climate change is predicted to lead to water shortages and high energy consumption for cooling, in the future (Engineers Australia 2010). The impacts of predicted climate change on the ACT are discussed in the Climate Vulnerability indicator cluster paper.
Self-containment of development - Travel
Urban planning and development influence travel patterns within a city. Canberra has a planned hierarchy of centres based on the original planning principle that every household would be within an easy, safe walking distance of a local or group centre with schools, shops and commercial and community services (CMD 2010c). The original Y-Plan in 1967 (ACTPLA 2007) aimed for this self-containment - that is, people living near the places where they work and shop - reducing the need to travel.
Canberra is currently considerably less self-contained than the Y-Plan envisaged. It has a substantially higher share of jobs in its central parts than was anticipated. This proportion has been growing, at the expense of more dispersed locations, except in the period since the 2006 census during which there has been rapid growth in office parks, particularly those associated with Canberra airport.
In 2006, 195,440 people were employed in the ACT (Table 9). Central Canberra provided 49% of the employment in that year, a significant increase over the proportion in 2001 (46%). The share of workers employed in town centres and other locations dropped slightly, but remained around 20%.
Table 9. Employment distribution in the ACT, 2001-2006
| Employment zones | 2001 | 2006 | ||
|---|---|---|---|---|
| No. | % | No. | % | |
| Central Canberra incl. Civic Civic only) | 78,665 (17,858) | 46.0(10.4) | 95,260(25,792) | 48.7(13.2) |
| Town centres | 35,120 | 20.5 | 38,075 | 19.5 |
| Secondary zones | 21,845 | 12.8 | 23,230 | 11.9 |
| New town local zones | 35,370 | 20.7 | 38,875 | 19.9 |
| Total | 171,000 | 100.0 | 195,440 | 100.0 |
Source: ACTPLA 2009
To support lower car use it is desirable for workers to be located close to places of employment. Journey to work data can indicate the level of self-containment by establishing the number of residents employed in districts where they live. Table 10 shows the change in ACT self-containment levels since 1991. North and south Canberra have the highest level of self-containment, reflecting the high job availability relative to the number of residents. Belconnen, Queanbeyan and Woden-Weston Creek have containment levels of around 30%.
This topic is also discussed in the Transport indicator cluster paper.
Table 10. Change in self-containment levels
| Self-containment | 1991 | 1996 | 2001 | 2006 |
|---|---|---|---|---|
| North Canberra | 57.1 | 50.3 | 54.5 | 55.9 |
| South Canberra | 32.6 | 44.6 | 40.3 | 47.4 |
| Woden/Watson | 24.0 | 28.5 | 37.8 | 31.4 |
| Belconnen | 29.2 | 32.6 | 32.2 | 31.8 |
| Tuggeranong | 17.3 | 22.2 | 24.1 | 23.7 |
| Gungahlin | n/a | 10.9 | 13.7 | 15.6 |
| Queanbeyan | 32.4 | 34.5 | 30.4 | 29.6 |
Source: ACTPLA 2009
The Draft ACT Planning Strategy (ACT Government 2011b), open for community input until mid-December 2011, uses the common planning approach that it is good for people to live close to employment, facilities and services. The availability of jobs in town centres reduces pressure on the external road system and Civic, the centre of the city. The achievement of substantial employment in Gungahlin for example, which is planned to accommodate some 90,000-95,000 residents, is an important part of a strategy to reduce overall travel. Shorter trips to work use less fuel and energy, cause less air pollution and less traffic congestion, and allow more leisure time.
In line with this approach, the ACT Government's Sustainable Transport Plan for the ACT (ACT Government 2004b) sets out targets for improving the share of work trips made by sustainable modes of travel. See the Transport indicator cluster for more information.
Sustainable performance of development
In 2010, the ACTPLA undertook an analysis of the sustainability of four suburbs in Canberra (ACTPLA 2010). The study measured environmental and social characteristics of the suburbs and compared them to three international sustainability exemplars: Kronsberg in Hannover, Germany; Vauban near Freiburg, Germany; and Dockside Green in Victoria, British Columbia, Canada (Table 11).
In 2010, Canberra's suburbs all had a lower population density, used more land, and had larger areas of road, water use and carbon dioxide emissions per person than the three exemplars (ACTPLA 2010). This comparison highlights some of the challenges that Canberra's urban form will face in becoming a more environmentally sustainable city.
Table 11. Social and environmental performance of suburbs in Canberra
| Indicators | Reid ACT | Kingston ACT | Gungahlin ACT | Weston ACT | Vauban Germany | Kronsberg Germany | Dockside Green Canada |
|---|---|---|---|---|---|---|---|
| People per hectare of urban area | 48 | 47 | 33 | 13 | 134 | 85 | 288 |
| Land-take per person (m2) | 206 | 214 | 303 | 796 | 75 | 117 | 35 |
| Public open space per person (m2) | 14 | 9 | 13 | 204 | 34 | 27 | 14 |
| Road per person | 32 | 71 | 36 | 70 | 3 | 11 | 4 |
| Water use per person (kL) | 86 | 66 | 76 | 111 | 29 | 51 | 37 |
| CO2 emission per person (tonnes/yr) | 5.4 | 3.6 | 3.6 | 6.4 | 0.5 | 0.9 | 0.2 |
| Low income households | 9 | 2 | 12 | 0 | 10 | 37 | 10 |
Source: ACTPLA 2010
Open space management
Overall, Canberra residents express strong satisfaction with the amount of open space in Canberra and the value created by Canberra's street and park trees. Satisfaction with the amenity of Canberra's town and district parks and provision of facilities has markedly increased (Figure 9) between 2007-08 and 2010-11 (TAMS 2011).
Figure 9. Increase in satisfaction with town and district park facilities
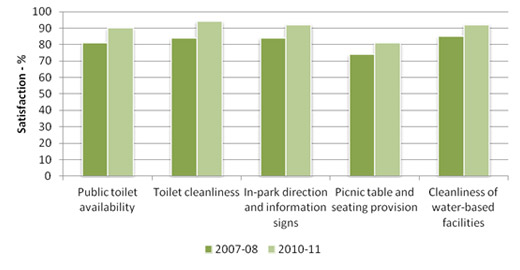
Source: TAMS 2011
Recent investigations (OCSE 2011a, 2011b) concerning Canberra's urban trees and nature parks have identified that although the city's green infrastructure is vast and a major asset, it is also a management challenge.
The investigation into nature parks has shown that 80% of them are in satisfactory condition, but localised areas in these reserves are in, or approaching, critical condition. Key factors adversely affecting the condition of some nature reserves were:
- native vegetation clearance;
- grazing pressure and soil disturbance from herbivores;
- weed infestations;
- erosion and bare soil;
- impacts from fire events (operational burns and wildfires) and other bushfire operations;
- visitor use impacts; and
- impacts caused by maintenance of infrastructure within nature reserves.
Some of the challenges currently confronting the nature reserves are being addressed; others are not. There are many opportunities to enhance the management in ways that could improve the reserves' resilience.
The investigations (OCSE 2011b) also identified the importance of ecological corridors in Canberra in counteracting the separation of the nature reserves by urban development. Habitat connectivity is increasingly being recognised as a key element in planning and management for wildlife conservation, and landscape connectivity is a key aesthetic element in the planning of Canberra. Work on connectivity has been undertaken by the government in recent years (see the Ecological communities indicator cluster paper for further information).
Future directions
The Canberra Spatial Plan (ACT Government 2004a), which guides long term planning for the ACT, is being reviewed and will incorporate findings from the Time to Talk Canberra 2030 project as well as future impacts such as changing demographics, changes to climate regime and economic structure of the city.
Time to Talk Canberra 2030 discussions highlighted the importance of the form of the city to the future of the Canberra community. Canberra people identified the relationship between being a more compact and a more accessible city. Attitudes to the future form of Canberra were mixed. A small survey indicated that 28% support a more compact city, 58% a mix of housing in existing suburbs and on the fringe, and 13% a more sprawling city (ACT Government 2010).The new Canberra Spatial Plan will direct the location of new development and the shape of the urban form.
COAG will also require all Australian governments to report on the performance of their cities against 9 indicators (COAG 2009:20):
To ensure Australian cities are globally competitive, productive, sustainable, liveable and socially inclusive and are well placed to meet future challenges and growth.
Each of the nine indicators will have quantifiable measurements, and achieving these targets may be tied to future funding agreements. The reporting against the 9 indicators may influence the format for the next State of the Environment Report.
However, any new strategic planning initiatives, policies or regulations will take some time to be put into effect on the ground.
Footnotes [top ]
1. Walkability is a measure of how conducive an area is to walking for either leisure, exercise or transport
2. under the Commercial Building Disclosure program managed by the Australian Government (Australian Government 2010)
References [top ]
ABS 2003. 4102.0 - Australian Social Trends. Cat. No. 4102.0. Australian Bureau of Statistics. Australian Government. Canberra. http://www.abs.gov.au/ausstats/abs@.nsf/2f762f95845417aeca25706c00834efa/3176be0eaef1bd1aca2570ec0000eadf!OpenDocument (accessed 15/8/11)
ABS 2004. 3236.0 - Household and Family Projections 2001 to 2026. Cat. No 3236.0. Australian Bureau of Statistics. Australian Government. Canberra. http://www.ausstats.abs.gov.au/ausstats/subscriber.nsf/0/DF2989BFFA7392E1CA256EB6007D63F4/$File/32360_2001%20to%202026.pdf (accessed 18/11/11)
ABS 2006. 1216.0 - Statistical Geography: Volume 1. Cat. No. 1216.0. Australian Bureau of Statistics. Australian Government. Canberra. http://www.abs.gov.au/AUSSTATS/subscriber.nsf/log?openagent&12160_2006.pdf&1216.0&Publication&3E15ACB95DA01A65CA2571AA0018369F&0&Jul%202006&14.07.2006&Latest (accessed 18/11/11)
ABS 2008. 2030.9 - Canberra: A Social Atlas, 2006 Census of Population and Housing. Cat. No. 230.8. Australian Bureau of Statistics. Australian Government. Canberra. http://www.abs.gov.au/AUSSTATS/subscriber.nsf/log?openagent&20308_2006.pdf&2030.8&Publication&F084CC2518A2F7C3CA25740E0079DE65&&2006&17.03.2008&Latest (accessed 21/11/11)
ABS 2010a. 4102.0 - Australian Social Trends: Housing. Cat. No. 4120.0. Australian Bureau of Statistics. Australian Government. Canberra. http://www.abs.gov.au/ausstats/abs@.nsf/mf/4102.0 (accessed 2/9/11)
ABS 2010b 8731.0 - Building Approvals, Australia, Aug 2010. Cat. No. 8731.0. Australian Bureau of Statistics. Australian Government. Canberra. http://www.abs.gov.au/AUSSTATS/abs@.nsf/Previousproducts/8731.0Main%20Features2Aug%202010?opendocument&tabname=Summary&prodno=8731.0&issue=Aug%202010&num=&view= (accessed 4/9/11)
AG 2011. Residential Land Supply and Development Report No. 2 /2011. ACT Auditor General's Office. ACT Government. Canberra. http://www.audit.act.gov.au/auditreports/reports2011/Report_2-2011_Residential_Land_Supply_and_Development.pdf (accessed 14/7/11)
ACT Government 2004a. Canberra Spatial Plan. Canberra. http://apps.actpla.act.gov.au/spatialplan/introductory/index.htm.http://apps.actpla.act.gov.au/spatialplan/introductory/index.htm (accessed 25/8/11)
ACT Government 2004b. Sustainable Transport Plan. Canberra. http://www.tams.act.gov.au/__data/assets/pdf_file/0010/167941/Sustainable_Transplan_Plan.pdf (accessed 18/11/11)
ACT Government 2008. Affordable Housing Action Plan Progress Report. Canberra. http://www.actaffordablehousing.com.au/index.html (accessed 23/8/11)
ACT Government 2010. Time to Talk: Canberra 2030 - Outcomes Report. Canberra. http://timetotalk.act.gov.au/storage/78d10e40d957379825347909b6e2bfd9.Time%20to%20talk%20-%20web%20version.pdf (accessed 2/9/11)
ACT Government 2011. ACT Government Infrastructure Plan 2011-2021. Canberra. http://www.cmd.act.gov.au/__data/assets/pdf_file/0013/220306/infrastructureplan2011.pdf (accessed 23/8/11)
ACT Government 2011b. Draft ACT Planning Strategy. Canberra. http://timetotalk.act.gov.au/storage/1222_PLANNING_STRATEGY_TAGGED_PDF_FINAL.pdf (accessed 11/9/11)
ACT Government 2011c. Time to Talk: Background Paper 6 - Health and Wellbeing. Canberra. http://timetotalk.act.gov.au/storage/Planning_Background06_Health.pdf (accessed 20/11/11)
ACT Health 2010. Chief Health Officer's Report. ACT Government. Canberra. http://www.health.act.gov.au/c/health?a=sendfile&ft=p&fid=1285049820&sid= (accessed 18/11/11)
ACTPLA 2007. Canberra at the 2006 Census: Population and Housing. ACT Planning and Land Authority. ACT Government. Canberra. http://www.actpla.act.gov.au/__data/assets/pdf_file/0007/7675/Canberra_at_2006_Census.pdf (accessed 18/11/11)
ACTPLA 2008. Territory Plan - Part B9 Urban Open Space Land use Policies. ACT Planning and Land Authority. ACT Government. Canberra. http://apps.actpla.act.gov.au/tplan/b/B9.pdf (accessed 18/11/11)
ACTPLA 2009. Employment Location in Canberra. April 2009. ACT Planning and Land Authority. ACT Government. Canberra. http://www.actpla.act.gov.au/__data/assets/pdf_file/0004/14269/Employment_distribution.pdf (accessed 18/11/11)
ACTPLA 2010. Urban Form Analysis. Canberra's Sustainability Performance: Technical Report. ACT Planning and Land Authority. ACT Government. Canberra. http://www.actpla.act.gov.au/__data/assets/pdf_file/0013/21046/ACTPLA_Urban_Form_Scenarios_Final_Report_WEB.pdf (accessed 21/4/11)
ACTPLA 2011a. Population and Residential Density in Canberra. ACT Planning and Land Authority. ACT Government. Canberra. http://www.actpla.act.gov.au/__data/assets/pdf_file/0005/23648/Population_Density_2011.pdf (accessed 18/11/11)
ACTPLA 2011b. Planning and Development (Draft Variation Number 306) Consultation Notice 2011. ACT Planning and Land Authority. ACT Government. Canberra. http://www.legislation.act.gov.au/ni/2011-273/current/pdf/2011-273.pdf (accessed 10/11/11)
AHURI 2009. ACT Affordable Housing Action Plan: Phase II. Australian Housing and Urban Research Institute for ACT Government. Canberra. http://www.economicdevelopment.act.gov.au/affordable_housing/affordable_housing/pdfs/PhaseII_Affordable_Housing_Action_Plan.pdf (accessed 18/11/11)
AIHW 2011. Health and the Environment: A Compilation of Evidence. Australian Institute of Health and Welfare. Canberra. http://www.aihw.gov.au/publication-detail/?id=10737418534 (accessed 22/04/11).
Australian Government 2010. Commercial Building Disclosure: A national energy efficiency program. Canberra. http://www.cbd.gov.au/ (accessed 16/10/11)
Australian Government 2011. Nation Building - Economic Stimulus Plan. Canberra. http://www.economicstimulusplan.gov.au/pages/default.aspx (accessed 6/6/11)
COAG 2009. Communiqué. 28th COAG Meeting. Brisbane. 7 December 2009. Council of Australian Governments. Australian Government. Canberra. http://www.coag.gov.au/coag_meeting_outcomes/2009-12-07/docs/20091207_communique.pdf. (accessed 18/9/11)
COGS n.d. Community Gardens. Canberra Organic Grower's Society Accessed at http://www.cogs.asn.au/community-gardens/ (accessed 23/08/11).
CMD 2010a. Land Use and Planning - Canberra 2030. Chief Minister's Department. ACT Government. Canberra. http://timetotalk.act.gov.au /2030-outcomes-report/ (accessed 24/11/11)
CMD 2010b. Housing - Canberra 2030. Chief Minister's Department. ACT Government. Canberra. http://timetotalk.act.gov.au /2030-outcomes-report (accessed 24/11/11)
CMD 2010c. City Form - Canberra 2030. Chief Minister's Department. ACT Government. Canberra. http://timetotalk.act.gov.au/ (accessed 24/11/11)
CMD 2011. Canberra Social Plan. ACT Chief Minister's Department. Canberra. http://www.cmd.act.gov.au/__data/assets/pdf_file/0010/216559/2011CanberraSocialPlan_Print_Version.pdf (accessed 26/10/11)
DET 2006. Towards 2020: Renewing our Schools. Department of Education and Training. ACT Government. Canberra. http://activated.act.edu.au/2020/pdf/Towards2020.pdf (accessed 2/3/11)
DET 2011. ACT School Census February 2011. Department of Education and Training. ACT Government. Canberra. http://www.det.act.gov.au/__data/assets/pdf_file/0020/204284/ACT_Schools_Census_February_2011.pdf accessed (accessed 27/10/11)
Engineers Australia 2010. Australian Capital Territory Infrastructure Report Card 2010. Canberra. http://www.engineersaustralia.org.au/sites/default/files/shado/Divisions/Canberra%20Division/Infrastructure%20Report%20Card.pdf (accessed 18/11/11)
ESDD 2011. Australian Capital Territory Indicative Land Release Programs 2011-12 to 2014-15. Environment and Sustainable Development Directorate. ACT Government. Canberra. http://www.economicdevelopment.act.gov.au/__data/assets/pdf_file/0010/205021/Final_Print_Ready_Land_Release_Text_6_May_2011.pdf (accessed 18/7/11)
EDD 2011. Nationa Arboretum Canberra - Background. Economic Development Directorate. ACT Government. Canberra. http://www.nationalarboretum.act.gov.au/background (accessed 11/6/11)
GBCA 2011a. About: Green Building Council of Australia. Green Building Council of Australia. Sydney. http://www.gbca.org.au/about/ (accessed 28/6/11)
GBCA 2011b. Green Star Building Directory. Green Building Council of Australia. Sydney. http://www.gbca.org.au/greenstar-projects/ (accessed 31/5/11)
JCSD 2011. ACT Criminal Justice Statistical Profile. Justice and Community Safety Directorate. ACT Government. Canberra. http://www.justice.act.gov.au/resources/attachments/ACT_CJSP_Sept_2011_FINAL_PDF.pdf (accessed 17/10/11)
Mees. P. Sorupia. E. & Stone. J. 2007. Travel to Work in Australian Capital Cities. 1976-2006: An Analysis of Census Data. Australasian Centre for the Governance and Management of Urban Transport (GAMUT). http://www.abp.unimelb.edu.au/gamut/pdf/travel-to-work.pdf (accessed 18/11/11)
OCSE 2011a. Report on the Investigation into the Government's Tree Management Practices and the Renewal of Canberra's Urban Forest. Office of the Commissioner for Sustainability and the Environment. Canberra. http://www.envcomm.act.gov.au/investigations/canberras_urban_forest (accessed 24/4/11)
OCSE 2011b. Report on Canberra Nature Park (Nature Reserves); Molonglo River Corridor (Nature Reserves) and Googong Foreshores Investigation. Office of the Commissioner for Sustainability and the Environment ACT Government. Canberra. http://www.envcomm.act.gov.au/investigations/nature_reserves_investigation (accessed 23/8/11)
SGS Economcs 2010. Stromlo Forest Park Master Plan Business Case. Prepared for Territory and Municipal Services. ACT Government. Canberra.
PCL 2009. Facts at a Glance 2009. Parks Conservation and Lands. http://www.tams.act.gov.au/__data/assets/pdf_file/0020/166061/PCLFacts_2009web.pdf (accessed 18/8/11)
Purdon 2008. Future Uses for Public Schools. Purdon Associates. Canberra. http://www.purdon.com.au/formerschoolsites/ (accessed 18/8/11)
TAMS 2011. ACT Sportsgrounds, Parks and Open Spaces Usage and Satisfaction Survey - June 2010/11, Department of Territory and Municipal Services. ACT Government. Canberra.
Other data sources
In addition to these published reports, data for this paper were also sourced from:
- ACT Department of Land and Property Services (LAPS) - now part of Economic Development Directorate (EDD)
- AirServices Australia
- ACT Department of the Environment, Climate Change, Energy and Water (DECCEW) - now Environment and Sustainable Development Directorate (ESDD)
- ACT Emergency Services Authority (ESA)
- ACT Office of Regulatory Services (ORS)
- ACT Planning and Land Authority (ACTPLA) - now part of the Environment and Sustainable Development Directorate (ESDD)
- Community Services Directorate (CSD)


Share this page: