


ACT State of the Environment Report 2011
Accurate, timely & accessible information for the community regarding the condition of the environment, underlying pressures, and sustainability trends.


Driving Forces
Download: Driving Forces.pdf
Environmental change can be driven by multiple forces, across time and various locations. These driving forces are demographic, social and economic pressures, which impact our environment. Driving forces can be categorised into two types of pressures: direct and indirect. Direct driving forces are the result of explicit actions, such as land clearing. Indirect driving forces, on the other hand, originate from interactions between broad social, economic, political and technological changes over time, and can include shifts in individual and collective values, attitudes and behaviours. While determining immediate effects and considering future scenarios for direct driving forces is possible, albeit challenging, predicting and planning responses to indirect driving forces is not as simple. Regardless of the complexity of the task, determining the effects of understanding these driving forces and planning future responses is the key to achieving progress towards sustainability.
Four driving forces have been identified for the ACT SoE 2011:
- Population growth and changing demographics in the ACT, which strongly influence demand for housing, infrastructure, and goods and services, can have significant impacts on all aspects of the environment;
- Landuse and transport systems, which require resources, including energy, contribute to emissions and can affect the health of ecosystems and the community's quality of life;
- Climate variability and change, which includes seasonal and interdecadal weather pattterns, as well as longer term variations that are accompanying climate change can impact on natural ecosystems and resources, such as water and vegetation cover, as well as the health, well-being and viability of human communities.
- Consumption, which is connected with economic performance and growth, level of resource use, waste generation and emissions can have direct impacts on the environment.
This paper draws on a number of expert papers developed for this ACT SoER that address these four driving forces, namely:
- The 2008-09 Ecological Footprint of the population of the ACT by Dr Chris Dey
- Buying choices for a more sustainable Canberra by Dr Sarah Ryan;
- Canberra's Ecological Footprint: what does it mean? by Dr Joy Murray and Dr Chris Dey;
- Exploring individual values and attitudes for a more sustainable Canberra: the example of food by Dr David Pearson;
- Weather and Climate of the ACT 2007-11 and decadal trends by Mr Clem Davis and Dr Janette Lindesay; and
- Land use and Transport by Mr Richard Johnston
Understanding the role of the four driving forces, as outlined above, is critical for moving towards a more sustainable future. The issues related to each of these forces are discussed below.
Population [top  ]
]
The estimated resident population of the ACT on 31 March 2011 was 363,834 persons (CMCD 2011) and it is projected to increase to 434,300 by 2030 and to 500,000 by 2050 (ACT Government 2011). Population growth in the ACT has been higher than the national average annual rate over the past ten years. Interestingly, most of this growth has come from natural increase rather than from interstate or overseas migration (ACT Government 2010a).
Within the abovementioned population increase, it is expected that the ACT will experience significant demographic change, with the population of persons aged 65-84 projected to increase by 170% and those over 85 and over by an enormous 509% (ACT Government 2009). At the same time, the number of persons aged 14 and under in the ACT is projected to increase by only 42%; while the number of persons aged 35-64 (the older working age population) is projected to increase by approximately 43% (Figure 1).
Figure 1. Age Structure and total ACT Population projections, 2007-2056
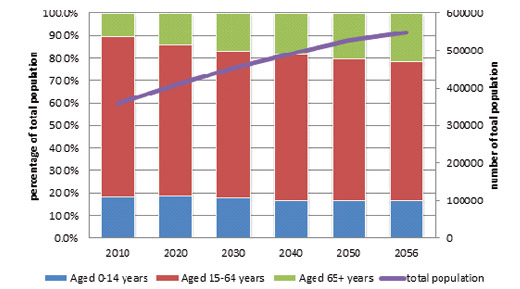
Source: ACT Government 2009
This projected population growth and demographic change may impact the environment in both negative and positive ways. For instance, an ageing population is a sign of affluence and technological development, and is not expected to diminish our material prosperity. However, it is expected to reduce the rate of economic growth due to lower participation in the labour force (ACT Government 2010a). Further, the ageing of the population, coupled with lower birth-rates, is predicted to increase the need to attract additional skilled workers into the ACT (Jackson 2008). Conversely, population growth and change can deliver professional and technical skills and knowledge that adds capacity and resources to a community. This, in turn, can facilitate attitudinal change and result in practical outcomes for improved sustainability, such as greater engagement in biodiversity conservation and resource efficiency actions.
Overall, a growing population poses some serious concerns as it will require additional housing and associated transport, energy, water and waste infrastructure, along with educational, medical, retail, recreational and other services. This can place extreme pressure on our natural resources, as well as limit the ability of government to provide required infrastructure, services and support. For example, population growth, along with the predicted effects of climate change, is likely to exert pressure on water supply and demand.
Although ACT residents have demonstrated their ability to reduce water use over the long drought period, there are several concerns pertaining to water supply. The Water Security for the ACT and Region report estimated a significant reduction from the average annual and historical inflows to ACT reservoirs in the future (ACTEW 2007). ACT water supplies will come under even greater pressure, given the growing population and predictions of increased temperatures and reduced rainfall accompanying climate change. Current water supply security measures, including the enlargement of the Cotter Dam and extraction from the Murrumbidgee River, will provide additional water capacity and storage, aimed to address increased demand, climate variability and change. Yet, associated construction, loss of habitat and alteration to river flows inevitably bring their own set of environmental challenges.
ACT within the Region
A key driver of change is population growth in the surrounding areas of regional NSW, with the population of the Australian Capital Region in 2011, including the ACT, reaching 466,000 (CMD 2010). The region's population is predicted to grow to over 577,000 by 2031 (CMD 2010), with recent Australian Government initiatives such as funding for regional health, education and infrastructure projects making regions more attractive to live and work in, especially for families (Crean 2011).
As Australia's largest inland city, Canberra is a major regional centre for the surrounding towns and districts, providing employment, as well as education, health, entertainment and retail services to neighbouring NSW residents (RDA ACT 2010). On the other hand, ACT residents regularly access recreational facilities in rural, coastal and mountain resort areas, contributing to local economies but also making use of the regional infrastructure (e.g. water, energy, waste disposal and roads), as well as various health and other services. Access to these areas by an ageing population is likely to increase reliance on transport modes other than private motor vehicles. While this could mean a positive upward trend in the use of more sustainable forms of transport, services across the region would need to improve markedly. Currently, services are limited to those operating on weekdays between the ACT and surrounding regions, and the availability of such services usually decreases with increasing trip distance (ABS 2010a).
Landuse and transport systems [top ]
Changes in the type and intensity of landuse over time place pressure on the environment and on all species, including people living within this natural environment. Landuse changes can alter the environment in highly visible ways, such as vegetation clearing, soil erosion and exotic weed infestation; while changes such as soil and groundwater contamination can be more difficult to identify. In the most modified areas in the ACT, the cumulative impact of clearing, cultivation and urban development has induced a range of local and off-site impacts on soil health and landscape function. These impacts include reduced permeability, structural stability, nutrient cycling and moisture, and carbon holding capacity; increased soil erosion; localised salinity and acidity problems and impairment of hydrological function (NRMC 2009).
Landuse practices and urban development, both within and upstream of the ACT, have impacted the health of rivers and streams in the ACT. In particular, water quality has been diminished by increased sediment and nutrient loads, decreased oxygen concentrations, higher water temperatures, reduced flow, and more frequent algal blooms. Most natural riparian vegetation and habitat has been cleared or severely altered (as reported in the Land and Water indicator papers).
River health is of particular concern. Rivers in the Canberra area are either severely impaired or moderately impaired, with the exception of creeks running out of forested areas and the Murrumbidgee River as it enters the ACT, which are recorded to be in good condition (measured against the AUSRIVAS assessment tool). Extraction from waterways and increased run-off from sealed and disturbed surfaces, in both rural and urban areas, have further impacted the ecosystems and aquatic species of the ACT. In recent years, extended drought and the legacy of severe bushfires have added to development-related pressures (NRMC 2011).
Urban form and landuse in the ACT
The ACT is approximately 2,352 square kilometres in area, with less than one quarter of the land area under urban development. Over the reporting period, the urban footprint of the ACT has increased by about 9%. This change has impacts on biodiversity, hydrology and land health for the ACT. However, we have a large system of protected areas and open space, with about 58% of ACT land (a little over 137,000 hectares) zoned for conservation purposes (Table 1). Changes to areas zoned for water and catchment are largely due to planning adjustments that recognise catchment areas separately from that of other land uses.
Table 1: ACT Land use changes
| Zone | 2007 ha | 2011 ha |
|---|---|---|
| Urban | 24 789 | 26 958 |
| Water, including catchment areas | 2 812 | 9 264 |
| Conservation | 136 610 | 137 349 |
| Other | 71 613 | 62 253 |
| Total | 235 824 | 235 824 |
Source: ACTPLA
Note: figures are based on zones from the Territory plan and do not always match actual on ground uses
One feature of Canberra's urban development has been the progressive reduction in the single residential block size over time (ACT Government 2011). Further, across Australia, over the past couple of decades, there has been a dramatic increase in house size, to the extent that Australian homes in 2009 were, on average, the biggest in the world (CommSec 2009). Yet for the first time in at least a century, the number of persons per household rose slightly during the 2007-08 year from 2.51 to 2.56 persons. This means that if this trend were to continue, fewer houses would need to be built. However, in the ACT from 2006 to 2026, the number of lone person households and couples without children is expected to increase much more than that of other household groupings (ABS 2010b). This trend is likely to continue in the future and consequently lead to an increased demand for more and diverse types of housing.
Recent studies indicate big differences between the kind of houses Australians say they would choose and what is being built (Kelly 2011). In particular, more people indicated a preference for semi-detached homes and apartments in the middle and outer areas of both Melbourne and Sydney than are available. The report also found that the reasons for the gap between preferred and available housing is largely the result of incentives provided to residential developers, in the form of financing practices, planning and land issues and material and labour costs (Kelly 2011). These findings are likely to have application to the ACT as well.
Given population projections, over the next 10 years it is estimated that around 30-35,000 new residential dwellings will be built in the ACT (CMD 2010b). Just over half of these are expected to be constructed as part of greenfield development in areas such as Gungahlin and Molonglo. The remaining new dwellings are expected to be built as urban consolidation, primarily in the inner north and inner south (including the East Lake development) and to a lesser extent in Belconnen (CMD 2010b). This is of concern as Canberra's current low density and dispersed pattern of land development already pose challenges for the efficient use of urban infrastructure. The way land is used in urban areas affects people's quality of life, influencing the amount of privacy, space, and noise experienced by the residential population, with potential human health effects (ACT Government 2010c).
In Canberra, the residential amenity of suburbs, surrounded by natural landscape, provides many advantages, including the opportunity to enjoy the natural environment and do more physical activities. However, a study commissioned by the ACT Land and Planning Authority comparing four Canberra suburbs with European cities that were chosen for their liveability and sustainability (ACTPLA 2010), found that compared to the European cities, the Canberra suburbs:
- were much lower in density and efficiency of land use;
- generally provided less public open space per person;
- had more than three times the length of roads;
- provided less housing choice;
- used at least twice as much water; and
- emitted about 10 times more carbon dioxide per person per year.
Considering the expected population growth and increasing affluence of the ACT (two key factors influencing the extent and character of urban development), these results highlight the extent of the challenge we face in creating a more sustainable city.
Open space and nature parks in the ACT
As noted above, more than half the land area of the ACT is zoned for conservation as national park and nature reserves, including Namadgi National Park, Tidbinbilla Nature Reserve and Canberra Nature Park. Canberra also has large expanses of urban open space, which, together with urban trees, district and town parks, local parks and lakes and ponds form the bulk of Canberra's green infrastructure. These spaces not only serve as important habits for native plants and animals, but also provide benefits as a resource for recreation and tourism. More importantly, these spaces support the health, wellbeing, and sense of place of Canberra residents by enhancing the water quality of waterways and assisting in stormwater drainage (ACTPLA 2008). These spaces also sequester carbon and provide other benefits for mitigating and adapting to climate change. For example, nature reserves and urban green infrastructure help reduce the impacts of climate change by reducing the urban heat island effect. Further, there is strong evidence that access to open space can provide significant mental and physical benefits for the surrounding population (De Vries et al. 2003; Nielsen and Hansen 2007).
While Canberra's parks and open spaces are a major asset, they also present a management challenge (OCSE 2011). As the population continues to grow and the number of visitors continues to increase, pressure on nature reserves, waterways and urban open space is likely to increase as well. Such development pressure for infrastructure and housing, along with increased usage, leads to an increased demand for water for domestic, commercial and recreational use; and an increased risk of increased soil and water pollution, soil erosion, weed infestation and loss of vegetation connectivity. Many of these factors have already been identified as adversely affecting the condition of some nature reserves in the ACT (OCSE 2011). In addition, climate change is predicted to increase the risk of extreme weather events such as heat waves, storms and bushfires. Dealing effectively with these risks in order to balance environmental protection with social and economic realities, will require strategic planning, resource commitment and collaboration across public, private and community sectors.
Transport
Transport assets, systems and choices have significant impacts on our community and our city, as well as the quality of the environment. Different transport modes such as private vehicles, public transport and walking have different impacts on the environment and human health. These impacts can either be direct or indirect. Road traffic crashes are one example of a direct health impact that may lead to injuries and fatalities (AIHW 2011). On the other hand, a less direct impact is the potential for detrimental health effects resulting from reduced exercise levels for using passive modes of transport. In 2009 in the ACT, 64.9% of men and 50% of women were considered overweight or obese while 42.1% of people over 18 were classified overweight and 25.6% were classified obese (ABS 2011).
Road transport is also a significant source of greenhouse gas emissions and the majority of these emissions are from passenger vehicles. The mode of travel is influenced by landuse and transport policies as well as individual behaviours and choices. The reliance on car use in the ACT and the relative lack of heavy industry, such as chemical plants or smelters, means that transport accounts for 24% of the ACT's total greenhouse gas emissions (ACT Government 2010d), a significantly higher figure than for the other states and territories.
Public and private transport-related infrastructure, such as roads, parking areas, service stations, cyclepaths, walkways, driveways, paths and garages, is a part of the urban form and has considerable negative impacts on the natural environment. These impacts include reductions in the permeability of land, vegetation clearing, altering of water flows and impediments to the movements of native animals.
Planners in the 1960s and 70s envisaged "self-containment", where Canberrans would live and work in the same district and walk or use public transport to travel to work. However, the city is considerably less self-contained than was anticipated in the 1970s "Y-Plan", with many more people now working in the central area. In addition to this, the ACT now has an extensive road system in relation to its population, compared with that of the other Australian cities. Despite the fact that levels of walking and cycling are above the national average, motor vehicles are by far the most common mode of travel to work for Canberrans (see the Transport indicator cluster paper). Finally, although rising fuel prices and predicted shortages in the future may encourage greater use of public and other forms of transport, these shifts would also lead to an uneven distribution of financial and other burdens, particularly for older people and those on low incomes.
Climate [top ]
There is now very strong and consistent evidence that the earth's surface is warming rapidly. The number of days with record hot temperatures has been increasing each decade over the past 50 years with fewer record cold days each decade, with the period 2000-2009 being the warmest decade on record (BOM 2010). There is also a high level of confidence in the scientific community that the cause of this warming is human emissions of greenhouse gases. In Australia, changes in ecosystems have already been observed, providing a clear indicator of a changing climate. These changes include genetic shifts in animal populations, changes in breeding and migration patterns and behaviours (Australian Government 2011).
The most likely future climate scenario for the ACT includes (Webb 2011):
- the strong likelihood of mean temperatures continuing to increase, along with more frequent and severe heat waves for the ACT and region; and
- a high probability of changes in the current pattern of rainfall during the period of instrumental records, with some risk of a decline in long-term average rainfall; and in addition, the likelihood of an increase in rainfall intensity, with more extreme rainfall events.
While the precise causes and effects of climate change are both difficult to quantify and only discernable in long-term global trends, the direct impacts of the more immediate and localised weather variations can give indications of what those more far-reaching changes might bring with them. Typically there are almost three times as many heat waves occurring in the hotter and drier El Nino years than in cooler and wetter La Nina years.
Nonetheless, while weather patterns over the reporting period have shown considerable variability, few consistent changes in longer-term trends have been observed. However, it needs to be considered that even small changes, such as those indicating a trend of higher average temperatures, increased weather variability with more extreme weather events like storms and heatwaves, are likely to have significant impacts. In particular, human health and wellbeing, food security, biodiversity and the health of ecosystems, along with the viability of water resources, are all likely to be affected. It is thus essential that we plan and take action for these kinds of changes and the resultant impacts.
The Weather and Climate of the ACT 2007-11 and Decadal Trends paper prepared for the 2011 ACT SoER (Davis and Lindesay 2011) presents weather and climate data for the ACT over the reporting period as well as decadal trends. Information from this paper is summarised below.
The ACT region recorded below average rainfall for seven out of the last 10 years (2001-2010), with 2010 being the only year having considerably above average during this period . However, beyond this natural variability, the only trend evident in recent decadal rainfall records for the ACT is a drying trend in autumn, consistent with other parts of south-eastern Australia over the last 10 to 15 years.
Temperatures have stayed above the long-term mean for the entire reporting period. Long-term trends indicate that temperatures have been increasing with more marked increases over the past 10 years in line with the overall trend for Australia. Although the ACT experiences only a small number of heatwaves, the decadal trend indicates an increase in the number of heatwave events and days. This is also evidenced in the nine heatwaves (37 days in total) and 20 hot events (60 days in total) recorded in Canberra Airport during the reporting period.
These results appear to reflect the impacts of El Nino Southern Oscillation (ENSO) events where El Nino events tend to produce hotter summers (as occurred in 2008-09) and La Nina events produce cooler summers in the ACT (as occurred in 2010-11). While climate variability has been evident over the reporting period, long-term trends are consistent with climate change predictions of hotter and drier conditions, along with more extreme climate events (Table 2).
Table 2. Changes in weather phenomena 1961-2010
| 1961-1990 Average | 2008-2010 Average | |
|---|---|---|
| Days 35 oC or more | 5 | 11 |
| Days 30 oC or more | 30 | 43 |
| No. Frosts | 99 | 65 |
| No. Thunderstorms | 23 | 20 |
| No. Fogs | 44 | 39 |
| No. Strong Wind Days | 26 | 24 |
| No. Rain Days | 105 | 101 |
| Mean Daily Pressure (isobars) | 1016.7 | 1017.4 |
Source: Davis and Lindesay 2011
Wider global, national and regional weather events also have impacts at the local level. Severe drought conditions continued over the early part of the reporting period, with a very hot year and two severe dust storms in Canberra in 2009. The source of these dust storms was the drought-stricken areas like Lake Eyre in South Australia (ABC News 2010) and the local impacts included reduced air quality and visibility and a covering of dust.
These drought conditions had widespread impacts on native and exotic vegetation, the health and reproductive capacity of native species, river and catchment health, groundcover and soil erosion. The end of this drought was marked by heavy rainfall in 2010, with a significant flooding event in Queanbeyan and nearby parts of the ACT in December of that year. Canberra Airport recorded its wettest December day on record on 3 December 2010 (87.6 mm). Such storm and flooding events can cause property and infrastructure damage, while sediment and contaminates brought by high levels of runoff can reduce water quality and damage riparian and aquatic habitats.
Climate change is a global phenomenon that will bring additional pressure to the Territory's water resources and biodiversity, and may significantly change the patterns of bushfire and extreme weather events. The impacts of climate change will also place pressure on infrastructure including health care systems, water and electricity infrastructure and green infrastructures such as nature parks, urban tree and open spaces which will in turn lead to an increase in the greenhouse gas emissions. Climate change is also likely to place increased pressure on leaseholders and land management authorities to ensure more widespread and consistent application of best practice as a buffer against more extreme weather events.
However, climate change may also bring new opportunities. For example, rural land might be a focus for carbon sequestration activities such as planting more trees; restoring and extending native grasslands; assimilating organic waste from urban areas; and capturing environmental and economic benefits of increased soil carbon (NRM 2011). However, long-term improvement in soil health will depend on a planned approach to matching land capability to landuse.
Consumption [top ]
The ACT is located nationally within a developed market-based economy and consequently, its residents are exposed to high levels of marketing and advertising for goods and services. With very limited local manufacturing or industry, ACT residents are highly dependent on everyday commodities and services that are produced beyond its boundaries, nationally and internationally.
Canberrans are on average the most affluent people in Australia (Table 3) with relatively high disposable incomes to purchase luxury goods and services. In addition, since population growth in the ACT is estimated to be one of the highest levels in Australia (ACT Government 2009), the total environmental impact from ACT residents is continuing to grow, in turn leading to increased total waste generation.
Table 3. Average full time Ordinary time earnings Q4 2010
| State or Territory | Average Annual Wage |
|---|---|
| Tasmania | $57 808 |
| South Australia | $60 414 |
| Victoria | $64 620 |
| Queensland | $65 619 |
| Northern Territory | $65 962 |
| New South Wales | $66 565 |
| Western Australia | $73 148 |
| Auatralian Capital Territory | $76 367 |
Source: Living in Australia 2011, based on ABS 2010c data
At a global scale, our high rate of consumption, predominantly of goods sourced from outside of the ACT, results in a disproportionately high use of finite global resources, which is largely not evident to the end consumer.
One approach to quantifying and understanding the impact of our consumption is to conduct a Life Cycle Assessment of a consumer product (Figure 2). This measurement approach includes not only the obvious components like the energy to transport goods, but also incorporates all upstream inputs, like the energy used to make the truck that transports the goods and the land and water used for mining and processing the iron ore used in producing the steel for the truck (Ryan 2011:1).
Figure 2. A generalised life cycle of a consumer product used in life cycle assessments
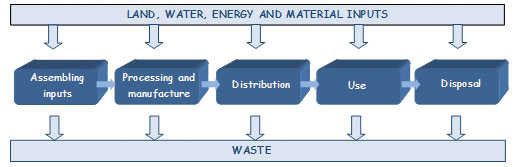
Source: Ryan 2011:3
Environmental impacts of consumer products vary both between the type and the intensity of the impact. For example, disposal of electronic equipment, or "e-waste", can often result in high levels of toxicity, whereas purchasing of a paper book can lead to loss of forests and ecosystems due to procurement of paper through unsustainable forestry. Life cycle assessments are often used to target "hotspots" of environmental damage in a product cycle, in order to reduce the environmental impact of our purchases. They can also provide consumers with information to allow them to reduce the environmental impacts of their consumption patterns.
An alternative approach to measuring the environmental consequences of our consumption is to assess the total ecological footprints of the consumer over a period of time. An ecological footprint is a measure of quantity of land and water needed to support the lifestyles of an individual or group of individuals, in relation to the carrying capacity of the world (Murray and Dey 2010:6). Australia has some of the highest per-capita footprints in the developed world. This is mainly because as a wealthy nation, we consume many goods and services, use a carbon-intensive electricity system that is predominantly supplied by coal-fired power stations, and rely on agricultural systems that use a great deal of land in a relatively dry country (Murray and Dey 2011).
The total Ecological Footprint of all ACT residents is approximately 3.2 million global hectares, or equivalent to nearly 14 times the geographical area of the ACT. Electricity supply (including the area of land and water needed to sequester the resulting carbon emissions) and residential building construction are key items contributing to the ACT's Ecological Footprint (Murray and Dey 2011). Despite stabilised impacts from the use of electricity, gas and vehicle fuel by households over the last few years, the overall per person footprint in the ACT continues to increase (Figure 3).
Figure 3. ACT 2008-09 Ecological Footprint
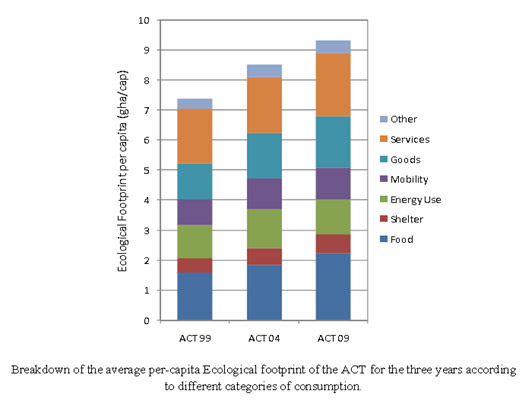
Source: Dey 2010:5
The local impacts of ACT consumption include the loss of open space and agricultural land to housing development and increased traffic congestion or increased time spent on shopping for goods from a growing number of retail outlets (Murray and Dey 2011). Additionally, overconsumption of food and subsequent health complications may put pressure on health facilities (Murray and Dey 2011).
The impacts of the ACT's high consumption and associated large ecological footprint are predominantly felt outside of our borders. ACT consumption of food requires large areas of land for crops, pasture and forest located elsewhere in Australia or elsewhere in the world. This results in land clearing and modification, placing pressure on ecosystems outside ACT borders (Murray and Dey 2011). In a global economy, ACT consumption also places pressure on environment and societies in other countries. For example, goods purchased in the ACT may be produced in countries or companies with unhealthy working conditions and poorly regulated environmental pollution practices, particularly in less developed countries where labour is often cheaper. In the longer term, ACT consumption also plays a role in generating global impacts, driving climate change through greenhouse gas emissions, reducing and polluting water supplies and depleting global biodiversity (Murray and Dey 2011).
Reducing our ecological footprint will be a complex and challenging undertaking. Efforts will often require balancing competing priorities and making trade-offs. For example, on one hand, the construction industry makes a large contribution to the ACT footprint but on the other, it provides local employment. Further, many different yet interrelated factors, including a mix of broad socio-political, economic and legal systems, shape our consumption decisions. Our consumption decisions, as noted above, may be determined by our location in an affluent city within a market-based economy, where constant exposure to advertising of products and services is the norm. More personal factors such as our values and attitudes, personality, social connections and experience comprise another set of factors that would drive our consumption pattern. Finally, household or family structure and decision-making around purchasing, may be the other factors influencing patterns of consumption (Pearson 2011).
Hence, no single unified approach to understanding these factors and taking actions to alter the consumption behaviour is available. Perhaps the most promising approaches bring together insights from various fields, including psychology and social marketing. These can shed light on motivations and barriers to behavioural change and encourage collaboration between citizens, governments, business and other non-government sectors (UK Cabinet Office 2011).
References [top ]
ABC News 2010. Dust Blankets ACT, NSW. Australian Broadcasting Corporation. Sydney. http://www.abc.net.au/news/2009-09-22/dust-blankets-act-nsw/1438110 (accessed 12/10/11)
ABS 2010a. 3236.0 - Household and Family Projections 2006 to 2031. Australian Bureau of Statistics. Australian Government. Canberra. http://www.abs.gov.au/AUSSTATS/abs@.nsf/DetailsPage/3236.02006%20to%202031?OpenDocument (accessed 18/11/11)
ABS 2010b. 1308.8 - Statistical Information on the ACT and Region. Australian Bureau of Statistics. Australian Government. Canberra. www.abs.gov.au/ausstats/abs@.nsf/0/E616CB56795B8EDBCA2577EE000C9B7A?opendocument. (accessed 9/11/11)
ABS 2010c. 6302.0 - Average Weekly Earnings Nov 2010. Australian Bureau of Statistics. Australian Government. Canberra. http://www.ausstats.abs.gov.au/ausstats/meisubs.nsf/0/967E1D61D897A8CDCA257840000F7025/$File/63020_nov%202010.pdf (accessed 28/11/11)
ABS 2011. 4842.55.001 - Overweight and Obesity in Adults in Australia: A Snapshot, 2007-08. Australian Bureau of Statistics. Australian Government. Canberra. http://www.abs.gov.au/AUSSTATS/subscriber.nsf/log?openagent&4842055001do001_200708.xls&4842.0.55.001&Data%20Cubes&90855D4FAE8A464BCA25789C0023DC44&0&2007%9608&27.05.2011&Latest (accessed 28/11/11)
ACT Government 2009. ACT Population Projections 2007 to 2056. Canberra. http://www.cmd.act.gov.au/__data/assets/pdf_file/0010/119719/act-population-projections-2007-2056.pdf (accessed 12/9/11)
ACT Government 2010a. Time to Talk: Canberra 2030 - Population. Canberra. http://timetotalk.act.gov.au/storage/bf77c700a50698a0a623f9ab9c7d2310.31-08%20Population.pdf (accessed 17/9/11)
ACT Government 2010b. ACT Government Infrastructure Plan 2010. http://www.cmd.act.gov.au/__data/assets/http://www.cmd.act.gov.au/__data/assets/pdf_file/0019/133165/act-govt-infrastructure-plan.pdf (accessed 20/9/11)
ACT Government 2010c.Time to talk. Canberra 2030 - Health and Wellbeing Background Report. Canberra. http://timetotalk.act.gov.au/storage/Planning_Background06_Health.pdf (accessed 24/9/11)
ACT Government 2010d. Time to Talk, Canberra 2030 - Getting Around. Canberra. http://timetotalk.act.gov.au/storage/65c9530b44b11463a4240ea3504373d1.31-08%20Getting%20Around.pdf (accessed 12/9/11)
ACT Treasury 2011. Full Time Adult Average Weekly Ordinary Time Earnings. ACT Government. Canberra. http://www.treasury.act.gov.au/snapshot/AWOTE.pdf (accessed 11/11/11)
ACTEW 2007. Water Security for the ACT and Region: Recommendations to the ACT Government. Canberra. http://www.legassembly.act.gov.au/downloads/submissions/10%20Water%20use%20-%20ACTEW%20Corporation.pdf (accessed 12/11/11)
ACTPLA 2008. Territory Plan. ACT Planning and Land Authority. ACT Government. Canberra. http://www.legislation.act.gov.au/ni/2008-27/current/default.asp (accessed 23/9/11)
ACTPLA 2010. Urban Form Analysis. Canberra's Sustainability Performance: Technical Report. ACT Planning and Land Authority. ACT Government. Canberra. http://www.actpla.act.gov.au/__data/assets/pdf_file/0013/21046/ACTPLA_Urban_Form_Scenarios_Final_Report_WEB.pdf (accessed 21/4/11)
ACTPS 2011. Governing the City State: ACT Public Service Review Final Report. ACT Government. Canberra. http://www.det.act.gov.au/?a=188329 (accessed 12/10/11)
AIHW 2011. Health and the Environment: A Compilation of Evidence. Australian Institute of Health and Welfare. Canberra. http://www.aihw.gov.au/publication-detail/?id=10737418534 (accessed 21/11/11)
BOM and CSIRO 2010. State of the Climate. Bureau of Meteorology and Commonwealth Scientific and Industrial Research Organisation. Australian Government. Canberra. http://www.bom.gov.au/inside/eiab/State-of-climate-2010-updated.pdf (accessed 22/10/11)
CMD 2010a. ACT Population Projections for Suburbs and Districts, 2007 to 2019 and New South Wales Statistical Local Area Population Projections 2006 - 2036. Chief Ministers Department, ACT Government. Canberra
CMD 2010b. ACT Infrastructure Plan 2010. Chief Minister's Department. ACT Government. Canberra. http://www.cmd.act.gov.au/__data/assets/pdf_file/0019/133165/act-govt-infrastructure-plan.pdf (accessed 4/7/11)
CommSec 2009. Australian Homes are Biggest in the World. Economic Insights. http://images.comsec.com.au/ipo/UploadedImages/craigjames3f6189175551497fada1a4769f74d09c.pdf. (accessed 9/11/11)
Crean,S. 2011. Budget 2011-12: Investing In Regional Australia. Ministry for Regional Australia. Regional Development and Local Government. Australian Government. Canberra. http://cache.treasury.gov.au/budget/2011-12/content/download/ms_rural_and_regional.pdf (accessed 14/10/11)
De Vries, S., Verheij, R.A., and Groenewegen, P. 2003. Natural Environments - Healthy Environments? An Exploratory Analysis of the Relationship Between Greenspace and Health. Environment and Planning. 35:1717-1731
Davis, C. and Lindesay, J. 2011. Weather and Climate of the ACT 2007-11 and Decadal Trends. Report for the Office of the Commissioner for Sustainability and the Environment. Canberra
Dey, C. 2010. The 2008-09 Ecological Footprint of the Population of the ACT. Integrated Sustainability Analysis. University of Sydney. Sydney. http://www.environmentcommissioner.act.gov.au/__data/assets/pdf_file/0015/211182/ACT_Ecological_Footprint_08-09_final_report.pdf (assessed 22/6/11)
Engineers Australia 2010. Infrastructure Report Card: Water. Canberra. http://www.engineersaustralia.org.au/shadomx/apps/fms/fmsdownload.cfm?file_uuid=C8F26346-DB84-45EF-E104-B53E726D4A61&siteName=ieaust (accessed 20/6/11)
Jackson, N. 2008. Population Change and Sustainable Futures: Imagining the ACT. 1 December 2008. Commissioned by the ACT Government for the Sustainable Future Program. Canberra http://www.actpla.act.gov.au/__data/assets/pdf_file/0011/12431/Paper_-_Natalie_Jackson.pdf (accessed 12/10/11)
Johnston, R. 2011. Landuse and Transport in the ACT. Report for the ACT Office of the Commissioner for Sustainability and the Environment. Canberra. unpublished
Kelly, J.F. 2011. The Housing We'd Choose. Grattan Institute. Melbourne. http://www.grattan.edu.au/publications/090_cities_report_housing_market.pdf (accessed 8/7/11)
Living in Australia 2011. Wage Facts. http://www.livingin-australia.com/salaries-australia/ (accessed 18/11/11)
Murray, J. and Dey,C. 2011. Canberra's Ecological Footprint: What does it mean?.Report for the ACT Office of the Commissioner for the Environment and Sustainability. Canberra
Nielsen, T.S., Hansen, K.B. 2007. Do Green Areas Affect Health? Results from a Danish Survey on the Use of Green Areas and Health Indicators. Health Place. 13:839-850
NRMC 2009. Bush Capital Legacy: Iconic City, Iconic Natural Assets - Plan for Managing the Natural Resources of the ACT. Natural Resource Management Council. Canberra. http://www.actnrmcouncil.org.au/files/NRMplan.pdf (accessed 24/10/11)
OCSE 2011. Facing the challenges - Positioning Our Nature Reserves for the 21st Century. Report on Canberra Nature Park (nature reserves); Molonglo River Corridor (nature reserves) and Googong Foreshores Investigation. Office of the Commissioner for Sustainability and the Environment. Canberra. http://www.envcomm.act.gov.au/__data/assets/pdf_file/0006/234987/Part_I_Report.pdf (accessed 22/10/11)
Pearson, D. 2011. Exploring Individual Values and Attitudes For a More Sustainable Canberra: the Example of Food. Report for the ACT Office of the Commissioner of Sustainability and the Environment. Canberra
RDA ACT 2010. ACT Strategic Regional Plan 2010. Regional Development Australia - ACT. Canberra. http://rdaact.org.au/wp-content/uploads/2011/03/RDA_ACT_regional_plan_20102.pdf (accessed 18/8/11)
Ryan, S. 2011. Buying Choices for a More Sustainable Canberra. Report for the ACT Commissioner for Sustainability and the Environment. http://www.envcomm.act.gov.au/__data/assets/pdf_file/0011/230312/BUYING_CHOICES.pdf (accessed 20/10/11)
UK Cabinet Office 2011. Better Choices. Better Deals: Consumers Powering Growth. Behavioural Insights Team. http://www.cabinetoffice.gov.uk/sites/default/files/resources/better-choices-better-deals.pdf (accessed 20/10/11)
Webb, B. 2011. Impacts of Climate on the Canberra Nature Park: Risks and Responses. Report for the ACT Office of the Commissioner for Sustainability and the Environment. ANU Climate Change Institute and Fenner School of Environment and Society. Australian National University. Canberra. http://www.envcomm.act.gov.au/__data/assets/pdf_file/0004/220477/OCSE_ANU_paper_climate_CNP.pdf (accessed 7/8/11)
Other data sources
In addition to these published reports, data for this paper were also sourced from:
- Environment Protection Agency (EPA) - now part of Environment and Sustainable Development Directorate- ESDD


Share this page: