ACT State of the Environment Report 2011
Accurate, timely & accessible information for the community regarding the condition of the environment, underlying pressures, and sustainability trends.
THEME: Air
Indicator cluster: Local air quality
Download: Indicator cluster: Local air quality.pdf
The indicators for this cluster are:
- Local air quality (C) - includes carbon monoxide, nitrogen dioxide, photochemical oxidants (such as ozone), sulfur dioxide, lead, particles as PM10, particles as PM2.5 (NEPM requirements) and also volatile organic compounds;
- Vehicle emissions (P) - type and volume of vehicle emissions;
- Other emissions (P) - type and volume of other emissions, including particulates and smoke from fires;
- Air emissions and health impacts (I) - health impacts from local air emissions; and
- Air quality management (R) - effectiveness of air quality management responses - also linked to the Natural hazards indicator cluster in the People theme.
Condition indicators (C) present data that tell us the state of the environment at any particular time.
Pressure indicators (P) present data for the main human activities that could potentially adversely affect the condition of the environment.
Impact indicators (I) present data on the effect that environmental changes have on environmental or human health.
Response indicators (R) present data about the main things we are doing to alleviate pressures, or to improve the condition of the environment.
Summary [top  ]
]
Local air quality refers to the air quality outdoors over the ACT - that is, in the ACT airshed. Local air quality has met the National Environment Protection Measure (NEPM) standards for carbon monoxide, nitrogen dioxide and ozone during the reporting period, 2007-2011. Carbon monoxide emissions have decreased slightly from the levels reported in the 2007-08 ACT State of the Environment Report. Particulate matter continues to be a concern because the NEPM standard for particulates smaller than 10 micrometres was not met in 2009.
Motor vehicles remain the dominant source of air pollutant emissions in the ACT. Particulate matter exceedances are generally caused by woodsmoke from point sources in an area, and do not affect the whole ACT airshed. However, the whole airshed can be affected by events such as bushfires and duststorms.
No quantitative data are available on health impacts of outdoor air emissions in the ACT, but studies across Australia and the world have found that the most common health impacts of local air pollution are respiratory and cardiovascular disorders (both chronic and acute). A recent report identified negative health effects occurring below the current NEPM Ambient Air Quality standards for carbon monoxide, oxides of nitrogen and ozone.
During the reporting period the ACT Government continued to implement programs focused on reducing air pollution emitted from vehicles and wood heaters. These are likely to have contributed to the continuing small reductions in carbon monoxide emissions and long-term declines in some particulate matter (PM10) concentrations.
Introduction [top  ]
]
The emission of pollutants into the atmosphere can lead to concentrations of gases and particulate matter that can have adverse impacts on some ecosystems and human health. The ACT Government has been monitoring ambient air quality in Canberra since the early 1990s. Compliance with the National Environment Protection Measures (NEPM) (EPHC 2011) requires the ACT Government to monitor carbon monoxide, nitrogen dioxide, ozone and airborne particles. Two sizes of airborne particles are measured: less than 10 micrometres (microns) and less than 2.5 microns in diameter, known as PM10 and PM2.5 respectively. The monitoring of lead ceased in July 2002 following the phase-out of leaded fuel by 1 January 2002, with ambient air lead concentrations being less than 2% of the standard. The ACT Government has never monitored sulfur dioxide because of the absence of heavy industry in ACT (EPA 2009).
Condition indicators [top  ]
]
Air quality in the ACT is measured and monitored by the ACT Government and assessed against NEPM standards1 (Table 1).
Table 1. NEPM standards and goals to be achieved by 2008
| Pollutant | Averaging period | Maximum concentration relative to volume of air | Maximum allowable exceedances |
|---|---|---|---|
| Airborne particles (as PM10) | 1 day | 50 µg/m3 | 5 days per year |
| Airborne particles (as PM2.5) - reporting standard only | 1 day | 25 µg/m3 | Gather sufficient data nationally to facilitate a review of Advisory Reporting Standard. |
| 1 year | 8 µg/m3 | ||
| Carbon monoxide | 8 hours | 9.0 ppm | 1 day per year |
| Nitrogen dioxide | 1 hour | 0.12 ppm | 1 day per year |
| 1 year | 0.03 ppm | None | |
| Ozone (photochemical oxidants) | 1 hour | 0.10 ppm | 1 day per year |
| 4 hours | 0.08 ppm | 1 day per year |
Source: NEPC 2010
ACT Government Health Directorate staff measure air quality at the performance monitoring station at Monash in the Tuggeranong Valley, southern ACT, which has been operational since 1996. During the reporting period the population of Canberra increased so that the ACT now requires a second outdoor air performance monitoring station for reporting relative to the NEPM (EPA 2010a). A monitoring station at Civic, in central Canberra, is currently providing data until a more suitable performance monitoring station can be established, possibly in the north of the ACT. Until a second ambient air quality NEPM performance monitoring station can be established, data from the Civic performance monitoring station, through not ideally located, will be used for annual report purposes.
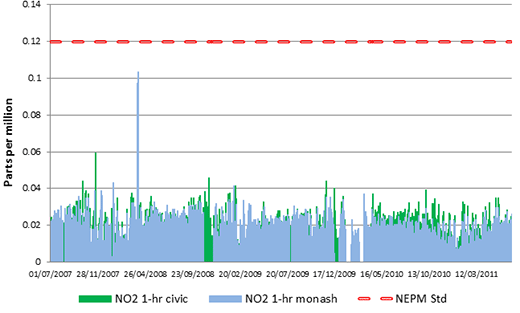
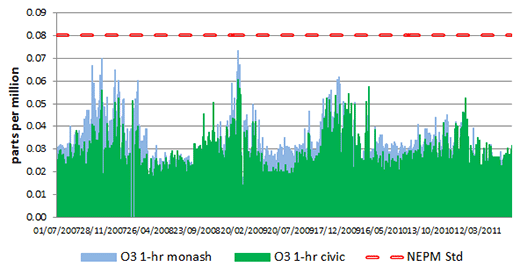
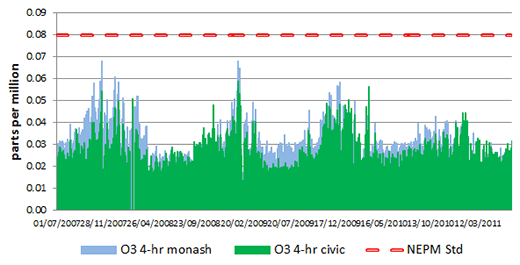
Air quality in the ACT met NEPM standards for carbon monoxide, nitrogen dioxide and ozone during the reporting period. Long-term nitrogen dioxide data (Figure 1) and ozone data (Figures 2 and 3) show no discernible trend, and are all below the thresholds set by the NEPM standards. Gaps in the record for nitrogen dioxide were caused by failure of equipment at both stations in 2010.
Figure 1: Nitrogen dioxide concentrations measured at Monash and Civic monitoring stations
Source: Environment Protection Authority
Figure 2: Ozone - 1-hour concentrations measured at Monash and Civic monitoring stations
Source: Environment Protection Authority
Figure 3: Ozone - 4-hour concentrations measured at Monash and Civic monitoring stations
Source: Environment Protection Authority
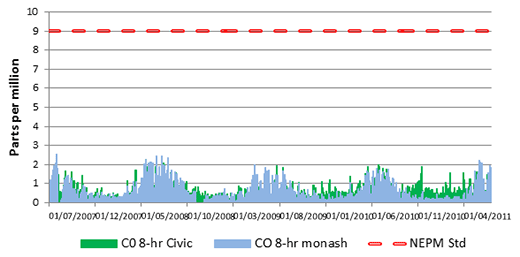
There are seasonal fluctuations in carbon monoxide concentrations (Figure 4), with higher values in the winter. Carbon monoxide concentrations have fallen slightly since July 2007, continuing a trend reported in the 2007-08 ACT State of the Environment Report.
Figure 4: Carbon monoxide concentrations measured at Monash and Civic monitoring stations
Source: Environment Protection Authority
As noted in previous reporting periods, monitoring indicates that particulate matter is the only NEPM pollutant of concern in the Canberra airshed. Particulate matter is a product of point source pollution and does not necessarily affect the whole ACT airshed. Residential wood smoke during stable winter conditions causes air quality problems in many Australian cities and towns. In the Tuggeranong Valley, as in other areas with similar air quality issues, topography, low temperatures, low wind speeds and higher atmospheric moisture content prevent the wood smoke from dispersing (Bridgman 2009).
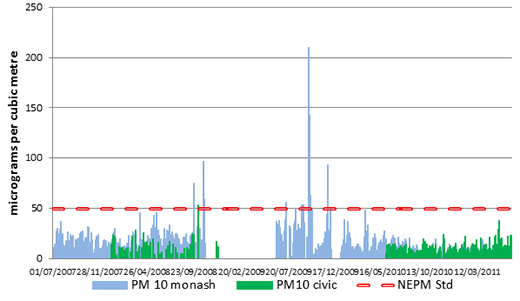
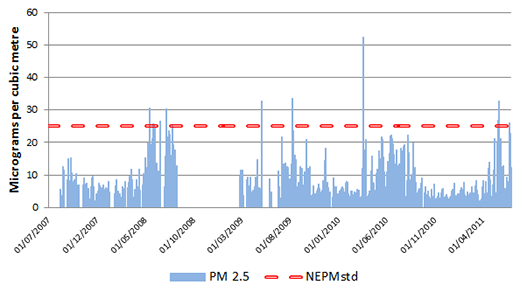
The available data for the current reporting period (2007-2011) record 17 exceedances² of the PM10 threshold. Compliance with the NEPM goal limits PM 10 exceedances to 5 days per year. This goal was not met in 2009, with 9 exceedances recorded at the Monash site (Figure 5). The available data for PM2.5 record 19 exceedances³ of the threshold during the reporting period (Figure 6). The NEPM goal for PM2.5 is to collect sufficient data to facilitate a review of the PM2.5 standards (Table 1).
Monitoring data for PM10 and PM2.5 (Figures 5 and 6) are incomplete from early August 2008 up till early June 2009 (at Monash) or May 2010 (at Civic). At the Monash monitoring station, gaps in the record result both from a range of problems with the measuring equipment and from the station being closed for a short time in 2008 for relocation (EPA 2011). Monitoring of PM10 at the Civic monitoring station was affected by equipment failure from late 2008 to mid 2010 (EPA 2011).
Figure 5: PM10 concentrations measured at Monash and Civic monitoring stations
Source: Environment Protection Authority
Figure 6: PM2.5 concentrations measured at Monash monitoring station
Source: Environment Protection Authority
Pressure indicators [top  ]
]
The sources and volumes of emissions in ACT are assessed in comparison to the National Pollutant Inventory (NPI) (DSEWPaC 2010a), last updated in 1999. Updating this inventory may identify changes or improvements since then, which in turn may assist in managing air pollution.
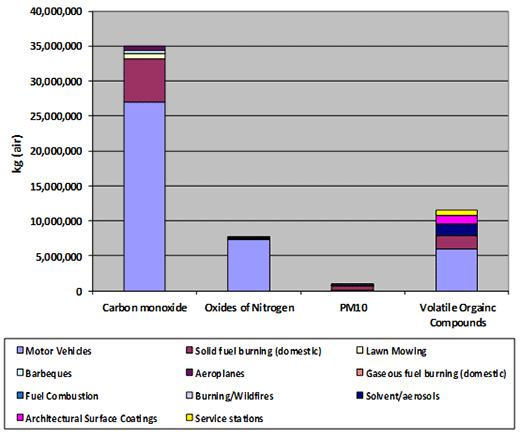
According to the NPI, carbon monoxide is the largest component to air pollution in the ACT, and motor vehicles are the main source, contributing 75% of emissions (Figure 7). Wood heaters remain the largest source of PM10 (Figure 7).
Figure 7: Sources and volumes of ACT air contaminant emissions
Source: Data from DSWEPAC 2010a
Table 2. Sources of air emissions
| Pollutant | Sources | ACT emission sources |
|---|---|---|
| Carbon monoxide |
|
|
| Oxides of nitrogen |
|
|
| Particulate matter |
|
|
| Ozone |
|
The major sources of volatile organic compounds in the ACT are:
|
Concentrations of all contaminants in air, and hence air quality in general, depend not only on rates of emission but also on prevailing weather conditions and local topography. On a windy day contaminants can be dispersed quickly and concentrations from a given emission source can be lower than on days when there is little wind to move them, when they can be trapped by the landscape and consequently reach higher concentrations.
Future climate scenarios predict an increased risk of fire and drought; these are likely to have an impact on the air quality of the ACT (see Climate vulnerability indicator cluster paper).
Impact indicators [top  ]
]
The most common health impacts of outdoor air pollution are respiratory and cardiovascular disorders (both chronic and acute) (NEPC 2010). While there are no specific data on direct health impacts of air pollution in the ACT, a number of national and international studies have identified health impacts of air pollutants (Table 3).
Table 3. Potential health impacts of air pollutants
| Pollutant | Potential health effects | Groups at higher risk |
|---|---|---|
| Carbon monoxide |
|
|
| Oxides of nitrogen |
|
|
| Particulate matter |
|
|
| Ozone |
|
|
Source: Compiled from AIHW 2011 and NEPC 2010
The recent State of Australian Cities 2010 report (ADIT 2010) found that pollution of urban air is an underlying cause of 2.3% of all deaths and 1% of disability-adjusted life years in Australia. Respiratory conditions were the most commonly reported health problems for children and young adults (ADIT 2010).
While no data are available for Australia or the ACT, in New Zealand it was estimated that up to 85% of health costs related to air pollution were caused by long-term exposure to particulate matter (PM10) in the air. A European study by the World Health Organization also claimed that PM2.5 significantly increases mortality (AIHW 2011).
The National Environment Protection (Ambient Air Quality) Measure aims to reduce the potential health impacts of pollutants in the community by setting standards. However, the recent Review of the National Environment Protection (Ambient Air Quality) Measure Discussion Paper Air Quality Standards (NEPC 2010) identified Australian studies that indicated health effects are occurring below the current NEPM standards for carbon monoxide, oxides of nitrogen and ozone. In particular:
- nitrogen dioxide concentrations from 0.018 to 0.036 ppm (24-hour average) have been associated with increased hospital admissions and emergency department attendance; and
- significant health effects have been observed at ozone concentrations below the current 1-hour and 4-hour standards. Ozone that occurs near the earth’s surface is not emitted directly from sources, but is formed when oxides of nitrogen react with volatile organic compounds in the presence of sunlight (Table 2). The health evidence suggests that health effects from ozone in ambient air are observed in relatively long averaging periods, such as over 8 hours.
The review report (NEPC 2010) also found that, for a number of health outcomes related to particulate matter , there is no lower threshold below which various adverse effects would not be observed. This poses a significant challenge for proposing standards for particulate matter that would protect the community from potential negative health effects.
Response indicators [top  ]
]
In the ACT, air quality standards are legislated through the Environment Protection Act 1997 (ACT Government 2011a). This Act aims to ensure national standards for air quality are met and environmental harm from local air pollutants is minimised, while still permitting some activities that potentially emit pollutants. Under the Act, actions that significantly contribute to air emissions are regulated or prohibited. This includes banning the burning of certain substances and regulating activities that may generate dust, chemical spray or fumes . The Act places the responsibility of care for the environment on all ACT residents and businesses, requiring them to take all practicable and reasonable steps to prevent or minimise environmental harm or environmental nuisance.
The Air Environment Protection Policy 1999 (ACT Government 1999) contains information and policies relating to the management of ambient air quality and pollutant emissions to the atmosphere in the ACT. The Policy covers activities in the following categories:
- industrial, including commercial;
- transportation; and
- domestic, social, rural and open space management.
Potential air emissions from significant developments (e.g. new suburbs or industrial projects) are assessed and approved by the ACT Environment Protection Authority (EPA) as part of the development application process. The EPA also monitors and assesses air quality from specific events (e.g. industrial fires, Summernats car festival). Previous State of the Environment Reports have recommended use of mobile monitoring to measure ambient air quality at hotspots such as intersections. The feasibility of mobile ambient air monitoring should be investigated. Given the recommendation of the 2004 Environment Protection Act Review (Environment ACT 2004) to consider whether regulation of air pollution should be expanded, it may also be appropriate to review the Air Environment Protection Policy (ACT Government 1999).
The ACT Government, with other jurisdictions, is working on national standards and approaches for reducing emissions of air pollutants, through the Air Quality Working Group of the national Environment Protection and Heritage Council (EPHC). These standards and approaches focus on emissions of particles and of precursors for ozone formation, particularly from the product and equipment sectors, including wood heaters, small engines, surface coatings and non-road engines. The recent Review of the National Environment Protection (Ambient Air Quality) Measure Discussion Paper Air Quality Standards (NEPC 2010) also identified that it may be useful to lower the thresholds for the standards for carbon monoxide, oxides of nitrogen, and ozone, because of reports of health effects occurring below the current NEPM Ambient Air Quality standards. This Report is soon to be reviewed by the EPHC, and the review’s recommendations will be prioritised and responded to through the development of the National Plan for Clean Air.
Following the recommendation from the 2007-08 ACT State of the Environment Report, the EPA released the first annual outdoor ambient ACT Air Quality Report in July 2010 (EPA 2010a), with information and data derived from air quality monitoring in the ACT, compared against the requirements of the NEPM. The report is available on the ACT EPA website.
Although data on sources and volumes of emissions for Australian jurisdictions (DSEWPaC 2010a) have not been updated since 1999, it is likely that motor vehicles and wood heaters remain the largest source of air pollutants in the ACT.
Woodsmoke emission reduction measures
The ACT Government acknowledges that woodsmoke can be a problem in some areas, and continues to implement education and enforcement programs to address the issue (EPA 2010a). A campaign called Don’t Burn Tonight has run from 1 June to 31 August every year since 2001, encouraging Canberrans to use alternative heating on cold still nights when smoke is unlikely to clear quickly.
The Environment Protection Act 1997 sets out Canberrans’ responsibility to minimise air pollution. Guidelines for Acceptable Smoke Emissions (outlined on EPA website) allow a house-chimney to smoke for up to 30 minutes when a wood-fire is first lit, and for up to 20 minutes after refuelling. At other times there should be little or no smoke from a properly operated wood heater. There are penalties set out under the Act for non-compliance.
The Environment Protection Regulation 2005 (ACT Government, 2011b) regulates the sale and supply of firewood in the ACT. A list of authorised firewood merchants is available on the EPA website (EPA).
Since 2004 the ACT Government has run the Wood Heater Replacement Program, which offers a subsidy of between $600 and $800 to eligible householders for replacing wood heaters with a new mains-supplied gas heater. EPA data indicate that during the reporting period (2007-2011) more than 400 wood heaters have been removed, with nearly 900 wood heaters removed since 2004 (data from EPA). The rebate currently excludes replacement of wood heaters with electric heating systems. There is some discussion that electric heating can contribute more to emissions, particularly via sources related to coal-powered electricity-generation, than wood heaters. The situation needs to be clarified.
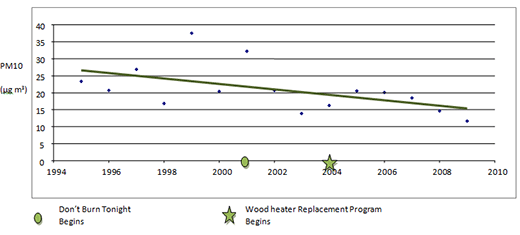
With the significant gaps in data for PM10 and PM2.5 emissions during the reporting period, it is not possible to determine whether there has been a reduction in air contamination by particulate matter over 2007-2011. However, long-term trends indicate a decrease in PM10 levels beginning in 2002 (Bridgman 2009), as shown in Figure 8. Between 1999 and 2008, the percentage of households in Canberra using wood heaters dropped from 5.7% to 3.0% (ABS 2008a). Further, the 95th percentile for PM10 at the Monash recording station has dropped from 56.5 µg/m³ in 2001 to 23.5 µg/m³ in 2010 (EPA 2011).
Figure 8. Daily PM10 - average winter concentrations, 1995-2009 at Monash recording station (micrograms per cubic metre of air)
Source: Adapted from Bridgman 2009
Emissions from woodsmoke have also been managed though planning guidelines. In some instances, air quality is measured in ‘greenfield’ sites as part of the development process to identify potential air pollutants. This has led to air quality management initiatives being integrated with planning and development. For instance, crown leases in East O’Malley and Dunlop require written approval by the ACT Government for installation or use of solid fuel heating systems. Such restrictions are also likely to be put in place in the new development of Molonglo. It would be valuable for air quality measurements to be required for all new ‘greenfield’ developments to ensure potential air emissions detrimental to human health and the environment can be identified and proactively managed. This approach also recognises the changing circumstances of higher urban density and increasing population. The 2003 State of Environment Report noted good air quality was partly attributable to the absence of high-density urban development, and the relatively small population of the ACT.
The EPA recently reviewed existing programs aimed at reducing woodsmoke in the ambient air of the Tuggeranong Valley (EPA). The review found that more could be done to reduce emissions of woodsmoke from household wood heaters. If the ACT Government were to require the installation of wood heaters to be certified to meet Australian and New Zealand standards for particle emissions factors (AS/NZS 4013 - Determination of particle emissions factors), it would make installation of non-certified wood heaters illegal under the Building Regulations. That would also expedite the removal from service of non-certified wood heaters. This regulation is currently in force in Tasmania. It may be valuable for the ACT Government to examine implementing such a standard.
Motor vehicle emissions reduction measures
National legislation governs standards for car exhaust emissions. The first such pollution-control legislation, Australian Design Rule (ADR) 37/00, came into force in 1986. Cars made in Australia from 1997 onwards must comply with increasingly strict controls (ADIT 2009). In 2008, the ADR 79/02 was introduced (to be fully implemented by July 2010), which limits exhaust emissions from petrol-fuelled vehicles to 1.0 g carbon monoxide/km, 0.08 g nitrogen oxides/km and 0.1 g hydrocarbons/km (ADIT 2008). National standards have also reduced carbon dioxide emissions by 2.7%, from 252.4 g/km in 2002 to 212.6 g/km in 2010 (NTC 2011).
The Green Vehicle Guide (Commonwealth of Australia 2010) is a national website developed to provide information about the environmental performance of new light vehicles sold in Australia since mid-2004. It is updated regularly as new models come onto the market. A standard petrol engine passenger car meeting the current emission standard receives a mid-point air pollution rating (5/10) on the Green Vehicle Guide.
In September 2008, the ACT Government introduced the Green Vehicles Stamp Duty Scheme (TAMS) which offers differential stamp duty costs for new vehicles based on their performance in emitting greenhouse gases. The scheme uses a combination of two ratings from the Australian Government’s Green Vehicle Guide: a star rating based on the car’s greenhouse-gas performance and a rating out of 20 based on the car’s air pollution emissions.
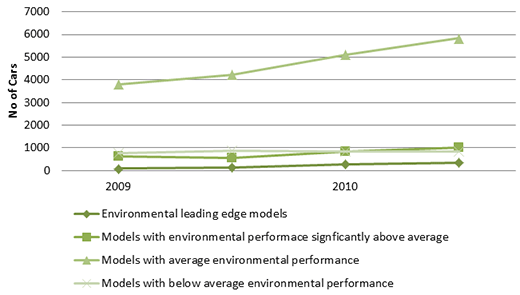
Figure 9. ACT Green Vehicle trends 2009-2010
Source: Adapted from data from TAMS
More vehicles rated as ‘environmentally leading edge’ were sold in the year following the start of the Green Vehicle Duty scheme. That increase may be attributable to a range of factors, including better knowledge of performance and efficiency through the Green Vehicle Guide, greater availability of efficient vehicles, and higher fuel prices. Whatever the reasons, the outcome is likely to be benefiting the local air quality in the ACT. However, vehicles with above-average environmental performance still made up less than 20% of the total ACT fleet in 2009-2010 (Figure 9).
Concentrations of pollutants emitted by motor vehicles are affected not only by the emissions per vehicle but also by the number of vehicles, the total distance travelled and the age of vehicles. The total number of vehicles registered in the ACT rose by a further 15.6% between 2005 (219,552) and 2010 (253,848) (ABS 2011a). The total distance travelled had decreased during the last reporting period (to June 2007) but has increased during this reporting period, July 2007 to June 2011 (ABS 2011b).
Overall, the efforts of the Australian and ACT governments to reduce emissions are likely to have contributed to the small reduction in carbon monoxide emissions seen over the reporting period. However, as discussed, other factors have also contributed to this result.
Footnotes [top  ]
]
1. Air quality complies with standards if the number of exceedances of the standard is no more than the number specified in Schedule 2 of the NEPM, and data availability was at least 75% in each quarter of the year. Air quality is assessed as 'not demonstrated' if the data collected have been insufficient to demonstrate that the standards and goal have been met or not met.
2. 5 exceedances in 2007; 3 in 2008 and 9 in 2009.
3. 8 exceedances in 2007; 6 in 2008 and 2 in 2009, 3 in 2011.
Glossary [top  ]
]
Airshed: a volume of air confined to a distinct geographic region, and within which contaminants are contained
Atmospheric inversion: when air near the ground surface is cold and air temperature increases with distance above the ground
Contaminant: a substance or organism that degrades an environment by being potentially toxic to people, animals or plants
Pollutant: a contaminant that demonstrably causes a negative effect
ppm: parts per million parts
Precursor: an ingredient or reagent necessary for a reaction between air contaminants
References [top  ]
]
ABS 2008a. Environmental Issues: Energy Use and Conservation, Cat # 4602.55.00. March 2008. Australian Bureau of Statistics, Canberra. http://www.ausstats.abs.gov.au/Ausstats/subscriber.nsf/0/C70521268BC1B3D4CA25750E001131EF/$File/4602055001_mar%202008.pdf (accessed 15/8/11)
ABS 2008b. Survey of Motor Vehicle Use Cat #9208.0. Oct 2007. Australian Bureau of Statistics, Canberra. http://www.ausstats.abs.gov.au/ausstats/subscriber.nsf/0/40BA5EB0863D18F8CA2574B2000FD936/$File/92080_12%20months%20ended%2031%20october%202007.pdf (accessed 16/6/11)
ABS 2011a. Motor Vehicle Census Cat # 9309.0. March 2010. Australian Bureau of Statistics, Canberra. http://www.ausstats.abs.gov.au/ausstats/subscriber.nsf/0/03CFF66BA0471A68CA257829001168D6/$File/93090_31%20Mar%202010.pdf (accessed 8/6/11)
ABS 2011b. Survey of Motor Vehicle Use, Australia, 12 months ended 31 October 2010, Cat # 9208.0. August 2011.Australian Bureau of Statistics, Canberra. http://www.abs.gov.au/ausstats/abs@.nsf/mf/9208.0 (accessed 8/6/11)
ACT Government 1999. Air Environment Protection Policy. Canberra. http://www.environment.act.gov.au/__data/assets/pdf_file/0007/198520/airenvprotectionpolicy.pdf (accessed 16/12/10)
ACT Government 2011a. Environment Protection Act 1997. Re-publication No 33, effective 17 March 2011, Canberra. http://www.legislation.act.gov.au/a/1997-92/current/pdf/1997-92.pdf (accessed 7/6/11)
ACT Government 2011b. Environment Protection Regulation 2005. Effective 1 July 2011, Canberra. http://www.legislation.act.gov.au/sl/2005-38/20110701-48485/pdf/2005-38.pdf (accessed 7/6/11)
ADIT 2008. Summary of Emission Requirements for New Petrol Passenger Cars In Australia 1972-2010. Australian Government Department of Infrastructure and Transport, Canberra. http://www.infrastructure.gov.au/roads/environment/impact/emission.aspx (accessed 26/5/11)
ADIT 2009. General Information - Emissions and ADRs. Australian Government Department of Infrastructure and Transport, Canberra. http://www.infrastructure.gov.au/roads/environment/impact/index.aspx (accessed 26/5/11)
ADIT 2010. State of Australian Cities 2010. Australian Department of Infrastructure and Transport, Canberra. http://www.infrastructure.gov.au/infrastructure/mcu/soac.aspx (accessed 28/8/11)
AIHW 2011. Health and Environment. Australian Institute of Health and Welfare, Commonwealth Government, Canberra. http://www.aihw.gov.au/WorkArea/DownloadAsset.aspx?id=10737418532&libID=10737418531 (accessed 29/4/11)
Bridgman, H. 2009. Preliminary Assessment of Wintertime Air Quality in Tuggeranong Valley. ACT Health, Canberra. http://health.act.gov.au/publications/reports/air-quality-in-winter-in-the-tuggeranong-valley-act (accessed 8/8/11)
Commonwealth of Australia 2010. Green Vehicle Guide website. http://www.greenvehicleguide.gov.au/GVGPublicUI/Home.aspx (accessed 26/5/11)
DSEWPaC 2010a. National Pollution Inventory - 2009/2010 Data within ACT - All Substances from All Sources. Australian Government Department of Sustainability, Environment, Water, Population and Communities, Canberra. http://www.npi.gov.au/npidata/action/load/emission-by-substance-result/criteria/state/ACT/year/2010/destination/ALL/source-type/ALL/subthreshold-data/Yes/substance-name/All?pageIndex=2&sort=substanceName&dir=asc&pageSize=10 (accessed 25/5/11)
DSEWPaC 2010b. State of the Air in Australia 1999-2008. Australian Government Department of Sustainability, Environment, Water, Population and Communities, Canberra. http://www.environment.gov.au/atmosphere/publications/state-of-the-air/pubs/state-of-the-air.pdf (accessed 26/5/11)
Environment ACT 2004. Review of the Environment Protection Act 1997 and the Role of the Environment Protection Authority Final Report. Department of Urban Services, ACT Government, Canberra. http://www.environment.act.gov.au/__data/assets/pdf_file/0011/198515/finalreportofreviewofepa0604.pdf (accessed 16/6/11)
EPA 2007. The ACT 2007 Ambient Air Quality Report against the Ambient Air Quality National Environment Protection Measure. ACT Government Environment Protection Authority, Canberra.
EPA 2009. The ACT 2008 Ambient Air Quality Report against the Ambient Air Quality National Environment Protection Measure. ACT Government Environment Protection Authority, Canberra.
EPA 2010a. ACT Air Quality Report 2009. ACT Government Environmental Protection Authority, Department of Environment, Climate Change, Energy and Water, Canberra. http://www.environment.act.gov.au/__data/assets/pdf_file/0010/198523/ACTAirQualityReport2009.pdf (accessed 14/4/11)
EPA 2010b. Air Pollution from Domestic Premises - Residential Information Sheet. Issued 12 April 2010. ACT Government Environment Protection Authority, Canberra. http://www.environment.act.gov.au/__data/assets/pdf_file/0012/144111/Air_Pollution_from_Domestic_Premises_12Ap10.pdf (accessed 7/6/11)
EPA 2011. ACT Air Quality Report 2010. ACT Government Environmental Protection Authority, Department of Environment, Climate Change, Energy and Water, Canberra. http://www.environment.act.gov.au/__data/assets/pdf_file/0016/231046/2010_ACT_report_DECCEW_Version_6_0.pdf (accessed 10/8/11)
EPHC 2011. Ambient air quality NEPM. Environment Protection and Heritage Council, Canberra. http://www.ephc.gov.au/sites/default/files/AAQ_NEPM__Ambient_Air_Quality_NEPM_Varied_scaleplus_Final_200305_1.pdf (accessed 18/11/11)
NEPC 2010. Review of the National Environment Protection (Ambient Air Quality) Measure Discussion Paper Air Quality Standards. National Environment Protection Council, Canberra. http://www.ephc.gov.au/sites/default/files/AAQ_DiscPpr__Review_of_the_AAQ_NEPM_Discussion_Paper_AQ_Standards_Final_201007.pdf (accessed 26/5/11)
NTC 2011. Carbon Dioxide Emissions from New Australian Light Vehicles 2010 - Information Paper. May 2011.National Transport Commission, Melbourne. http://www.ntc.gov.au/DocView.aspx?DocumentId=2135 (accessed 18/11/11)
Other data sources
In addition to these published reports, data for this paper were also sourced from:
- Environment Protection Authority, ACT Department of the Environment, Climate Change, Energy and Water, DECCEW - now Environment and Sustainable Development Directorate (ESDD)
- ACT Department of Territory and Municipal Services – now Territory and Municipal Services Directorate (TAMSD)


Share this page: