


ACT State of the Environment Report 2011
Accurate, timely & accessible information for the community regarding the condition of the environment, underlying pressures, and sustainability trends.
THEME: People
Indicator cluster: Waste
Download: Indicator cluster: Waste.pdf
The indicators for this cluster are:
- Waste (P) - waste totals and trends by sector;
- Movement of controlled waste (P) - includes packaging;
- Waste and human health (I) - includes any pollution incidents; and
- Waste management (R) - effectiveness of implementation of waste policy by ACT Government and includes volume of recycling and treatment of controlled and hazardous waste (including regulations).
Condition indicators (C) present data that tell us the state of the environment at any particular time.
Pressure indicators (P) present data about the main human activities that could potentially adversely affect the condition of the environment.
Impact indicators (I) present data on the effect that environmental changes have on environmental or human health.
Response indicators (R) present data about the main things we are doing to alleviate pressures, or to improve the condition of the environment.
Summary [top  ]
]
In 1996, the ACT Government set a goal of achieving a waste-free society through the adoption of the No Waste by 2010 Waste Management Strategy. Despite the gains achieved through this strategy, the total amount of waste processed in the ACT increased by 276,945 tonnes (34.7%) during the reporting period. Over this period, the amount of waste to landfill increased by 29.1% and the amount of resource recovery increased by 36.7%. Increases in construction and demolition wastes as well as commercial and industrial wastes (in particular additional deliveries of contaminated soil from the West Molonglo pond cleanup and elsewhere) have largely been the sources of the increase in waste to landfill.
While there has been progress in waste management programs for business, public place recycling and e-waste (electronic equipment), these remain important areas for future focus. Also, there has been little action towards diverting organic materials from landfill. Previous State of the Environment reports identified these as areas for future focus of waste reduction efforts.
The ACT is currently considering the Draft Sustainable Waste Strategy 2010-2025, successor to the No Waste by 2010 Waste Management Strategy. It is expected that the draft strategy may be approved by the end of 2011.
Introduction [top ]
The amount of urban waste generated and disposed of is an indication of the pressure that cities and consumption impose on the environment. Wastes potentially contaminate soils and groundwater and the land at their disposal sites.
The waste streams described in this report are from:
- construction and demolition;
- households;
- commercial and industrial sources;
- gardens and landcare; and
- controlled waste.
Condition indicators [top ]
There are no condition indicators for this indicator cluster. Long-term trends demonstrate that the amount of waste being generated in the ACT continues to increase and at a faster rate than population growth (Figure 1; and Table A1 in the Annex to this paper).
Figure 1. Total ACT population and total waste generated, 1993-94 to 2010-11
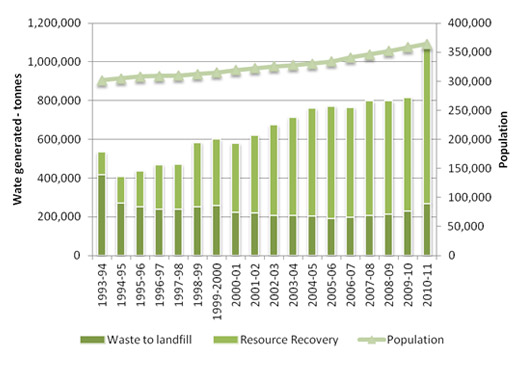
Source: TAMS 2011b
During the reporting period, the total amount of waste generated in the ACT (Figure 2) increased by 276,945 tonnes (34.7%). Both waste to landfill and resource recovery increased between 2009-10 and 2010-11.
Figure 2. Waste generation in the ACT, 2007-08 to 2010-11
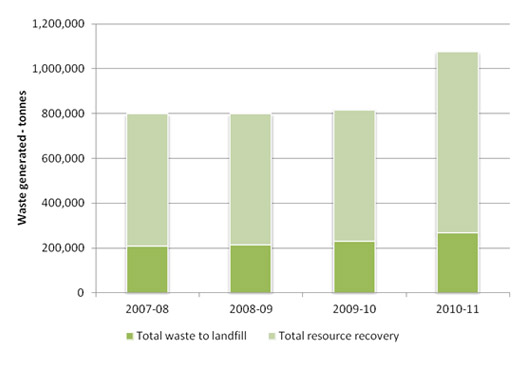
Source: TAMS 2011b
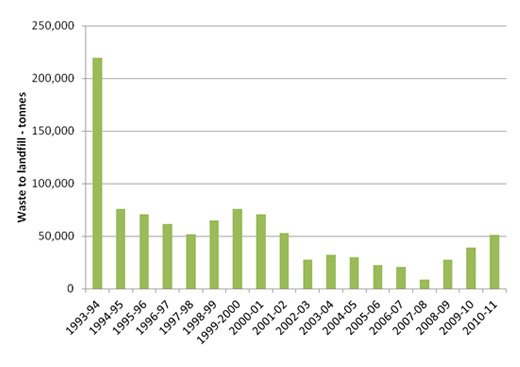
The amount of waste taken to landfill increased by 29.1% (Figure 3) during the reporting period. The large increase in waste to landfill in 2010-11 compared to 2009-10 resulted from increases in commercial and construction waste, and from additional deliveries of contaminated soil from the West Molonglo pond cleanup and elsewhere (TAMS 2011b).
Figure 3. Waste to landfill
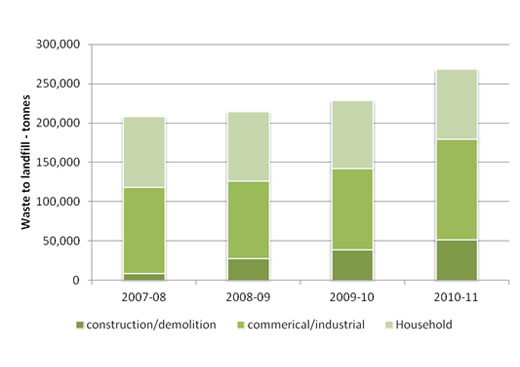
Source: TAMS 2011b
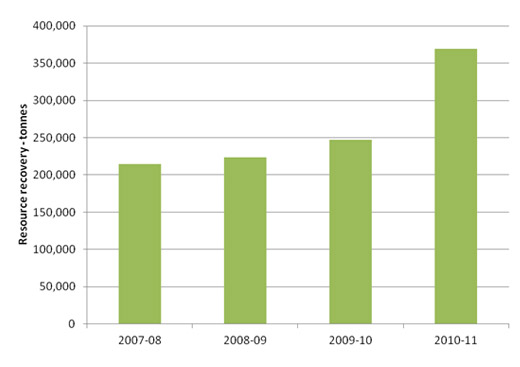
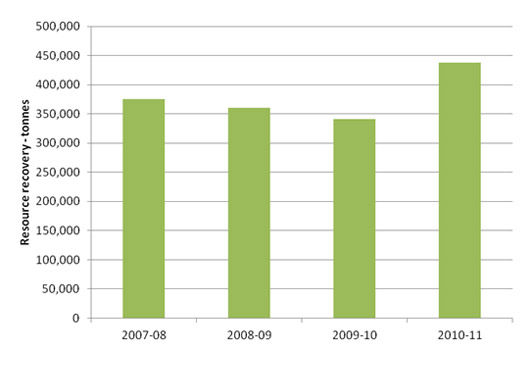
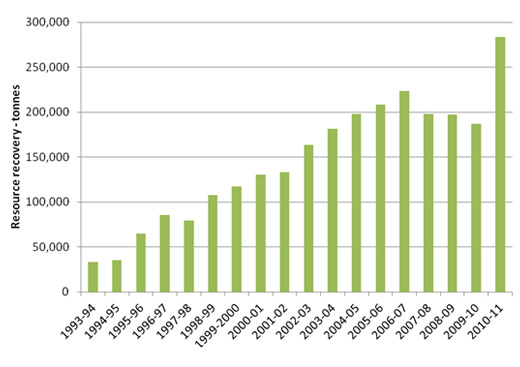
Total resource recovery increased by 36.7% during the reporting period (Figure 4). Resource recovery increased substantially in 2010-11 driven by additional garden waste (and other plant material) and recycling of building waste (TAMS 2011b).
Figure 4. Total resource recovery
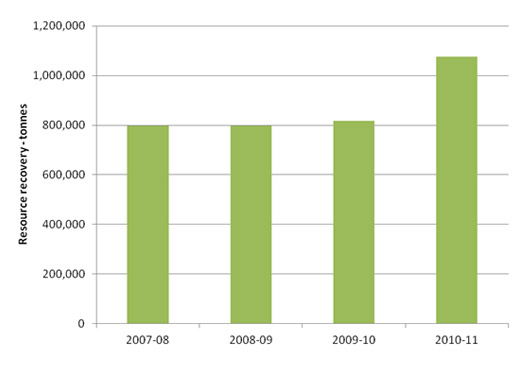
Source: TAMS 2011b
Data on waste are collected differently, according to the waste type. The ACT Department of Territory and Municipal Services (TAMS) itself collects the data on total tonnes of waste to landfill. However, data on resource recovery are collected by the contracted recycling companies, by type of resource recovered (e.g. glass, wood); and the data are kept and maintained by TAMS. This means that, for example, 'demolition resource recovery' may omit some material recycled in demolition activities, and 'private and commercial/industrial resource recovery' may include some material recycled outside those sectors. Analysis of resource recovery by sector is based on interpretation of available data by the Office of the Commissioner for Sustainability and the Environment.
While recycling data may not be as accurate as data on waste to landfill, both categories - waste to landfill and resource recovery - increased over the reporting period.
Pressure indicators [top ]
Construction and demolition sectors
During the reporting period the total amount of waste generated by the construction and demolition sector rose by 87.9% from 223,633 tonnes in 2007-08 to 420,227 tonnes in 2010-11 (Table A1; Figures 5 and 6). This is a reversal of the generally decreasing levels of construction and demolition waste to landfill measured in the previous reporting periods.
This sector's contribution to the total amount of waste processed in the ACT rose from 24% in 2007-08 to 36% in 2010-11. Meanwhile, the value of the construction completed during 2007-08 to 2009-10 is estimated to have risen from $1.7 billion to $2.3 billion (ABS 2011a). This result suggests that the increase in overall waste production from this sector is due to a significant rise in building and development activity in the ACT during the reporting period.
The improvement in recycling rates from 2009-10 to 2010-11 (Figure 6) results from the entry of an additional construction and demolition recycling business and existing recyclers working through stockpiles (TAMS 2011b). However, as indicated above, significant amounts of recyclable construction and demolition waste continue to be sent to landfill, leaving further opportunities to improve recycling rates in this sector (TAMS 2011b).
Figure 5. Construction and demolition waste to landfill, 1994-95 to 2010-11
Source: TAMS 2011b
Figure 6: Total demolition waste resource recovery in the ACT, 2007-08 to
2010-11
Source: TAMS
Note: As indicated above this figure has been derived from data provided by TAMS but collected by the recycling contractors.
Household and commercial and industrial sectors
During the reporting period, there was little change in the total amount of household waste sent to landfill; overall, it decreased by 424 tonnes or 0.5% (Figure 7).
Although the total weight of household waste sent to landfill has decreased significantly over the last two decades, the amounts of domestic waste collected have steadily increased. Most of the overall reduction is because there is now less private delivery of waste to landfill sites.
Figure 7. Household waste to landfill, 1994-95 to 2009-10
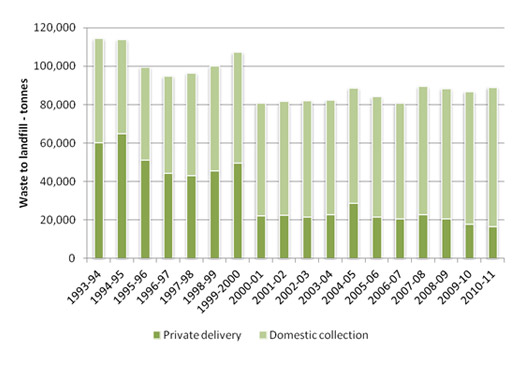
Source: TAMS
Much of the increase in domestic collection is a result of the population of the ACT having grown by an estimated 5.4% during the reporting period (ABS 2011b). Also, on a per capita basis, domestic collection of household waste has increased by approximately 5.5 kg, or approximately 3.2% per capita, over the reporting period (TAMS 2011b). This suggests increased rates of consumption, a factor closely linked with affluence and, in turn, waste generation (Dey 2010).
The decrease in the private delivery of domestic waste to landfill is attributed to recycling programs, such as the trial implemented by TAMS at the Mitchell transfer station (ACT Government 2011). These programs have resulted in the diversion from landfill of approximately 40% of the material received (ACT Government 2011).
Commercial and industrial waste has continued to increase, as noted in the previous reporting period. The amount of commercial/industrial waste sent to landfill increased by 16.6% (18,183 tonnes) over the reporting period, in spite of decreasing by 6640 tonnes (6.1%) during 2007-08 to 2009-10. Figure 8 illustrates that in the long-term the amount of commercial/industrial waste sent to landfill has been gradually increasing. It is not clear whether this is due to changes in waste management practices or to greater commercial/industrial activity or both.
Figure 8. Commercial and industrial waste to landfill
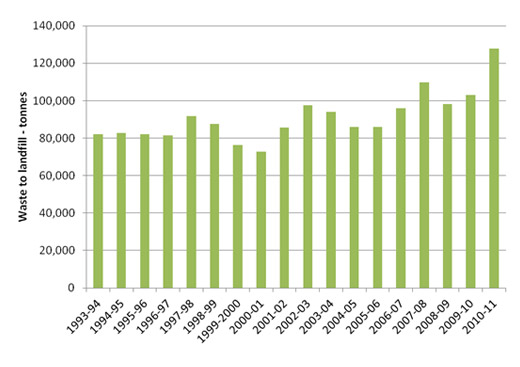
Source: TAMS
Statistics for recycled waste in the ACT are not separated into household and commercial/industrial sectors and therefore they can only be reported as aggregates. The percentage of recycling by these sectors decreased marginally between 2007-08 and 2009-10 before rising again in 2010-11 (Figure 9). Factors that may have contributed to these fluctuations include the liquidation of a major recycling company in 2010 and changes to material acceptance practices and fee structures for other recyclers (ESDD 2011).
Figure 9. Household and commercial/industrial resource recovery, 2007-08 to 2010-11
Source: TAMS
Note: As indicated above this figure has been derived from data provided by TAMS but collected by the recycling contractors.
Green waste
During the reporting period rates of recycling of green waste and compost steadily decreased from 2007-08 to 2009-10, but significantly increased in 2010-11 (Figure 10). This increase was largely attributable to additional plant growth caused by wet conditions in the spring and summer of 2010 (ACT Government 2011).
Rates of green waste recycling are excellent in the ACT with over 90% of material being recovered. Part of the explanation for this is the fact that ACT contractors accept green waste at no cost whereas other jurisdictions may charge up to $50 per tonne (ACT Government 2011).
Figure 10. Resource recovery of green waste/compost, 1994-95 to 2010-11
Source: TAMS 2011b
Movement of controlled waste
Controlled wastes are those that are considered to be a danger to humans because they are explosive, flammable, infectious, corrosive, exotoxic (toxic substances produced by micro-organisms such as bacteria or fungi), or perceived to have the potential to cause significant harm in some other way (EPA 2009).
The movement of controlled waste between states and territories is regulated by the National Environment Protection (Movement of Controlled Waste between States and Territories) Measure (Australian Government 1998). The National Environment Protection Council (NEPC) provides a management framework that enables the licensing and regulation of waste movements. An analysis of NEPC annual reports (NEPC 2008, 2009, 2010) reveals that both imports and exports of controlled waste have increased during the reporting period (Figure 11).
Controlled waste moving out of the ACT during the reporting period comprised liquid wastes, tyres and contaminated soil, being transported mainly into NSW for treatment or disposal. In July 2008 a decision was made to divert used tyres from landfill and transport them interstate for appropriate treatment or recycling. An increased amount of contaminated soil has been exported in 2009-10, primarily originating from Australian Government redevelopment projects in the ACT. The extra soil and the tyres contribute to the sudden increase in exports at 2008-09 in Figure 11.
Figure 11. Movement of controlled waste, 2007-08 to 2009-10
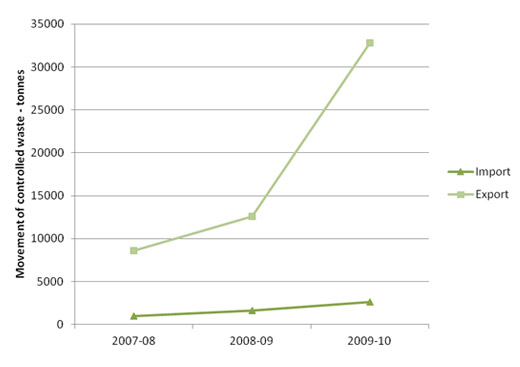
Source: Adapted from NEPC 2008, 2009, 2010
Imported waste
Between 2007-08 and 2009-10 imports of controlled waste increased by 158.7% (Table 1). The increase was largely because 1675.5 tonnes of soil and sludge were brought into the ACT in 2009-10, mainly as asbestos-contaminated soil from roadworks on the Kings Highway (see Table A2 in the Annex to this paper). No data are yet available for 2010-11.
The three types of controlled waste (oils, organic chemicals and clinical and pharmaceutical waste) imported into the ACT are sourced from New South Wales, Victoria and Queensland (Table 1).
Table 1. Movement of controlled waste into the ACT (tonnes)
| State | 2007-08 | 2008-09 | 2009-10 |
|---|---|---|---|
| NSW | 1006.6 | 1222.0 | 2583.3 |
| VIC | 0 | 63.6 | 21.2 |
| QLD | 11.9 | 363.2 | 30.1 |
| Total | 1018.5 | 1648.8 | 2634.5 |
Source: NEPC 2008, 2009, 2010
Exported waste
Between 2007-08 and 2009-10 exports of controlled waste increased by 283% (Table A3).
Overall movement during the reporting period, resulted in a net export of 48,687 tonnes of waste out of the ACT. Marked increases from 2007 to 2010 occurred in the export of:
- putrescible/organic waste (39.3%);
- soil/sludge (798.2%); and
- miscellaneous (2983.2%).
The increase in the amount of soils/sludge being exported from the ACT occurred predominantly in 2009-10 and resulted from Australian Government redevelopment projects within the ACT transporting waste to NSW (ESDD 2011). The export of individual waste types is set out in Table A3 in the Annex.
Various controlled wastes are also collected from households in the ACT by the ACT Government as a free of charge service (Table 2). The amount of waste collected has risen from 954.0 kg in 2007-08 to 1112.0 kg in 2009-10 (NEPC 2008, 2009 and 2010).
Table 2. Controlled waste (kg) from household-chemical pick-up program, 2007-08 to 2009-10
| Waste type | 2007-08 | 2009-10 |
|---|---|---|
| Acids/bases | 148.5 | 150.5 |
| Banned chemicals | 39.0 | 18.0 |
| Lab chemicals | 11.0 | 34.0 |
| Solvents | 72.0 | 124.5 |
| Pesticides/herbicides | 325.5 | 301.0 |
| Photo chemicals | 58.0 | 143.0 |
| Other/unknown | 300.0 | 341.0 |
| Total | 954.0 | 1112.0 |
Source: ACT NoWaste
Intra-state transported waste
Contaminated waste is also transported within the ACT. The movement of this waste is monitored by the ACT Environment Protection Authority (EPA). The main movements of contaminated waste during the reporting period included:
- the delivery of 20,000 tonnes of contaminated soil to the Mugga Lane Landfill from the West Molonglo pond cleanup; and
- delivery of contaminated soil from the hydrocarbon plume present in groundwater to the east of the intersection of the Bunda and Mort streets in Civic, to a landfarming facility established at the former West Belconnen landfill. This facility provides sustainable remediation of the soil for the developers of the construction sites while ensuring the highest level of environmental control over the activity.
Used packaging materials
The ACT Government's Used Packaging Materials Industry Waste Reduction Plan (IWRP), under the Waste Minimisation Act 2001, was approved in November 2006 and updated in April 2010. The goal of the plan is to encourage waste avoidance, reuse and recycling and thereby avoid environmental degradation from the disposal of used packaging and the sourcing of virgin materials.
Most of the materials collected now by kerbside recycling are sold or sent for secondary reuse (Table 3). Overall the amount of material collected has fallen by 1425.3 tonnes (4.0%) between 2007-08 and 2009-10 (NEPC 2008, 2009 and 2010).
In 2009-10, the weight of non-recyclables collected in recycling bins (known as contamination) and sent to landfill ,began to be reported. The 2589 tonnes collected are shown in Table 3 but not included in the total at the bottom of the column for 2009-10 .
Table 3. Recyclable materials collected at the kerbside, sent for secondary use or energy recovery and contamination (waste) disposal to landfill 2007-08 to 2010-11
| 2007-08 | 2008-09 | 2009-10 | ||||
|---|---|---|---|---|---|---|
| Amount collected (tonnes) | Sold* | Amount collected (tonnes) | Sold* | Amount collected (tonnes) | Sold* | |
| Total packaging paper, i.e. cardboard and liquid paper board | 23,601.0 | 98.6% | 8013.0 | 98.0% | 6979.2 | 100.0% |
| Total non packaging paper, i.e. paper mixed, paper white office, newspaper and magazines | No breakdown between packaging and non-packaging paper | 16,950.0 | 98.0% | 13,744.0 | 100.0% | |
| Total glass | 9726.0 | 92.2% | 11,255.0 | 91.7% | 10,988.7 | 100.0% |
| Total plastics | 1188.0 | 82.2% | 450.0 | 82.0% | 1246.2 | 100.0% |
| Total aluminium (cans) | 124.0 | 86.3% | 95.0 | 86.3% | 152.8 | 100.0% |
| Total steel (cans, tins, etc.) | 571.0 | 93.9% | 614.0 | 93.5% | 672.8 | 100.0% |
| Contamination | Not reported | Not reported | 2589.2 | 0.0% | ||
| Total | 35,209.0 | 96.2% | 37,347.0 | 95.8% | 33,783.7 | 92.9% |
* Includes sold or sent for secondary use including energy recovery by material type
Source: NEPC 2008, 2009, 2010
Impact indicators [top ]
Waste and human health
Limited data are available on connections between waste and human health in the ACT. The following types of waste can potentially affect human health and may require further investigation:
- clinical waste items used outside the formal health system; examples include used needles, syringes and other injecting equipment discarded in parks, playgrounds, toilets and other public places; people receiving a needlestick injury from these 'sharps' risk contracting blood-borne infections such as Hepatitis B or C, or HIV;
- organic waste materials such as food and animal faeces which can be washed into streams and lakes and contribute to the formation of algal blooms by adding nutrients to the water; see the Water quality indicator cluster for information about the potential threats to human health posed by blue-green algal blooms and faecal bacteria in recreational waters;
- waste items (litter) discarded in the public domain can have direct and indirect impacts on community health. For example, broken glass can have a direct impact by causing injury or fire; discarded cigarette butts can be a direct threat to human health if they start a bushfire; also, cigarette filters contain toxic chemicals and heavy metals including cadmium, lead, arsenic and zinc, which can enter the food chain by leaching into waters or the soil, or by being eaten by animals (Clean Up Australia 2006). Litter also has indirect impacts, as visual pollution degrading civic places and undermining community pride and well being.
Waste at all ACT Government health sites is managed via waste streaming and Clinical Waste Disposal practices. Clinical waste is managed within strict guidelines and in accordance with the ACT Clinical Waste Act 1990. Waste streams include mixed recyclables (plastic and cans), paper and cardboard, clinical and related waste (cytotoxins, sharps and so on), radioactive waste relating to nuclear medicine, general waste (landfill) and dangerous substance waste.
Waste substances can contaminate groundwater. Spilt oils, chemicals, pathogens and other pollutants can seep into the soil and enter aquifers. As outlined in the Groundwater indicator cluster, the quality of groundwater in aquifers considered to be at risk is monitored under Authorisations and site assessments where contamination has been identified, mainly at landfill sites and former service station.
Pollution incidents
The ACT Government has identified the following types of pollution by waste: illegal dumping of solid or liquid waste; littering from vehicles; and contaminated sites (ESDD).
Volumes of solid or liquid waste illegally dumped have been unpredictable in comparison to general litter during the reporting period. The volume increased in 2007-08, decreased significantly in 2008-09 and again in 2009-10, and increased again to a 3-year high in 2010-11 (KABNA 2008, 2009, 2010, 2011).
The National Litter Index is a project managed by the Keep Australia Beautiful group, which conducts a yearly survey to estimate litter trends throughout Australia. The survey has found that both the number of items and the volume of litter in the ACT have decreased steadily since 2006-07, apart from a small increase in the volume (0.4 litres) in 2010-11. However, the number of items illegally dumped continued to decrease in 2010-11. In 2010-11 the ACT was found to have a comparatively small amount of littering compared to the national average (KABNA 2011). Cigarette butts remain the most common litter item within the ACT; their frequency has decreased yearly over the reporting period (KABNA 2008, 2009, 2010, 2011).
Response indicators [top ]
Waste management
National Waste Policy
Through the National Waste Policy (DSEWPaC 2011), the ACT Government is working to improve the system for the identification, classification, collection, treatment, disposal and monitoring of hazardous substances and waste.
The Australian Packaging Covenant (APC) was introduced in 1999. It is a voluntary partnership between government and industry aimed at reducing the effect packaging has on the environment. The objectives of the framework for the life-cycle-management of packaging are to reduce the impacts from the disposal of packaging, improve resource use through better design and production of packaging and encourage reuse and recycling (NEPC, 2008, 2009 and 2010). ACT-based signatories to the APC have increased from 13 to 15 during the period 2007-08 to 2009-10.
The Australian Government has attempted to encourage the building industry to achieve or maintain high levels of resource recovery, through funding agreements under the National Building Economic Stimulus Plan. For example, the Social Housing component of the Plan (2008-09 to 2011-12) requires a minimum of 90% of all construction and demolition waste to be reused (ACT Government 2011). However, figures are not available to determine whether or not this has been achieved.
In 2010, the ACT became the first jurisdiction to divert televisions and computers from landfill; the policy added to the mandatory recycling of computers - a policy that was introduced in 2005. From 1 July 2010 until 30 June 2011, around 11,100 televisions and around 4500 computers have been recycled under this diversion scheme. A National Television and Computer Product Stewardship Scheme is likely to commence in 2010-11.
ACT waste strategy
In 1996, the ACT Government set a goal of achieving no waste going to landfill, through the adoption of the No Waste by 2010 Waste Management Strategy for Canberra. The aspirational goal of the No Waste by 2010 strategy was a waste-free society.
Key positive outcomes of the No Waste by 2010 Waste Management Strategy have included:
- more construction demolition waste being recycled, increasing from 39.0% in 1994-95 to a high of 96.1% in 2007-08, since followed by a slight decrease to 87.8% in 2010-11;
- more recycling overall, increasing from 33.4% in 1994-95 to a high of 75.1% in 2005-06 and again in 2010-11; and
- a steady decrease in private deliveries to landfill, from 64,640 tonnes in 1994-95 to 16,536 tonnes in 2010-11 (74.4%), driving an overall decrease of 21.8% in the amount of household waste sent to landfill since the mid 1990s.
Despite the positive outcomes, waste generation and waste to landfill in the ACT are once again increasing, while recycling rates have begun to plateau. A recent kerbside audit conducted by TAMS found that there are still many opportunities to recover material from domestic collection (ACT Government 2011).
As identified in the previous State of the Environment Report, waste minimisation and/or avoidance needs to be the fundamental first step (before re-use, recycling or disposal) in effective waste management.
With the end of the No Waste by 2010 Waste Management Strategy, there is currently no waste management strategy in place in the ACT. The Draft Sustainable Waste Strategy 2010-2025 was open for public comment until the end of February 2011 and is currently being considered by the ACT Government, for possible adoption by the end of 2011.
The draft strategy has a focus on managing organic and business/construction waste. Further, it incorporates targets of "over 80% resource recovery by 2015 and over 90% resource recovery by 2025" (DECCEW 2010). Figure 12 is a graphical depiction of the priorities driving the Draft Sustainable Waste Strategy 2010-2025.
Figure 12. Waste management hierarchy
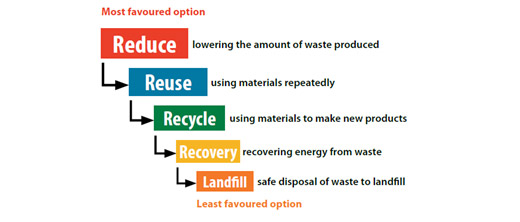
Source: ACT Government 2011
ACT Waste management programs
ACT NOWaste manages the domestic waste and recycling collections from more than 130,000 households in Canberra, as well as the Territory?s waste and resource recovery facilities (ACT Government 2011).
That team also supports resource recovery by collecting and analysing data and using it to inform waste policy and deliver public education programs. These programs help the community and businesses to recycle more effectively (ACT Government 2011).
ACT Government programs
Since 2009, the ACT Government has provided support and training to the business and commercial waste sectors through the delivery of the ACTSmart Business, ACTSmart Office and ACTSmart Public Event programs. The programs encourage participants to direct waste away from landfill, improve sustainability and reduce the Territory's carbon footprint.
Over 281 different sites have participated in these programs, including shopping centres, fast food outlets, sporting venues and healthcare providers. Of these, 50 have been accredited. The ACTSmart Business and Office programs have reached over 20,000 staff in the participating organisations and diverted 12,399 m³ of waste from landfill to recycling (ESDD 2011). Sustainable Procurement practices have been included in the ACTSmart programs; they have been implemented throughout ACT Government agencies to encourage the use of more sustainable packaging and to avoid packaging where possible.
These programs are in line with recommendation in the 2007-08 ACT State of the Environment Report: namely, to develop and implement a business waste-reduction strategy. However, as indicated by the continuing increase of commercial/industrial waste to landfill, a focus needs to be kept on this area of management.
Given the increase in construction waste disposed of over the reporting period, that sector should also be targeted for future action.
ACTSmart Schools is a similar program that addresses the specific needs of schools. It has been introduced under the Australian Sustainable Schools Initiative (AuSSI), and during 2011 it reached all 128 ACT schools. To date, waste audits have been conducted in 53 schools (41.4%) in the ACT. Nine schools have conducted a second audit following the introduction of changes identified earlier, and 22 schools have received ACTSmart Waste-Wise accreditation. It is estimated that the changes implemented in these schools have resulted in the diversion of 808,000 litres of recyclable waste from landfill. The ACT Government has prioritised waste education for young people through its continuing support of the Australian Sustainable Schools Initiative and TAMS No Waste programs.
The ACT Government operates a wide suite of community education programs, with the aim of reaching every resident and visitor to the Territory. Additionally, TAMS provides information at community fairs and festivals, develops recycling games and products, and operates tours through the Materials Recovery Facility.
In line with recommendations made in the 2007-08 ACT State of the Environment Report, the most recent ACT Government budget (2011-12) has provided funding for public place recycling (PPR) which is planned for Civic by 2012. The Public Place Recycling Program will be evaluated by 2014 with the view of expanding it by 2015.
A 12-month trial was initiated by Smart Public Events in 2011, providing recycling facilities at public events. Manuka Oval and Canberra Stadium (both members of the ACTSmart Business program) have implemented recycling for all sporting events held at these grounds (OCSE 2011).
Community programs
OzHarvest Canberra collects excess food from restaurants and re-distributes it to vulnerable people in need. In 2006 the organisation was established in the ACT and in 2010 OzHarvest Canberra recovered in excess of 95 tonnes of food and diverted it to charities in the Canberra and Queanbeyan regions (OzHarvest 2010). It is estimated that re-distribution of food rather than sending it to landfill will "avoid 2 kg of greenhouse emissions (kg CO2-e), and the consumption of 143 litres of water" for each kilo of food collected (OzHarvest n.d.). Other community organisation such as UC Environment and Sustainability Society and ANUgreen also promote waste minimisation and management in the community (see Community engagement indicator cluster for further information).
Methane gas capture
Organic waste in landfill decomposes under anaerobic conditions to produce a mixture of carbon dioxide and methane with trace amounts of volatile organic compounds, volatile fatty acids and hydrogen sulphide. This gas is collected through a network of pipes, extracted, cleaned and dried and used to produce electricity at the current landfill at Mugga Lane and the former landfill at West Belconnen. In 2010-11, methane captured from both landfills was used to produce more than 28,000 MWh of electricity (TAMS 2011b).
Plastic shopping bag legislation
In December 2010, the Plastic Shopping Bags Ban Act (ACT) 2010 was passed. It came into force on 1 November 2011, and is due for review after 2 years of operation. The main focus of the ban is non-biodegradable bags, wholly or partly made of polyethylene with a thickness of less than 35 microns (typically those used for packing groceries and take-away food).
The ban recognises the need for behaviour change, by individual households and businesses, to reduce the use plastic bags that contribute to visual and other pollution as litter, in waterways and in waste to landfill. Education and awareness programs have been conducted to raise awareness of the new ban (DECCEW 2010). It is too early to determine what effect this legislation will have on litter or waste generation in the ACT.
Waste harvesting and thermal conversion research
In 2010, the ACT Government began investigating the feasibility of using energy from waste technologies in the ACT. It is also funding a large trial at the Fenner School of Environment and Society at the Australian National University (ANU) to assess the potential to make biochar from the ACT's waste stream. Biochar is a form of charcoal produced by heating organic materials to high temperatures in a low oxygen environment. It can sequester carbon and potentially create valuable soil additives for use in agriculture or horticulture.
In 2010, the ACT Government conducted a pre-feasibility assessment of a thermal conversion facility for the ACT. The assessment found that a range of environmental, social and economic considerations must be investigated before progressing. Products which may be produced by the facility include:
- charcoal/biochar (soil productivity improvers and sustainable carbon sequestration products);
- bio-oils; and
- syngas (petrochemical industry precursors for liquid fuels or sustainable heat/poser generation) (DECCEW 2010).
Future directions
In April 2011, the ACT Government began trialling a bulky waste household collection service. The trial is offering one free collection per dwelling to eligible Concession Card holders. Other groups can access the service for a fee. One of the key aims of the trial is to test the ability of the operator to recover most of the material collected, preventing the bulk of the waste going to landfill (TAMS 2011a).
Plans are progressing towards introducing a permanent recycling system into the operations of the Mitchell waste transfer station. It is expected that this initiative will provide a better service for the north side of Canberra in addition to increasing recycling to at least 40%.
A tender process is also underway to build a Material Recovery Facility for dry mixed commercial waste within the Hume Resource Recovery Estate. It is expected that the new facility will recover in excess of 40,000 tonnes of material each year.
While significant improvements have been made in waste reduction and recycling rates improvements can be made in a number of areas, in particular:
- there has been little action towards diverting organic waste materials from landfill - an area that was identified in the previous State of the Environment Report as an important focus for future waste reduction efforts;
- the ACT Government recognises that for the foreseeable future there is no alternative way of disposing of some waste other than via landfill. Consequently, options are being investigated to enable more efficient and environmentally responsible use of landfill cells at the Mugga Lane Resource Management Centre to meet the Territory's needs beyond 2015-16 (DECCEW 2010).
Glossary [top ]
Contaminated land: Contaminated land is land (including buildings and structures on land and surface and underground water) on and/or in which a contaminating substance is present at a concentration which exceeds that normally present (commonly referred to as the background level), and the presence of that contaminating substance presents, or would be likely to present, a risk of harm to human health and/or a risk of environmental harm. However if the contaminating substance are managed in an appropriate manner the site would not pose a significant risk of harm to human health or the environment and would not be considered contaminated.
Controlled waste: Waste as defined in the National Environment Protection (Movement of Controlled Wastes between States and Territories) Measure 1998
E-Waste: Waste electrical and electronic equipment that is dependent on electric currents or electromagnetic fields for its function (including all components, subassemblies and consumables which are part of the original equipment at the time of discarding)
Hazardous waste: Listed waste having a characteristic described in schedule A list 2 of the National Environment Protection (Movement of controlled waste between States and Territories) Measure: "A hazardous waste refers to a substance or object that exhibits hazardous characteristics, is no longer fit for its intended use and requires disposal. Some of these hazardous characteristics include being toxic, flammable, explosive and poisonous."
Illegal dumping: For the National Litter Index illegal dumping is defined as the unlawful deposit onto land of waste larger than litter, or in other words, waste materials dumped, tipped or otherwise deposited onto private or public land where no licence or approval exists to accept such waste. Illegal dumping varies from small bags of rubbish in an urban environment to larger scale dumping of materials in isolated areas, such as bushland.
Landfill: A waste disposal site used for the controlled deposit of solid waste onto or into land.
Litter: Rubbish left in an open or public place
References [top ]
ABS 2011a. 8752.0 - Building Activity. Cat. No. 8752.0. Australian Bureau of Statistics. Australian Government. Canberra. http://www.abs.gov.au/ausstats/abs@.nsf/mf/8752.0 (accessed 10/8/11)
ABS 2011b. 3101.0 - Australian Demographic Statistics. Cat. No. 3101.0. Australian Bureau of Statistics. Australian Government. Canberra. http://www.abs.gov.au/ausstats/abs@.nsf/mf/3101.0 (accessed 10/8/11)
ACT Government 2010. Draft Sustainable Waste Strategy 2010-2025. Canberra. http://www.environment.act.gov.au/__data/assets/pdf_file/0009/210501/SustainableWaste_Strategy_WEB.pdf (accessed 11/6/11)
Australian Government 1998. NEPC National Environment Protection (Movement of Controlled Waste between States and Territories) Measure. ComLaw. Canberra. http://www.comlaw.gov.au/Details/F2007B01119/Html/Text#_Toc1182129234073 (accessed 14/8/11)
Clean Up Australia 2006. Cigarette Butts. Glebe. http://www.cleanup.org.au/PDF/au/cua-cigarette-butts-fact-sheet.pdf (accessed 20/8/11)
DECCEW 2010. Plastic Bag Ban passed by Assembly - Media Release. ACT Department of Environment, Climate Change, Energy and Water. Canberra. http://www.environment.act.gov.au/__data/assets/pdf_file/0006/214296/MIN_187_1210_Plastic_bag_ban_passed_by_Assembly.pdf (accessed 27/5/11)
Dey, C. 2010. The 2008-09 Ecological Footprint of the Population of the ACT. Integrated Sustainability Analysis Research Group. University of Sydney. Sydney. http://www.environmentcommissioner.act.gov.au/__data/assets/pdf_file/0015/211182/ACT_Ecological_Footprint_08-09_final_report.pdf (accessed 21/11/11)
DSEWPaC 2011. National Waste Policy: Less Waste, More Resources. Australian Government Department of Sustainability, Environment, Water, Population and Communities, Canberra. http://www.environment.gov.au/wastepolicy/index.html (accessed 23/11/11)
EPA 2009. Waste Guidelines. South Australian Environment Protection Authority. Adelaide. Australia. http://www.epa.sa.gov.au/xstd_files/Waste/Guideline/guide_waste_definitions.pdf (accessed 18/11/11)
ESDD n.d. Reporting Pollution. Environment and Sustainable Development Directorate. ACT Government. Canberra. http://www.environment.act.gov.au/?a=230598#waste (accessed 12/10/11.)
ESDD 2011. Annual Report 2010-11. Environment and Sustainable Development Directorate. ACT Government. Canberra. http://www.environment.act.gov.au/__data/assets/pdf_file/0006/233286/1027-DECCEW_AnnualReport2011_web.pdf (accessed 9/10/11)
KABNA 2008. National Litter Index Annual Report 2007/2008. Keep Australia Beautiful National Association. Canberra. http://www.kab.org.au/litter-research/what-we-do/national-litter-index/ (accessed 9/8/11)
KABNA 2009. National Litter Index Annual Report 2008/2009. Keep Australia Beautiful National Association. Canberra. http://www.kab.org.au/litter-research/what-we-do/national-litter-index/ (accessed 9/8/11)
KABNA 2010. National Litter Index Annual Report 2009/2010. Keep Australia Beautiful National Association. Canberra. http://www.kab.org.au/files/NLI/NLI%20homepage/0910%20Reports/100923_4_mtr_nli_0910_report.pdf (accessed 9/8/11)
KABNA 2011. National Litter Index Annual Report 2010/2011. Keep Australia Beautiful National Association. Canberra. http://www.kab.org.au/files/NLI/NLI%20homepage/1011%20Reports/2_nli_1011_report_final.pdf (accessed 9/8/11)
NEPC 2008. Annual Report 2007-08. National Environment Protection Council. Canberra. http://www.environment.gov.au/about/councils/nepc/publications/pubs/nepc-annualreport-0708.pdf (accessed 12/8/11)
NEPC 2009. Annual Report 2008-09. National Environment Protection Council. Canberra. http://www.ephc.gov.au/annual_report?q=annual_report_previous (accessed 21/11/11)
NEPC 2010. Annual Report 2009-10. National Environment Protection Council. Canberra. http://www.ephc.gov.au/annual_report (accessed 21/11/11)
OCSE 2011. Annual Report 2010-11. Office of the Commissioner of Sustainability and the Environment. Canberra. http://www.envcomm.act.gov.au/__data/assets/pdf_file/0016/233260/2010-11_OCSE_annual_report_for_Web.pdf (accessed 17/8/11)
OzHarvest 2010. Annual Report 2010. Sydney. http://www.ozharvest.org/media/page/2010%202011%20OzHarvest%20Annual%20Report.pdf (accessed 15/8/11)
OzHarvest nd. About Oz Harvest, Our Impact. Oz Harvest. Sydney. http://www.ozharvest.org/ourimpact.asp?pageID=609 (accessed 9/8/11)
TAMS 2011a. Bulky Waste Collection Service Trial. Territory and Municipal Services. ACT Government. Canberra. http://www.tams.act.gov.au/__data/assets/pdf_file/0005/224861/Bulky_Waste_Collection_Brochure.pdf (accessed 6/8/11)
TAMS 2011b. Annual Report 2010-11 Volume 1.Territory and Municipal Services. ACT Government. Canberra. http://www.tams.act.gov.au/__data/assets/pdf_file/0007/233179/Volume_1_10-11.pdf (accessed 31/10/11)
Other data sources
In addition to these published reports, data for this paper were also sourced from:
- ACT Department of Territory and Municipal Services (TAMS) - now Territory and Municipal Services Directorate (TAMSD)
- ACT Environment Protection Authority (EPA) - now part of Environment and Sustainable Development Directorate (ESDD)
- ACT NoWaste - now part of Territory and Municipal Services Directorate (TAMSD)
- Australian Bureau of Statistics (ABS)
Annex [top ]
Table A1. Summary of waste totals and trends by sector
| Waste to landfill site in the ACT | 2007-08 | 2008-09 | 2009-10 | 2010-11 | Change (%) |
|---|---|---|---|---|---|
| Construction/demolition waste (tonnes) | 8,658 | 27,522 | 38,895 | 51,261 | 492.1 |
| Commercial/industrial waste (tonnes) | 109,698 | 98,150 | 103,058 | 127,881 | 16.6 |
| Household waste (private delivery) (tonnes) | 22,810 | 20,477 | 17,835 | 16,536 | -27.5 |
| Household waste (domestic collection) (tonnes) | 66,560 | 67,820 | 68,918 | 72,410 | 8.8 |
| Total waste to landfill (tonnes) | 207,726 | 213,969 | 228,706 | 268,088 | 29.1 |
| Demolition waste recycling (tonnes) | 214,975 | 223,825 | 246,777 | 368,966 | 71.6 |
| Household and commercial/industrial resource recovery (tonnes) | 375,118 | 360,286 | 340,950 | 437,710 | 16.7 |
| Total resource recovery (tonnes) | 590,093 | 584,111 | 587,727 | 806,676 | 36.7 |
| Total waste generated (tonnes) | 787,819 | 798,080 | 816,433 | 1,074,764 | 34.7 |
| Household waste to landfill per person (kg) | 231.5 | 224.7 | 216.8 | 218.5 | -5.6 |
| Household waste (private delivery) (kg) | 59.1 | 52.1 | 44.6 | 40.6 | -31.2 |
| Household waste (domestic collection) (kg) | 172.4 | 172.6 | 172.2 | 177.9 | 3.2 |
| Total resource recovery (%) | 74.0 | 73.2 | 72.0 | 75.1 | 1.5 |
| Demolition waste recycling (%) | 96.1 | 89.1 | 86.4 | 87.8 | -8.7 |
| Private and commercial/industrial resource recovery (%) | 65.3 | 65.9 | 64.2 | 66.9 | 2.4 |
| Estimated resident population of the ACT | 346,294 | 352,285 | 358,571 | 364,541 | 5.30% |
| Estimated resident population of Queanbeyan | 39,777 | 40,661 | 41,551 | 42,464 | 6.80% |
Note: Total waste generated does not include controlled waste exported from the ACT. Estimated resident population for Queanbeyan was not available for 2009-10 and 2010-11. An increase of 2.19% was used because that was the average increase over the previous 5 years. Estimated resident population for ACT was not available for 2010-11. An increase of 1.66% was used because that was the average over the previous 6 years. Figures for 'demolition waste recycling' and 'private and commercial/industrial resource recovery' have been derived from other data maintained by TAMS, but resource recovery is not specifically collected and maintained by TAMS against these waste streams. This means that 'demolition waste recycling' may omit some material recycled in demolition activities, and 'private and commercial/industrial resource recovery' may include some material recycled outside those sectors.
Table A2. Import of controlled waste into the ACT, 2007-08 to 2010-11
| Import (tonnes) | ||||
|---|---|---|---|---|
| 2007-08 | 2008-09 | 2009-10 | Change | |
| Plating & heat treatment | 0.0 | 0.0 | 0.0 | 0.0% |
| Acids | 0.0 | 0.0 | 0.0 | 0.0% |
| Alkalis | 0.0 | 0.0 | 0.0 | 0.0% |
| Inorganic chemicals | 0.0 | 0.0 | 0.0 | 0.0% |
| Reactive chemicals | 0.0 | 0.0 | 0.0 | 0.0% |
| Paints, resin, inks, organic sludges | 0.0 | 0.0 | 0.0 | 0.0% |
| Organic solvents | 0.0 | 0.0 | 0.0 | 0.0% |
| Pesticides | 0.0 | 0.0 | 0.0 | 0.0% |
| Oils | 269.4 | 286.3 | 181.3 | -32.7% |
| Putrescible/organic waste | 0.0 | 0.0 | 0.0 | 0.0% |
| Industrial washwater | 0.0 | 0.0 | 0.0 | 0.0% |
| Organic chemicals | 490.2 | 1,094.6 | 516.9 | 100.0% |
| Soil/sludge | 0.0 | 0.0 | 0.0 | 0.0% |
| Clinical & pharmaceutical | 258.9 | 268.0 | 260.9 | 0.8% |
| Miscellaneous | 0.0 | 0.0 | 0.0 | 0.0% |
| TOTAL | 1,018.5 | 1,648.8 | 2,634.5 | 158.7% |
Table A3. Export of controlled waste out of the ACT (2007-08 to 2010-11)
| Export (tonnes) | ||||
|---|---|---|---|---|
| 2007-08 | 2008-09 | 2009-10 | Change | |
| Plating & heat treatment | 0.0 | 0.4 | 0.0 | 0.0% |
| Acids | 9.5 | 4.8 | 2.8 | -70.5% |
| Alkalis | 50.3 | 4.4 | 4.4 | -91.3% |
| Inorganic chemicals | 174.6 | 143.8 | 100.9 | -42.2% |
| Reactive chemicals | 0.1 | 0.6 | 0.0 | -100.0% |
| Paints, resin, inks, organic sludges | 64.5 | 49.3 | 69.6 | 7.9% |
| Organic solvents | 57.4 | 47.9 | 42.3 | -26.3% |
| Pesticides | 0.6 | 0.2 | 0.2 | -66.7% |
| Oils | 1,579.0 | 1,535.1 | 1,291.6 | -18.2% |
| Putrescible/organic waste | 3,588.6 | 4,630.4 | 5,000.0 | 39.3% |
| Industrial washwater | 0.0 | 0.0 | 0.0 | 0.0% |
| Organic chemicals | 149.9 | 573.3 | 123.0 | -17.9% |
| Soil/sludge | 2,723.6 | 5,225.6 | 24,464.0 | 798.2% |
| Clinical & pharmaceutical | 118.8 | 115.6 | 110.4 | -7.1% |
| Miscellaneous | 52.6 | 257.2 | 1,621.8 | 2,983.3% |
| TOTAL | 8,569.5 | 12,588.4 | 32,830.9 |
283.1% |


Share this page: