


ACT State of the Environment Report 2011
Accurate, timely & accessible information for the community regarding the condition of the environment, underlying pressures, and sustainability trends.
THEME: Climate
Indicator cluster: Climate as a resource
Download: Indicator cluster: Climate as a resource.pdf
This cluster has only one indicator:
- Climate as a resource (R) - discussion of climate as a resource for renewable energy, agriculture, tourism and other production
Condition indicators (C) present data that tell us the state of the environment at any particular time.
Pressure indicators (P) present data about the main human activities that could potentially adversely affect the condition of the environment.
Impact indicators (I) present data on the effect that environmental changes have on environmental or human health.
Response indicators (R) present data about the main things we are doing to alleviate pressures, or to improve the condition of the environment.
Summary [top  ]
]
The use of climate change as a resource in the ACT can be seen in recent industrial market shifts, such as the growth of renewable energy (renewables) in the energy sector. In particular, the contribution of renewables to the energy industry has steadily been increasing throughout the reporting period. The climatic and environmental conditions of the Australian Capital Region1 are highly suited to a number of renewable energy industries. The region has one of the oldest and largest renewable energy sources in Australia in the Snowy Mountains Hydroelectric Scheme, and it has favourable climatic conditions for wind and solar technologies, and established and planned renewable power generation stations.
Sectors experiencing the effects of climate change are agriculture and tourism. Winter tourism and the wine industry have been increasingly challenged by climate change (Hennessy et al. 2003). However, coastal tourism and activities such as wildlife watching, trekking, camping, climbing and fishing may have extended seasons, longer than the traditional summer holiday period, because of predicted drier and warmer conditions. On the other hand, the tourism industry may also be at risk from increased extreme weather events such as storms and fires.
Introduction [top ]
The Climate as a resource indicator cluster looks at how current and future climatic conditions of the ACT, and adaptation and mitigation actions, are being put to use. Opportunities and challenges include those associated with sectors reliant on climate, such as the renewable energy, tourism and primary industries.
Condition indicators [top ]
There are no condition indicators for this cluster.
The most likely future climate scenario for the ACT includes (Webb 2011):
- the strong likelihood of mean temperatures continuing to increase, along with more frequent and severe heatwaves for the ACT and region; and
- a high probability of changes in the pattern of rainfall from that observed during the period of instrumental records, with some risk of a decline in long-term average rainfall; and in addition, the likelihood of an increase in rainfall intensity with more extreme rainfall events.
While this may not seem a significant change, small differences in average values of climatic parameters such as temperature and rainfall can lead to large changes in the frequency and intensity of extreme events such as heatwaves, storms and fires.
For more information on weather patterns see the Driving Forces papers.
Pressure indicators [top ]
There are no pressure indicators for this cluster. However, it is expected that changes in climate in the ACT will lead to (Webb 2011):
- increased evaporation (especially in spring and summer), which, combined with potential changes in rainfall, is likely to result in reduced soil moisture (particularly in winter and spring if autumn rainfalls also remain historically low);
- changes in run-off and streamflows, with higher evaporation in spring and summer tending to reduce run-off during those periods;
- an increase in the severity of drought because of higher temperatures;
- more frequent and intense bushfires overall, because of higher temperatures, drier conditions and lower humidity, with extension of the fire season into spring; changes in fuel availability will add significant uncertainty in projections;
- more intense flood-producing rainfall events with impacts depending in part on the prevailing catchment conditions (i.e. soil moisture and levels in major water storages).
For more information on weather and climate see the Driving Forces papers.
Impact indicators [top ]
Climate change is predicted to have direct and indirect effects on urban, social and natural environments in the ACT, including:
- more frequent heatwaves, bushfires and storms, and decreased water availability (direct impacts); and
- effects on human health and the availability of water, and modifications to ecological and agricultural systems (indirect impacts).
For more information on climate change impacts see the Climate vulnerability indicator cluster.
Response indicators [top ]
The ACT sources most of its stationary energy (that is, electricity) from interstate. The ACT is also heavily reliant on interstate industry and freight for the production and transport of goods and services used here, as well as many other services. It is therefore vital that the ACT takes a regional approach to planning for, and using, climate as a resource. A number of renewable energy power stations, particularly wind-powered, have been developed across the Australian Capital Region during the reporting period, and construction of further stations is either approved or underway (NSW Planning and Infrastructure 2011).
Renewable energy
The renewable energy sector has been steadily growing in response to the need for alternative low-emission sources of energy. The Australian Capital Region has significant potential for solar, hydro- and particularly wind-generation of electricity because of the often high wind speeds in much of the region. The environment of the region is suitable for a strong renewable energy industry. It supports the Snowy Mountains Hydroelectric Scheme, one of the oldest and largest renewable energy sources in Australia, and a growing number of renewable energy power stations (e.g. solar, water, wind, biomass).
Solar power
While the ACT presents fewer potential solar resources than some other cities (as shown in Figure 1) the close proximity of the city centre to potential large-scale solar-power generation sites is an advantage for Canberra compared to other capitals, because transmission losses would be minimised. The level of solar radiation experienced in the area means that around 0.6 hectares of solar cells would produce enough electricity to meet the yearly demand of a small office building2.
Figure 1: Potential solar resources in Canberra and other locations using sun-tracking data
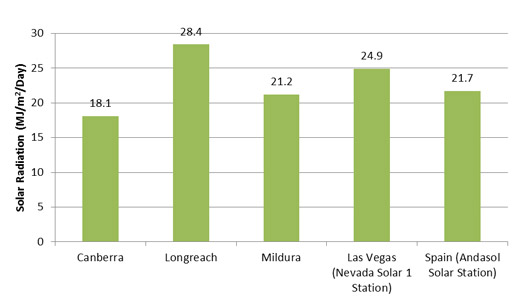
Source: PB 2008
The amount of solar power that can be generated from a solar cell is directly linked to the potential solar resources (including parameters such as radiation and duration) at the location. In 2008 a pre-feasibility study was prepared to estimate the potential and preferred technology for a solar power plant in the ACT (PB 2008). The study determined that the ACT has a relative abundance of solar energy resources because of the high level of solar radiation and the large number of annual sunshine hours, and identified a 22 MW project using solar thermal-trough technology as the preferred option for an ACT solar farm, based on cost and development constraints.
The specific data of interest are Global (fixed), Global (tracking) and Direct (single North-South axis). The solar radiation in the ACT for each of these measures is shown in Figure 2. It is estimated that the average total solar radiation received in the ACT each day is approximately 10 times greater than the ACT's daily electricity consumption (ABS 2002).
Figure 2: Annual average solar radiation in Canberra
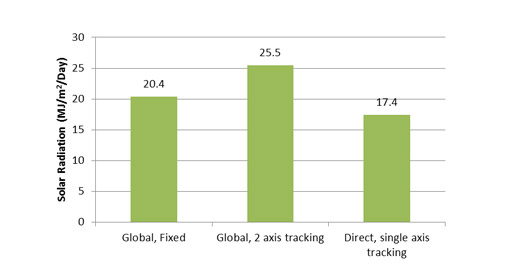
Source: ASES 2006
In 2009, the ACT Government consulted with the community about two potential sites for a solar power facility in the ACT. However, in 2010 the ACT Government changed their approach to a solar power facility following the expansion of the electricity Feed-in Tariff Scheme. The Government's current position is that any such facility will be privately developed, with those proponents interested in establishing large-scale renewable energy solar facilities in the ACT able to bid for access to a feed-in tariff for a total of up to 40 MW. Bidders will be responsible for financing, constructing, owning and operating any proposed facility. Under this arrangement the ACT Government will be responsible for developing appropriate legislation to provide a supported price payment for generated electricity. The ACT Government has identified benefits solar energy could bring to the ACT:
- generation of renewable energy that makes a significant contribution to meeting the ACT's greenhouse gas emission targets;
- economies of scale to reduce the cost of renewable energy generation in the ACT; and
- support for a clean energy industry in the ACT.
The ACT Government also began a feed-in tariff scheme in March 2009 to encourage small-scale renewable energy generation to feed into the grid. The tariff was designed to encourage investment in renewable electricity generation by paying small-scale generators a premium rate for the gross amount of electricity they generate (Engineers Australia 2009). The ACT Government set a cap on the total installed capacity of micro- and medium-scale generators that would be funded under the scheme, and on 31 May 2011 the micro-scale cap was reached. The total installed capacity of renewable generators at 30 June 2011 was about 14MW (ICRC 2011). See the Mitigation indicator cluster for more information.
Wind energy
Wind energy can be converted to electrical energy through the use of turbines. Effects such as fluctuations in the wind result in around 40-60% of available wind energy being transferred to the turbine blades. Inefficiencies in the turbines means that only around 35% of the captured wind energy can then be turned into electrical energy (AGL Energy Limited 2009, Wind Prospect Ltd 2011a, b). Despite these limits, wind energy, compared with other emerging sustainable sources, is the most mature technology, with numerous commercial wind farms installed around the country.
Urban development and large nature reserves create turbulence and greatly limit the potential sites available for the development of a wind farm in the ACT. As with solar, the Australia Capital Region has less potential for wind-generation of power than other areas, such as those offshore and in the north of Australia. However, there is still considerable potential in the areas of NSW around the ACT (see Figure 3) and significant investment in wind energy has already been made in the region.
Figure 3: Wind speeds in the Canberra region in metres per second (m/s)
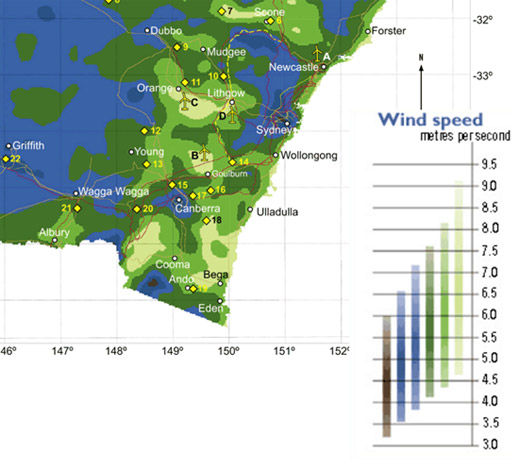
Source: CSIRO 2003
As of April 2011, the Australian Capital Region (comprising the ACT and 17 local government areas in NSW) has 11 wind farms (with a total 475 turbines) approved; applications for a further 11 wind farms (with a total of 1058 turbines) have been received by the NSW Government (see Figure 4 and Table 1).
Figure 4. Wind farms in south-eastern NSW
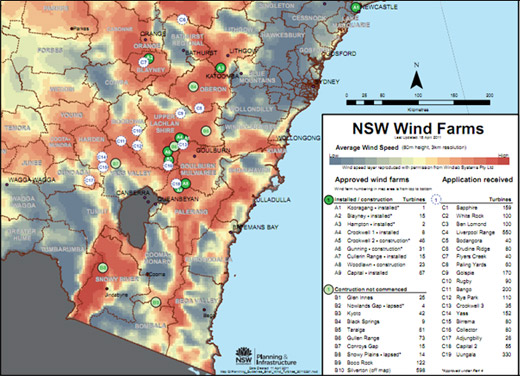
Source: NSW Planning and Infrastructure 2011
Table 1. Windfarms in the Australian Capital Region on the map in Figure 4
| Windfarm | Number on Map | Status | Number of turbines |
|---|---|---|---|
| Crookwell 1 | A4 | Installed | 8 |
| Crookwell 1 | A5 | Under construction | 46 |
| Gunning | A6 | Under construction | 31 |
| Cullerin Range | A7 | Installed | 15 |
| Woodlawn | A8 | Under construction | 23 |
| Capital | A9 | Installed | 67 |
| Taralga | B5 | Approved, construction not commenced | 61 |
| Gullen Range | B6 | Approved, construction not commenced | 73 |
| Conroys Gap | B7 | Approved, construction not commenced | 15 |
| Snowy Plains | B8 | Approved but lapsed | 14 |
| Boco Rock | B9 | Approved, construction not commenced | 122 |
| Paling Yards | C8 | Application received | 60 |
| Golspie | C9 | Application received | 170 |
| Rugby | C10 | Application received | 90 |
| Bango | C11 | Application received | 200 |
| Rye Park | C12 | Application received | 110 |
| Crookwell 3 | C13 | Application received | 35 |
| Yass | C14 | Application received | 152 |
| Birrema | C15 | Application received | 80 |
| Collector | C16 | Application received | 80 |
| Adjungbilly | C17 | Application received | 26 |
| Capital 2 | C18 | Application received | 55 |
Source: NSW Planning and Infrastructure 2011
Tourism
Climatic conditions are important for the health of Canberra's tourism industry, providing seasonal snow to the alpine region and seasonal dry times for the coast and the Canberra wine regions. Canberrans enjoy relative proximity and easy access to these amenities (ACT Government 2007).
Snow sports, recreational tourism and wineries are clearly dependent on climate. Climate conditions over the past 40 years indicate that the winter tourism industry has been increasingly challenged by reduction in snow cover (Hennessy et al. 2003). However, coastal activities, wildlife watching, trekking, camping, climbing and fishing could benefit from the predicted drier and warmer conditions, and there could be a longer traditional peak summer holiday period. There are also risks to tourism from increased extreme weather events such as storms and fires (Garnaut 2008).
With more than 140 cool climate vineyards in the Canberra District, the wine industry has become an important tourist attraction in the region, apart from its contribution to the agricultural sector. Commercial vineyards are mostly located in areas outside the ACT, such as at Murrumbateman and Lake George. Thirty-three wineries are within 35 minutes drive of Canberra (CDWIA 2010). These businesses are highly sensitive to climate conditions for productivity, as is, in turn, the tourism generated by the viticulture (Belliveau et al. 2006).
Temperature is a key driver of vine phenology (the cycle of dormancy, growth and fruiting). To break from their winter dormancy, vines need a warm period following cold or cool periods to be "sure" that winter is over; shoots that develop during winter do not survive. Usually 12 days of air temperatures above 5-10°C initiates circulation within the plant. The vine also needs particular levels of warmth during the bud blooming and flowering phases as shown in Figure 5 (ONERC 2006).
Figure 5: Vine biological cycle Vitis vinifera
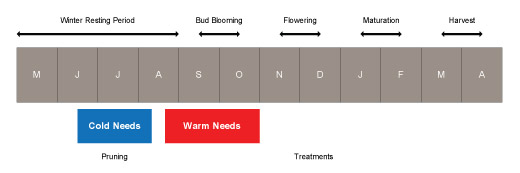
Source: ONERC 2006
The range in temperatures, vineyard elevations and varying soil types in the region makes it possible to produce a wide range of grape varieties. Grape varieties are grouped into four main classes: cool, intermediate, warm and hot. Most of the varieties grown in the ACT region are in the cool class (13 to 15°C average temperature during the growing season) and intermediate class (15 to 17°C average temperature during the growing season). The most commonly produced grape varieties in the ACT are Sangiovese, Riesling, Chardonnay, Pinot Noir and Shiraz.
Agriculture
While climate is a defining factor in agricultural land use patterns and production generally, it does not dominate vulnerability for the ACT agricultural sector which is more affected by soil types and conditions, topography and water availability. Agricultural practices are a legacy of land use before the Territory's conception rather than a reflection of current industry practice of the Region. Agricultural operations represented just 3% of registered businesses in the ACT in 2007 (ABS 2009). Wider trends across Australia appear to mirror industry shifts in the ACT, as observed in the 2009-10 financial year with the value of Australian agricultural production decreasing by 5% from the previous year (ABS 2011). These results were explained as a reflection of the strong exchange rates for the Australian dollar, decreased crop sizes and number of stock (because viable farming areas were taken for urbanisation at city fringes), and increased external competition.
General
Climate as a resource shares direct links with pressure indicators such as energy use, CO2
emissions and methane emissions, as well as other response indicators such as energy supply and reduction of emissions in waste and transport. Further, climate as a resource is closely linked to the ACT's mitigation response. Responses associated with this indicator over the 2007-11 reporting period stretch beyond the ACT boundaries. Although this is beyond the scope of the report, it is an indication of some of the mobility and transport dependencies apparent in the ACT.
Footnotes [top ]
1. The Australian Capital Region includes the 17 local government areas surrounding Canberra: Bega Valley, Boorowa, Bombala, Cooma-Monaro, Cootamundra, Eurobodalla, Gundagai, Goulburn-Mulwaree, Harden, Palerang, Queanbeyan City, Tumbarumba, Tumut, Snowy River, Upper Lachlan, Yass Valley and Young.
2. Based on an ACT building with 2000 m2 of office area and a 3-star NABERS Energy rating
References [top ]
ACT Government 2007. Weathering the Change - The ACT Climate Change Strategy 2007-2025. Canberra. http://www.environment.act.gov.au/__data/assets/pdf_file/0007/144529/Climate_Change_Strategy.pdf (accessed 13/11/11)
AGL Energy Limited, 2009. AGL Hallett Wind Farm Portfolio Equity Investor Tour. South Australia. http://www.agl.com.au/Downloads/AGL%20Hallett%20Wind%20Farm%20Portfolio%20Equity%20Investor%20Tour.pdf (accessed 17/6/11)
ASES 2006. Australian Solar Radiation Data Handbook. 4th Edition. Australian Solar Energy Society Ltd. Frenchs Forest. NSW
ABS 2002. 4649.0.55.001 - Energy Statistics, Australia 2001-02. Australian Bureau of Statistics. Australian Government. Canberra. http://www.abs.gov.au/ausstats/abs@.nsf/0/1DD46A713657BA33CA256E000075736B?OpenDocument (accessed 1/11/11)
ABS 2009. 1379.0.55.001 — National Regional Profile, Australian Capital Territory, 2005-2009. Australian Bureau of Statistics. Australian Government. Canberra. http://www.abs.gov.au/AUSSTATS/subscriber.nsf/log?openagent&nrp%202004-2010%20csv%20file.csv&1379.0.55.001&Data%20Cubes&72FA2883275E0F35CA25793D000CAC8B&0&2006%20to%202010&04.11.2011&Latest (accessed 4/9/11)
ABS 2011. 7503.0 — Value of Agricultural Commodities Produced, Australia, 2009-10. Australian Bureau of Statistics. Austrailan Government. Canberra. http://www.abs.gov.au/ausstats/abs@.nsf/products/824FCFDA36C8825ECA2578A00014F3DB?OpenDocument (accessed 9/6/11)
Belliveau, S., Smit, B., Bradshaw, B. 2006. Multiple exposures and dynamic Vulnerability: Evidence from the grape in the Okanagan Valley, Canada. Global Environmental Change. 16:364-78
CDWIA 2010. Welcome to the Canberra District Wines. Canberra District Wine Industry Association. http://www.canberrawines.com.au (accessed 10/6/11)
CSIRO 2003. Wind Resource Assessment in Australia — A Planners Guide. Wind Energy Research Unit. CSIRO Land and Water. Canberra. http://www.csiro.au/files/files/pis7.pdf (accessed 17/6/11)
Engineers Australia 2009. Energy. http://www.engineersaustralia.org.au/sites/default/files/shado/Infrastructure%20Report%20Cards/ACT/part4_energy.pdf (accessed 10/6/11)
Garnaut, R. 2008. The Garnaut Climate Change Review — Final Report. Cambridge University Press. Port Melbourne. http://www.garnautreview.org.au/CA25734E0016A131/WebObj/GarnautClimateChangeReview-FinalReport-30September2008(Fullversion)/%24File/Garnaut%20Climate%20Change%20Review%20-%20Final%20Report%20-%2030%20September%202008%20(Full%20version).pdf (accessed 12/10/11)
Hennessy, K., Whetton, P., Smith, I., Bathols, J., Hutchinson, M. and Sharples, J. 2003. The Impact of Climate Change on Snow Conditions in Mainland Australia. CSIRO Atmospheric Research. Aspendale
ICRC 2011. ACT Greenhouse Gas Inventory Report for 2008-09. Independent Competition and Regulatory Commission. ACT Government. Canberra. http://www.icrc.act.gov.au/__data/assets/pdf_file/0009/235719/ACT_Greenhouse_Gas_Inventory_Report_2009_Final.pdf (accessed 17/11/11)
NSW Planning and Infrastructure 2011. NSW Wind Farms. NSW Government. Sydney. http://www.planning.nsw.gov.au/LinkClick.aspx?fileticket=HC-K5QiJVsM%3d&tabid=394&language=en-US (accessed 17/10/11)
ONERC 2006. Impacts du Changement Climatique sur les Activites Viti - Vinicoles. Observatoire National sur les Effects du Rechauffement Climatique. Paris. http://www.developpement-durable.gouv.fr/IMG/ecologie/pdf/note_technique_no3_version_Internet.pdf (accessed 20/6/11)
PB 2008. Solar Power Plan Pre-feasibility Study. Parsons Brinckerhoff Australia Pty Limited. Brisbane. http://www.environment.act.gov.au/__data/assets/pdf_file/0019/154054/Solar_Power_Plant_Pre-feasibility_study.pdf (accessed 20/6/11)
Webb, B. 2011. Impacts of Climate on the Canberra Nature Park: Risks and Responses. Report for the ACT Office of the Commissioner for Sustainability and the Environment. Canberra. http://www.envcomm.act.gov.au/__data/assets/pdf_file/0004/220477/OCSE_ANU_paper_climate_CNP.pdf (accessed 1/12/11)
Wind Prospect Ltd 2011a. Boco Rock Wind Farm: Facts and Figures. Newcastle. http://bocorockwindfarm.com.au/facts_figures (accessed 17/6/11)
Wind Prospect Ltd 2011b. Sapphire Wind Farm: Facts and Figures. Newcastle. http://sapphirewindfarm.com.au/facts_figures (accessed 17/6/11)
Other data sources
In addition to these published reports, data for this paper were also sourced from:
-
Environment and Sustainable Development Directorate (ESDD)


Share this page: