


ACT State of the Environment Report 2011
Accurate, timely & accessible information for the community regarding the condition of the environment, underlying pressures, and sustainability trends.
THEME: Climate
Indicator cluster: Climate vulnerability
Download: Indicator cluster: Climate vulnerability.pdf
The indicators for this cluster are:
- Climate and water resources (P) - the pressures from a changing climate on water resources including rainfall, inflows into dams, and evaporation;
- Climate and fire (P) - the pressures from a changing climate;
- Climate and human health (I) - including heat related illness and death, food and water shortages, malnutrition and disease; and
- Climate and native species (I) - major challenges to native species and ecosystems from a changing climate.
Condition indicators (C) present data that tell us the state of the environment at any particular time.
Pressure indicators (P) present data about the main human activities that could potentially adversely affect the condition of the environment.
Impact indicators (I) present data on the effect that environmental changes have on environmental or human health.
Response indicators (R) present data about the main things we are doing to alleviate pressures, or to improve the condition of the environment.
Summary [top  ]
]
In the coming decades impacts from climate change are predicted to become increasingly prevalent in the ACT. Climate change could bring additional pressures to bear on the Territory's water resources and biodiversity, and may significantly change the patterns of bushfire and extreme weather events. Predicted climate change impacts are likely to place additional pressure on the existing burden of disease and add to existing health risks (and therefore to the demand on health facilities).
Introduction [top ]
Climate change will have direct and indirect impacts on the urban, social and natural environment of the ACT (Figure 1). This indicator cluster paper investigates the likely consequences for the ACT's water resources and bushfire sensitivity, and assesses potential impacts on human health and native species.
Figure 1. Potential climate change impacts
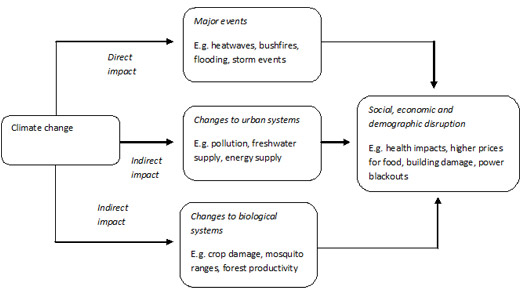
Source: based on ACT Government 2007
Condition indicators [top ]
There are no condition indicators for this indicator cluster.
The most likely future climate scenario for the ACT includes (Webb 2011):
- the strong likelihood of mean temperatures continuing to increase, along with more frequent and severe heatwaves for the ACT and region; and
- a high probability of changes in the pattern of rainfall from that observed during the period of instrumental records, with some risk of a decline in long-term average rainfall; and in addition, the likelihood of an increase in rainfall intensity with more extreme rainfall events.
In terms of the physical impacts, expected changes in climate are likely to lead to (Webb 2011):
- increased evaporation (especially in spring and summer), which, combined with potential changes in rainfall, is likely to result in reduced soil moisture (particularly in winter and spring if autumn rainfalls also remain historically low);
- changes in run-off and streamflows, with higher evaporation in spring and summer tending to reduce run-off during those periods;
- an increase in the severity of drought because of higher temperatures;
- more frequent and intense bushfires overall, because of higher temperatures, drier conditions and lower humidity, with extension of the fire season into spring; changes in fuel availability will add significant uncertainty in projections; and
- more intense flood-producing rainfall events with impacts depending in part on the prevailing catchment conditions (i.e. soil moisture and levels in major water storages).
For more information on weather and climate see the Driving Forces paper.
Pressure indicators [top ]
Small changes in average values of climatic parameters such as temperature and rainfall can lead to large changes in the frequency and intensity of extreme events such as heatwaves, storms and fires (see Figure 2).
Figure 2. Relationship between means and extremes
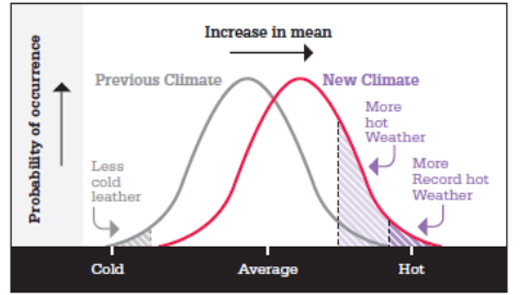
Source: Commonwealth of Australia 2011
Thinking forward to the year 2050, Table 1 shows the projected mean number of days above 35°C and 40°C for two modelled scenarios, in comparison to the current climate.
Table 1: Mean annual number of days above 35°C or above 40°C if a 2°C global warming by 2050
| Current climate* | Most likely future climate | Worst case senario | |
|---|---|---|---|
| Mean annual number of days above 35oC | 5 days | 20 days | 21.5 days |
| Mean annual number of days above 40oC | Around 0.1 day | 2 days | 2.7 days |
Source: AECOM 2010 (based on work by BOM and CSIRO)
*Note: The 'current climate' annual number of days >35°C and >40°C is the 1939-2010 mean for Canberra Airport.
Climate and water resources
Over the past decade the ACT has experienced long periods of drought which have resulted in water stress. The ACT draws its potable water supply from three catchments and four reservoirs. See the Water supply indicator cluster for more information.
Urban water consumption in the ACT tends to increase in the summer months when residents give more water to their gardens (Engineers Australia 2010). Consequently, increases in average temperatures lead to increases in potable water consumption. Work commissioned by ACTPLA indicates that some of the older suburbs in Canberra use more water because the house blocks are large and the gardens were mostly designed during wet decades, with little consideration given to outdoor water use (AECOM 2010). Such areas are likely to be more vulnerable to cuts in water supply.
Regardless of changes in rainfall, the predicted rise in average temperatures in the region is likely to increase the demand for water in the ACT, increasing the pressure on overall water storage. In planning for future water availability, ACTEW is assuming average annual total inflows to the three main reservoirs will be around 105 GL per year (ACTEW 2007). This is significantly less than the average annual inflows estimated by CSIRO research in 2005 (132 GL per year) and than the previous average annual inflows (approximately 200 GL per year).
All three of the ACT's water supply catchments are dependent on rainfall to fill the storages, resulting in a water supply that is highly sensitive to changes in rainfall patterns. Studies by ACTEW show that the surface runoff feeding the dams has decreased since the 1990s. The decline in historic flows to ACT reservoirs is shown in Figure 3. The major damage caused by the 2003 bushfire in the Cotter catchment resulted in increased runoff in the short term because of the loss of vegetation, and reduced runoff in the long term because of the rapid rate of vegetation regrowth (Engineers Australia 2010).
Figure 3. Annual inflows to Corin, Bendora and Googong reservoirs 1871-2006
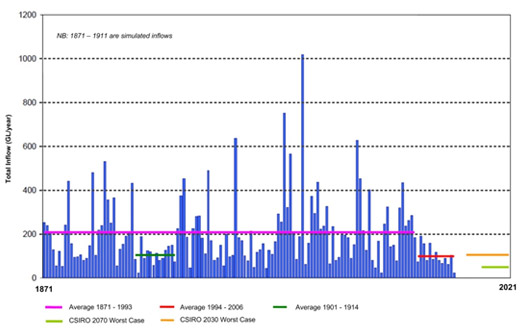
Source: ACTEW 2007
Note: 1871-1911 are simulated inflows
Reporting in Climate Change Impacts on Australia and the Benefits of Early Action to Reduce Global Greenhouse Gas Emissions (Hennessy 2006) shows that inflows to reservoirs in NSW have been projected to decrease by up to 15% for every 1°C increase in temperature. Mean rainfall is expected to show little change.
For more information on water supply and condition of water bodies see the Water supply and River, lakes and wetlands health indicator clusters.
Climate and fire
Climate and fire in urban areas
Much of the ACT population lives on the border of, or close to, bushland, putting these residents at increased risk from bushfire. Furthermore, a percentage of the ACT's urban environment is situated on vegetated mid slopes and in valley bottoms - areas at increased risk from bushfire. The greater the slope, the higher the potential for high-speed fire movement (Bradstock et al. 1998). The risk that fire poses to the ACT urban population became apparent in 2003 when bushfires burned 500 homes and around 70% of the Territory's forests and pasture land.
Historically, fire managers have used fire danger indices. Examples include the Forest Fire Danger Index (FFDI) and Grassland Fire Danger Index (GFDI) that provide an indication of fire risk based on various combinations of weather variables, including daily temperature, precipitation, relative humidity and wind-speed. These indices are also used to raise awareness and set up prevention measures, by being displayed on boards across the Territory. They have been used in combination with other indicators to represent overall exposure to bushfire under a changing climate (see Table A1 in the Annex to this paper).
As a result of potentially hotter and drier conditions, it is expected that bushfire risk will increase. The average number of days when the FFDI is rated very high or extreme under present conditions, and for the year 2050, are (Hennessy et al. 2006):
- Present conditions - 23 days;
- 2050 (low level) - 28 days; and
- 2050 (high) - 36 days.
Figure 4 shows the exposure to bushfire as a result of predicted climate change (in 2050 after mean warming of 2°C) across ACT suburbs, based on the factors presented in Table A1 (Annex). The map is useful to show where more exposure to bushfire may exist as a result of overlapping of influential factors affecting vulnerability levels.
Figure 4: Exposure to bushfire
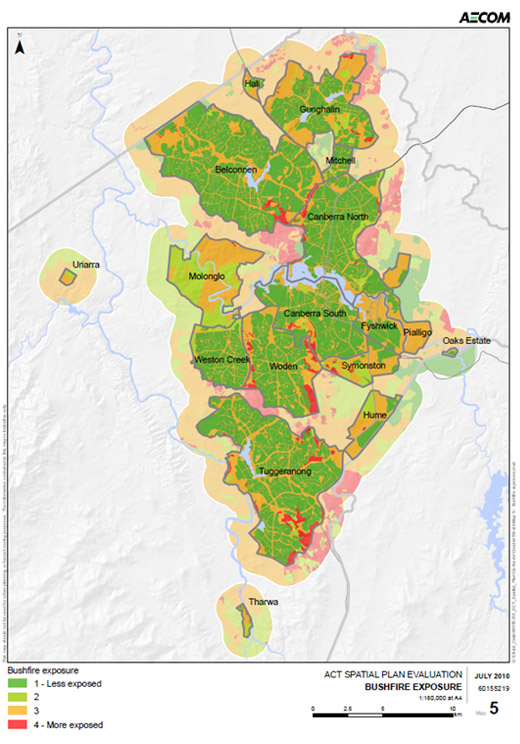
Source: AECOM 2010
If fire patterns change, that will not only affect humans and the urban area but biodiversity as well. Changes to fire regimes can change species distribution and populations (Webb 2011). However, the interdependencies between ecosystems and fire regimes are complex. Some modelling of the impacts of climate change on fire regimes has been undertaken for the ACT, and it predicted that a 2°C increase in mean annual temperature would increase the landscape measure of fire intensity by 25%, and increase the area burnt, and reduce the intervals between fires (Webb 2011).
Impact indicators [top ]
Climate and human health
Climate change impacts on human health could be both direct (e.g. heatwaves) and indirect (e.g. extreme weather events such as fires and floods have consequences for food availability, which can have health implications). Predicted climate change impacts are likely to place additional pressure on the existing burden of disease, and add to existing health risks (and therefore to the demand on health facilities) (Rotstein and Webb 2009). In the ACT and region, more frequent heatwaves, bushfires and drought are likely to increase health risks, especially for vulnerable population groups such as the aged, and rural communities, and people with low income (Rotstein and Webb 2009).
Likely health impacts from climate change include (Garnaut 2008 in Rotstein and Webb 2009):
- temperature-related illness and death;
- food and water-borne diseases resulting from changes in water quality and the range of bacteria and pests;
- respiratory disease;
- mental health disorders because of social disruptions;
- vector-borne disease because of a change in the ranges of types of mosquitoes and other disease-carrying species; and
- injury, trauma and related effects from an increase in extreme weather events.
Heatwaves
The more frequent and intense heatwaves that are predicted as a result of changing climatic conditions in the ACT are likely to exacerbate existing health conditions. The highest risks will be faced by the most vulnerable groups of society, including the elderly, the very young, and those dealing with other health, social and economic factors (McInnes et al. 2008). Existing stresses in the health system are also likely to be worsened by climate change.
As climate patterns change, days of extreme heat are likely to become more common. Factors listed in Table 2 help indicate groups that will be sensitive to more frequent and intense heatwaves (Table 2).
Table 2: Factors used for a measure of extreme heat sensitivity
| Factors | Description |
|---|---|
| Daily extreme temperature | Characterises the pattern of daily extreme temperature in the ACT based on gridded data from the Bureau of Meteorology |
| Changes in annual number of days >35°C and days >40°C | Based on CSIRO projections, this factor shows changes in hot and very hot days for the ACT compared to historical data |
| Relevant health conditions in the population | Combines information on the prevalence of conditions in the population from major diagnostic categories that may influence sensitivity to extreme heat events. These include diseases and disorders of the respiratory system, circulatory system, hepatobiliary system and pancreas, kidney and urinary tract, newborns and other neonates and mental diseases or disorders |
| Number of general practitioners per 10,000 inhabitants in each area | Provides an indirect measure of the access to health practitioners within each area during heatwave events |
Source: AECOM 2010
Historically there are strong correlations between extreme heat events, heat-related morbidity and vulnerable groups of people. The International Federation of Red Cross and Red Crescent Societies reported that during the record-breaking heatwave of August 2003 in Europe, between 22,000 and 35,000 excess deaths occurred in a two-week period (Walter, 2004). Not all of these deaths are attributed directly to the heatwave. Some were because the heat exacerbated pre-existing illnesses, 'particularly cardiovascular and respiratory diseases, and diseases of the nervous system' (McInnes et al. 2008). A 2008 study of the relationship between heatwaves and hospital admissions in Adelaide in South Australia (Hansen et al. 2008) found a correlation between renal disease and acute renal failure and heatwaves. The increasing mean age of the Australian population is compounding the risks to human health from predicted climate change, because the elderly are generally more susceptible to poor health.
The greatest threat from heatwaves arises when there are consecutive days of maximum day-time temperatures much hotter than usual for the location, with hot nights, early in the summer (McInnes et al. 2008). People are more at risk if they live in a city, if they live in housing that does not have insulation, and if there are bedrooms located directly under the roof. Fans are not considered effective in times of high humidity and temperature, and may in fact be harmful in enclosed hot environments (McInnes et al. 2008).
Climate and native species
More than 1700 species and ecological communities in Australia are known to be threatened and at risk of extinction (NRMMC 2010). Climate change is predicted to be a contributing factor adding to the risk of native species extinction. Direct impacts are likely to result from changes in the number, abundance and range and genetic traits of species, changes in the phenology and seasonal occurrence of key processes and change in species' vegetal productivity and morphology. Further indirect impacts are expected in relation to water availability, fire and pest distribution (AECOM 2009).
A 2011 comprehensive review of climate change implications for the ACT Nature Reserves included some information on the vulnerability of ACT native species, drawn from earlier work (Sharp et al. 2008 in Webb, 2011) which indicated that:
- Natural Temperate Grassland and Snow Gum / Candlebark tableland woodland are potentially vulnerable lowland ecosystems dependent on low temperature conditions for their distribution; higher temperatures could also support invasion by other species;
- reduced water availability will potentially affect fish through their migration and spawning patterns, as well as other aquatic vertebrates, macroinvertebrates and macrophytes as well as adjacent riparian systems; and
- riparian systems with less flow and flooding are potentially vulnerable to non- riparian weed invasion.
Climate change will increase the vulnerability of species directly through: heat stress and changes to growth and water use in plants; concentration of nutrients and toxins in leaves; timing of seed germination and flowering in plants; and egg laying and hatching in birds, reptiles and insects (Webb 2011). Those at most risk from climate change are species that are sensitive to physiological tolerances, reliant on symbiotic relationships with other species, limited in their capacity to move and dependent on habitat that is likely to disappear (DECCW 2010). Some hardy generalists and invasive species are expected to persist and spread. The ecosystems of the ACT are already being affected by climate change, as indicated by a number of extinctions, functional extinctions and threatened species; changes in relative abundance, diversity, distribution and range of species; and in an increased presence of introduced species in the ACT (Webb 2011).
During the reporting period, a multidisciplinary team analysed at national level the interactions between climate change, fire regimes and biodiversity in Australia (Williams et al. 2009). The two biomes of relevance to the ACT were temperate / cool sclerophyll forests of south-eastern Australia (similar to the south-west of the ACT in Namadgi National Park) and the temperate grassy woodlands of inland eastern Australia (similar to the north-east area of the ACT including the nature reserves). The study concluded that climate impacts on bushfire risk are significant in forest, grassy woodland and grassland areas. However, these impacts may be greater in forested areas in the ACT and region (Williams et al. 2009). Further research is needed on the impacts of climate change on fuel loads and the potential rates of fire spread (Williams et al. 2009).
For more information on climate change impacts on biodiversity see the Threatening processes indicator cluster in the Biodiversity theme.
References [top ]
ACT Government 2007. Weathering the Change - The ACT Climate Change Strategy 2007-2025. Canberra. http://www.environment.act.gov.au/__data/assets/pdf_file/0007/144529/Climate_Change_Strategy.pdf (accessed 13/11/11)
ACTEW Corporation 2007. Water Security for the ACT and Region, Recommendations to the ACT Government. Canberra. http://www.bom.gov.au/water/nwa/2010/canberra/files/pdfs/1_Water_security__recommendations_to_ACT_Govt_Jul_20071.pdf (accessed 12/9/11)
AECOM 2009. Identifying Climate Change Adaptation Strategies to inform Wetland and Floodplain Management Along the River Murray in SA. South Australia Murray-Darling Basin Natural Resources Management Board. unpublished
AECOM 2010. Human Settlement Vulnerability and Adaptive Capacity Assessment - Spatial Plan Evaluation. Report for ACT Planning and Land Authority. AECOM. http://www.actpla.act.gov.au/__data/assets/pdf_file/0007/20410/2010_09_08_ACTPLA_CCVulnerability_v2_LowResolution.pdf (accessed 19/9/11)
Bradstock, R. A., Bedward, M., Kenny, B. J. and Scott, J. 1998. Spatially-explicit simulation of the effect of prescribed burning on fire regimes and plant extinctions in shrublands typical of south-eastern Australia. Biological Conservation. 86: 83-95
Commonwealth of Australia (Department of Climate Change and Energy Efficiency) 2011. The Critical Decade Climate science, risks and responses. Climate Commission, Canberra. http://climatecommission.gov.au/wp-content/uploads/4108-CC-Science-WEB_3-June.pdf
CSIRO 2010. Climate Futures for Canberra. Report for AECOM. Commonwealth Scientific and Industrial Research Organisation. Canberra
DECCEW 2010. Review of the Nature Conservation Act 1980, Enhancing nature conservation in the Australian Capital Territory. Department of the Environment, Climate Change, Energy and Water http://www.environment.act.gov.au/__data/assets/pdf_file/0005/209984/Review_of_the_Nature_Conservation_Act_Discussion_Paper_WEB.pdf (accessed 02/8/2011)
Engineers Australia 2010. Infrastructure Report Card. Canberra Division, 13 July 2010. http://www.engineersaustralia.org.au/sites/default/files/shado/Infrastructure%20Report%20Cards/ACT/entire_report.pdf (accessed 7/9/11)
Hansen, A., Peng, L., Ryan,P., Nitschke, M., Pisaniello. D., and Tucker,G., 2008. The effect of heat waves on hospital admissions for renal disease in a temperate city of Australia. International Journal of Epidemiology. 37:1359-1365 http://ije.oxfordjournals.org/content/37/6/1359.full.pdf+html (accessed 18/10/11)
Hennessy, K., Lucas, C., Nicholls, N., Bathols, J., Suppiah, R., Ricketts, J. 2006. Climate change impacts on fire-weather in south-east Australia. CSIRO, Australia
McInnes, J., Ibrahim, J. and Loughnan, M. 2008. Reducing harm to older persons in Victoria from extreme hot weather. Centre of Research Excellence in Patient Safety. Monash University.Final Report to the Department of Human Services, Victoria. Melbourne. http://www.health.vic.gov.au/environment/downloads/reducing_harm_monash.pdf (accessed 15/9/11)
Natural Resource Management Ministerial Council (NRMMC) 2010. Biodiversity, A Summary of Australia's Biodiversity Conservation Strategy 2010-2030. http://www.environment.gov.au/biodiversity/publications/strategy-2010-30/pubs/biodiversity-strategy-2010-brochure.pdf (accessed 16/6/2011)
Rotstein, J. and Webb B. 2009. Australian Capital Territory and Region Climate Change Vulnerability and Adaptation Project; Knowledge status and future issues report - Human Health. Report to the Department of Environment, Climate Change, Energy and Water. unpublished
Walter, J. 2004. World Disasters Report: Focus On Community Resilience. International Federation of Red Cross and Red Crescent Societies. Switzerland
Webb, B. 2011. Impacts of Climate on the Canberra Nature Park: Risks and Responses. Report for the ACT Office of the Commissioner for Sustainability and the Environment. Canberra. http://www.envcomm.act.gov.au/__data/assets/pdf_file/0004/220477/OCSE_ANU_paper_climate_CNP.pdf (accessed 1/12/11)
Williams R.J., Bradstock R.A., Cary G.J., Gill A.M., Liedloff A.C., Lucas C., Whelan R.J., Andersen A.N., Bowman D.M.J.S., Clarke P.J., Cook G.D., Hennessy K.J. and York A. 2009. Interactions between Climate Change, Fire Regimes and Biodiversity in Australia: A Preliminary Assessment. Report to the Commonwealth Department of Climate Change and Department of the Environment, Water, Heritage and the Arts, Canberra. http://climatechange.gov.au/~/media/publications/adaptation/fire-report.pdf ( accessed 21/9/11)
Annex [top ]
Table A1: Factors used for a measure of bushfire exposure
| Factors | Description |
|---|---|
| Grassland Fire Danger Index | A relative measure of the difficulty of fire suppression for grassland fuel type |
| Forest Fire Danger Index | A relative measure of the difficulty of fire suppression for forest fuel type |
| Fuel load | Overall fuel hazard based on the range of vegetation communities occurring in the ACT. Considers the entire fuel complex (bark, elevated, near surface and surface fine fuels). These representations of fuel load are presented for the years 2009, 2014, and 2019, and assume no intervention or hazard reduction activities. |
| Likelihood of ignition | An estimate of the likelihood of a fire starting and spreading based on historical pattern of ignition (human and natural causes) |
Source: Hennessy et al. 2006


Share this page: