


ACT State of the Environment Report 2011
Accurate, timely & accessible information for the community regarding the condition of the environment, underlying pressures, and sustainability trends.
THEME: People
Download: People Theme Paper.pdf
Introduction to the Theme
The way we design and use our urban areas, infrastructure and green spaces, can significantly affect the quality of the environments we inhabit. Conversely, the state of the natural environment impacts urban quality and our living conditions. Community engagement and levels of environmental awareness can also have a major influence on our resource use and the amount of waste we produce.
In 2013 Canberra will celebrate its centenary; 100 years since the establishment of the city as the Nation's capital. With a population now of over 350 000, Canberra is Australia's largest inland city, a Bush Capital, which continues to grow in population and size. ACT residents enjoy lifestyles that bring together the best of city living with the benefits of open-space and easy access to rural and bush landscapes. As the centre of national government and a major regional centre for south-east New South Wales, Canberra provides employment, education, health and retail services along with cultural, entertainment and recreational facilities for residents of the ACT and surrounding areas.
Six indicator clusters for the People theme:
Context [top  ]
]
As identified in the previous two State of Environment (SoE) Reports, our urban area continues to increase. In both the 2007 and current reporting periods there has been a greater focus on urban infill however most development has been in greenfield sites. The implementation of housing affordability actions continues, as recommended in the 2003 SoE Report, yet an adequate supply of housing to meet the changing needs of the population at a price newcomers to the market can afford, remains a challenge.
As identified in the previous two SoE Reports, private motor vehicles remain the dominant mode of transport in the ACT despite relative high levels of cycling and walking. The modest shift away from private car use seen in the last reporting period has not continued. Recommendations regarding sustainable transport from the 2007-8 SoE Report have only been partially implemented. A pedestrian action plan is yet to be finalised and targets for reductions in transport related greenhouse gas emissions have not been developed. While the Time to Talk consultation stimulated much discussion on transport issues, delays in developing the Sustainable Transport Action Plan (2010-2016) (recently re-titled Transport for Canberra 2011-31)mean that long-term innovative sustainable transport options have yet to be realised.
Waste generation in the ACT continues to increase at a faster rate than population growth. Waste to landfill has significantly increased this reporting period, largely driven by rises in construction and commercial waste. This is a reversal of the decrease in waste to landfill seen in the last two reporting periods. Efforts in recycling continue, with progress in public-place and e-waste recycling along with business waste reduction programs as indentified in 2007-08 State is the Environment Report recommendations. However, those regarding organic waste collection, promoting waste minimisation and waste minimisation/avoidance action plans have yet to be implemented. Further work is needed in all these areas.
Progress has been made in identifying and managing Aboriginal heritage places and objects since the 2003 State of the Environment Report, however information on existing Aboriginal heritage places needs to be updated.
While action in response to upcoming changes in heritage legislation, noted in 2007, has been undertaken, this is yet to be finalised. A more strategic approach to heritage identification outside the Development Application process is warranted. In view of the centenary in 2013, there are opportunities to promote the ACT’s rich heritage as part of celebrating 100 years since the capital was founded.
As noted in 2003 and 2007-08 State of the Environment Reports, many ACT residents are concerned with and involved in protecting the environment, however there is a disconnect between awareness and actions, particularly around consumption and transport use. Government and community responses to dealing with natural hazards in the wake of the 2003 bushfires are heartening, in particular the development of the Strategic Bushfire Management Plan for the ACT which integrates attention to ecological and community needs.
Many issues discussed in previous years remain relevant and recommendations are provided at the end of this paper to assist progress.
Theme summary: Key issues and outcomes [top ]
Time to Talk: Canberra 2030 (ACT Government 2010a) was an opportunity for extensive community consultation, which found that Canberrans love the city’s liveability, environment and open space. Most want a green and sustainable city that limits urban sprawl. There was support for strategic urban infill development that maintains its green spaces and enhances the character and amenity of the city, rather than detracting from it. However, the ACT is facing many challenges in maintaining its urban quality and increasing its sustainability into the future.
Urban quality
About a quarter of the total land in the ACT is used for urban development, with Canberra having a relatively low urban density compared to other Australian capital cities (Table 1).
Table 1. Comparison of densities of the populations of Australian cities
| City | Population | Density (per ha) |
|---|---|---|
| Canberra | 368,129 | 10.8 |
| Sydney | 4,119,189 | 20.4 |
| Melbourne | 3,592,592 | 15.7 |
| Brisbane | 1,763,129 | 9.2 |
| Perth | 1,445,073 | 12.1 |
| Adelaide | 1,105,839 | 13.8 |
| Hobart | 200,524 | 10.3 |
| All cities | 12,594,475 | n/a |
Source: based on Mees, Sorupia and Stone 2007
Suburbs that have undergone new housing development have seen an increase in their population during the reporting period. Examples of these growth areas include Gungahlin in the north, as well as areas of increasing infill development such as Braddon and Turner in North Canberra. Total population has declined slightly in areas with ageing populations and decreasing household size, such as Weston Creek and Tuggeranong (ACTPLA 2011).
Some community concern has been expressed (ACT Government 2010a) about altering the character of the city through replacing single detached houses with higher density developments such as townhouses and apartments. However, during the reporting period, by far the majority of new residential development was in greenfield sites, on land previously used for agricultural or other non-urban land uses (Table 2).
Table 2. Greenfield and infill development in the ACT, 2006 to May 2011
| Year | Infill (number of new housing units approved) | Greenfield (number of new housing units approved) |
|---|---|---|
| 2006-07 | 156 (7.4%) | 1966 (92.6%) |
| 2007-08 | 828 (12.9%) | 2642 (76.1%) |
| 2008-09 | 791 (18.8%) | 3417 (81.2%) |
| 2009-10 | 1893 (46.6%) | 2168 (53.4%) |
| 2010 to May 2011 | 1110 (22.2%) | 3890 (77.8%) |
Source: LAPS
Australian houses are now reported to be, on average, the largest in the developed world (CommSec 2009). However, in the ACT, both detached and other dwelling types built over the reporting period have for the first time, had average floor areas below the Australian average (ACT Government 2011). Larger houses are likely to be associated with higher rates of consumption related to construction, furnishing, renovation, maintenance and, notably, heating and cooling. Larger houses are also associated with greater areas of hard surfaces which decrease capacity for water retention within the building lot. Houses that are large relative to lot size also have little land available for gardens and outdoor recreational purposes. The social, health and environmental implications of these trends in housing and lot sizes need to be considered in future planning for a more sustainable city.
The city's environment, liveability and amenity depend in considerable measure on green infrastructure - features of the natural environment such as vegetation, parks and waterways. Urban open space and the Canberra Nature Park comprise less than 3% and 4% respectively of the ACT's total land area (PCL 2009). However, these areas are integral to the health and wellbeing of Canberra residents and contribute to Canberra's image as the Bush Capital. These spaces also perform a utilitarian function in stormwater management (ACTPLA 2008).
Canberra has an estimated 794 268 trees in streets, parks and open space (OCSE 2011a). Trees help ameliorate the effects of hot and cold weather, offer visual amenity, habitat and connectivity for biodiversity, and provide a physical link with Canberra's past and future. Compared with other Australian cities, the area of urban nature park or conservation area per person is high in Canberra (Figure 1). Yet, while Canberra's urban trees, parks and open spaces are a major asset, they are also a management challenge for the ACT Government (OCSE 2011b).
Figure 1. Area of nature or conservation reserve per person
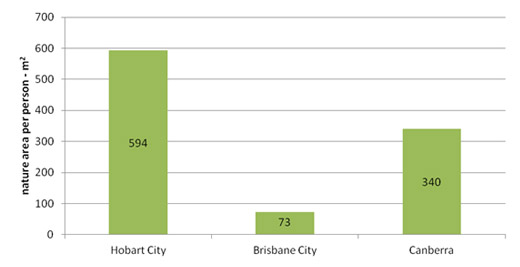
Source: OSCE 2011b
Note: The figure for Canberra does not include Namadgi National Park, Tidbinbilla Nature Reserve and Googong Foreshores
Transport
Transport patterns and trends in the ACT reveal a mixed picture; high automobile dependence and low public transport usage, but higher rates of cycling than the Australian average. Overall, rates of cycling and walking continue to increase, though they account for only a small share of work trips. Walking is more common than the national average for work trips but less common for non-work or school trips. Although in the five years to 2006 there was a modest shift away from the private car to public transport, the trend appears to have reversed since 2006. Public transport patronage has stagnated. Both total and per capita distance travelled by private vehicle is now growing at a faster rate than for any other Australian capital city. Although travel-to-work data are collected in the Census of Population and Housing, the last comprehensive travel survey of the ACT was conducted in 1997 and is now out of date, limiting our understanding of non-work travel.
Higher residential densities, of themselves, have not been associated with higher usage of sustainable transport options, with areas such as Gungahlin having even higher levels of car use than the ACT average (ABS 2008a). However, proximity to work appears to encourage sustainable transport use with workers employed in Civic and the town centres having much higher rates of cycling and walking to work than Canberrans employed in locations such as business parks and industrial areas (ABS 2008a). It will not be known if travel to work targets set out in the ACT Sustainable Transport Plan for 2011 were met until the release of ABS census data in 2012.
During the reporting period, 381 km of new road lanes were constructed with the length of bus lanes increased only slightly, though on-road cycle paths increased by 131 km (TAMS 2011). An additional 150km of footpaths and 10 km of off-road cycle paths were also built during the reporting period (TAMS 2011). Over the last 10 years, $700 million of transport infrastructure investment has been spent on roads and parking (ESDD 2011), with approximately $200 million of this spent on the Gungahlin Drive Extension. $300 million has been spent on public transport over the same period, as well as $80 million on cycling and walking infrastructure (ESDD 2011).
Waste
Continuing the trend identified in the previous reporting period, the total amount of waste generated in the ACT from 2007-08 to 2010-11 increased by almost 35%. Despite achieving large increases of almost 37% in the share of waste recycled, the volume of waste to landfill increased by 29% (Figure 2).
Increased waste generation is directly linked to increased consumption. In 2009 the ACT's ecological footprint was 13% higher than the national average. It has increased by 25% in the last 10 years (Dey 2010), probably as a result of high average incomes and resulting capacity to purchase large quantities of goods and services. This consumption behaviour, coupled with population growth, leads to increased waste generation.
Data indicate that construction and demolition, as well as commercial and industrial wastes (in particular additional deliveries of contaminated soil from the West Molonglo pond cleanup and elsewhere) have largely been driving the increase in waste to landfill over the reporting period (TAMS 2011). This in turn is likely to be due to increased construction and given predicted population growth and associated need for additional housing, suggests that reducing and managing these waste sources will be particularly challenging.
Figure 2. Waste Generation in the ACT, 2007-08 to 2010-11
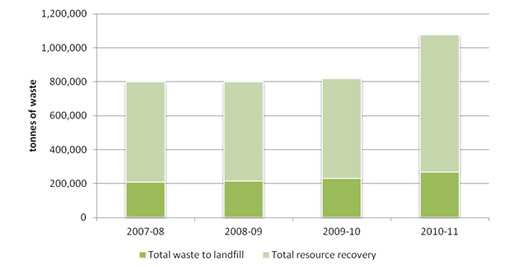
Source: TAMS
Although Australian governments have limited control over individual purchasing behaviours, they need to encourage and support behaviour change if waste reduction is to be achieved. Action at a policy and program level can raise awareness of the links between high levels of consumption and waste generation as well as influence expectations and set standards for residential and commercial construction.
Heritage
Canberra is a very young city. However, the ACT has a rich heritage of natural, Aboriginal, and historic places and objects. In March 2013, Canberra will celebrate its centenary. Preparations are in progress for a year-long program to highlight Canberra's role as the capital of Australia.
Table 3 shows numbers of historic heritage places listed on the ACT Heritage Register as registered, provisionally registered or nominated.
Table 3. Number of ACT historic heritage places or objects
| Activity | 2007-08 | 2008-09 | 2009-10 | 2010 to date |
|---|---|---|---|---|
| Registered places and objects | 112 | 129 | 134 | 142 |
| Provisionally registered places / objects | 15 | 6 | 7 | 10 |
| Nominated places and objects | 237 | 226 | 222 | 207 |
Source: ACT Heritage
Currently there is a large backlog in processing relating to the ACT Heritage Register, despite some reduction since the last reporting period. The capacity to reduce the backlog depends on numerous factors. These include levels of resourcing, the complexity of issues involved, the quality and age of information in some old nominations, the increasing level of documentation required for nominations. The number of new, high priority nominations that arise, is also a factor.
Heritage places and objects in the ACT are at risk because of limited funding for registration and for management of the pressures of development. Heritage protection legislation is in a period of transition: there is a new Heritage Council, and the Heritage Act 2004 is being reviewed. The review included a community consultation process and has been completed. The ACT Government is preparing its response to the findings and recommendations.
Since its establishment Canberra has had various stages of development, including a surge of residential development in the post-war years that resulted in rapid construction of many low-cost housing units. Buildings from this era are currently common subjects of renovation and replacement. Care needs to be taken to protect places and objects which, in other locations might not be considered for heritage protection. According to results from the Time to Talk consultation, the sense of place Canberrans have resides as much with the landscape - the mountains, ridges, bush and grasslands of the ACT as it does with the architectural elements of the city. It follows that protecting the natural heritage of the ACT is equally as important as conserving parts of the built environment.
Natural hazards
The ACT features rugged timbered mountains, hill country, grasslands and a network of river systems with just over half the Territory comprising conservation areas. This, and the close proximity of bushland reserves to urban areas, increases the level of risk of property damage resulting from natural hazards such as floods, storms and fire. New greenfield and peri-urban developments extend the area of the ACT that is vulnerable to natural hazards such as fires.
The ACT has experienced relatively few serious natural disasters; a recent exception being the 2003 bushfire. Significant research undertaken following the 2003 fires has improved understanding of the nature and behaviour of fires. Lessons learned from changes to fire management has informed the development of the Strategic Bushfire Management Plan for the ACT (ACT Government 2009b) and should continue to inform emergency plans for other natural disasters.
Under climate change predictions (Webb 2011), a heightened risk of natural hazards and disasters is expected to result from increased extreme events, higher average temperatures, more heat waves, storms and periods of intense rain. Governments at all levels are recognising the need to develop resilience and capacity within the community, to prepare for, and deal with, the impacts of natural hazards. Territory-wide risk assessment and planning are currently in progress (Commonwealth of Australia 2011).
Community engagement
Compared to the Australian average, ACT residents have a relatively high level of environmental concern (ABS 2008b, 2010a). People living and working in the ACT, along with residents of surrounding rural areas and towns, are active in various environmental groups. They engage in regeneration, protection and research activities, many demonstrating their commitment over long periods of time and to multiple projects. For example, the Canberra Ornithologists Group provides much of the data on native birds in the ACT. Catchment management groups, Parkcare, Waterwatch and various "friends" groups continue to work to control weeds and monitor and maintain local waterways, wetlands and ecological communities. Welcome funding and other resources for many of these initiatives is provided through government and business partnerships.
Along with these community-based actions, Government initiatives and programs aim to raise awareness and educate the ACT community on issues relating to the local and wider environment. A particular focus has been on increasing resource efficiency, especially via water and energy efficiency audits and rebates. In general, ACT residents are reducing their water and energy use and are actively recycling waste. However, levels of awareness do not always correlate with action. For example, 66% of Canberra people are aware of GreenPower (well above the Australian average of 47%), but the percentage of people who actually purchase GreenPower in the ACT is 4.9% which is slightly below the Australian average of 5.3% (ABS 2010). Current and emerging challenges facing the ACT include making more use of sustainable transport options, and reducing present high levels of consumption and associated waste generation.
The Time to Talk Canberra 2030 community consultation (ACT 2010a), conducted during 2010 by the ACT Government, involved thousands of Canberrans in face-to-face and online forums. The aim was to canvas community opinions about land-use planning, transport, climate change, water and energy, in order to help inform the review and development of strategic government policy.
Despite Canberra's highly educated, environmentally aware, and engaged population, the ACT ecological footprint is large and increasing. Waste generation maintains an upward trend, and both distance travelled by car and our urban area continue to grow, as does our use of energy and water.
Responses and effectiveness [top ]
The ACT Government has responded to many of the environmental issues identified above and in the last State of the Environment Report. Responses have included a number of separate initiatives, designed to address issues in particular components of the natural and built environment (see Sustainability Stories). These initiatives and programs are an essential component in efforts to achieve environmental protection and enhanced sustainability. However, they need to be part of a strategic, ongoing approach to sustainability which recognises the complexity of the issues and works to better integrate the protection of the ACT natural environment, the development of Canberra as a city and the enhancement of the population's wellbeing.
Urban quality
A sustainable city is, arguably, one that balances environmental, social and economic needs. Within this framework, environmental and heritage values are protected; residents also have access to appropriate, affordable housing, with proximity to work and recreational opportunities along with community facilities such as schools, shops, medical and other services. Furthermore, a sustainable city offers an integrated transport network allowing people to move between energy efficient residential and commercial buildings.
The Canberra Spatial Plan (ACTPLA 2004) seeks to capitalise on Canberra's polycentric city structure by achieving strategically located pockets of medium-density development around town centres. The aim is to support more distributed employment and services, linked by rapid and frequent bus services. Denser housing in established areas, such as town centres, can mean residents have better access to places of work, leisure and community facilities, as well as public transport.
The Canberra Spatial Plan (ACTPLA 2004) also sets out objectives based on a concentric model that restricts all urban growth to within 15 km of Civic, and intensifies residential development so that 50% of it occurs within a 7.5 km radius of Civic (ACTPLA 2004).
Performance against these objectives has improved over the reporting period, with residential development within the 15km range increasing from 92.2% to 96.7% (Table 1). However, the urban intensification boundary target has not been met since 2006-07 and development occurring within a 7.5 km radius of Civic fell to 28.5% in 2009-10 (Table 4).
Table 4. Trends in urban development location relative to ACT Spatial Plan 2004 objectives during the current and previous reporting periods
| 2004-05 | 2005-06 | 2006-07 | 2007-08 | 2008-09 | 2009-10 | |
|---|---|---|---|---|---|---|
| Residential development within 7.5 km of Civic | 43.6% | 40.5% | 53.3% | 48.5% | 37.8% | 28.5% |
| Residential development within 15 km of Civic | 93.0% | 92.1% | 91.4% | 92.2% | 95.4% | 96.7% |
Source: ACTPLA 2011
ACT Government strategies to enhance these urban qualities and their outcomes over the reporting period are detailed in the Urban Quality indicator cluster paper. Initiatives in use in ACT have included:
- draft amendments to the Territory Plan (ACTPLA 2008) to improve solar efficiency of houses, released in 2011;
- mandatory disclosure of energy efficiency ratings for commercial buildings;
- development of greenfield land primarily through the Land Development Agency, with objectives including meeting demand, providing affordable land and housing and establishing an inventory of serviced land;
- a 5-year infrastructure program, Building the Future (ACT Government 2008), established in the 2008-09 Budget, increased the ACT's infrastructure asset base by 10%.
There are currently no measures or targets in place for defining or assessing urban quality. Determining these in the near future would allow for assessment against a consistent set of indicators and permit comparison over time.
Following rezoning through the Territory Plan, there has been a shift towards redeveloping commercial land for residential uses and creating higher density developments around transport corridors and existing infrastructure. As a result, residential population densities have increased in Canberra's town centres and in the suburbs of Bruce and Kingston and along Northbourne Avenue.
Despite these developments, Canberra is considerably less self-contained than the Y-Plan1 envisaged. Substantially more employment is located in Civic and surrounds than was anticipated, with the result that Civic has been growing at the expense of other town centres. More office parks have been built; an example being the Brindabella Business Park at the airport. The location of such business parks away from residential centres exacerbates the need for travel, primarily by car, between residential locations and these more remote employment and service areas, reducing self-containment as a result.
Recent investigations of urban trees and nature parks in the ACT have also identified the benefits of green infrastructure to our city but also highlighted the management challenges. This has been echoed by the community in the Time to Talk consultations.
Transport
The ACT Government's response to the environmental impacts of the transport system relies on reducing emissions from individual vehicles through technological change, and reducing travel to work by private car. Actions for implementing the Sustainable Transport Plan were to be set out in the Sustainable Transport Action Plan 2010-2016, however as of the end of this reporting period this plan had not yet been released, with a draft due to be available for public comment in late 2011, re-titled Transport for Canberra 2011-2031. Instead, individual actions have been undertaken by ACT Government to increase patronage of sustainable transport options, including:
- raising parking costs in Civic and town centres;
- designing and initial rolling out of a new bus network;
- expanding park'n'ride facilities;
- identification of priority sections of cycle paths for capital works; and
- releasing the Strategic Public Transport Network Plan.
Available evidence suggests that despite these actions and relatively high operating costs, Canberra's public transport remains under-utilised, with current rates of usage per person barely half those of two decades ago. Current public transport policies have not yet been successful in returning usage of public transport to the levels of the late 1980s, when annual patronage was almost 50% higher than it is today, and 200% higher on a per capita basis.
Small improvements in the environmental performance of individual vehicles appear to have been seriously undercut by rapid growth in car and truck travel overall. Substantial improvements to the ACT's already-extensive road system have increased the attractiveness of travel by car, with more large projects underway and planned (ESDD 2011). Although parking costs have increased in Civic and town centres, the ACT Parking Strategy, which was released in draft form for public comment in 2007, has not been completed, and large commercial and employment centres continue to have free parking, increasing the incentive to travel by car. Free parking in the parliamentary triangle, although outside of the ACT Government's jurisdiction, remains particularly problematic, as recognised in previous ACT State of the Environment Reports.
Further, travel-to-work targets alone are not expected to reduce the environmental impact of the transport sector, with emissions from transport expected to increased by 50-60% above 1990 levels by 2020, even if these targets are achieved (see the Climate theme paper for further information). This suggests that hard questions need to be asked about the gap between the aspirations of both the ACT Government and the community for sustainable transport and on-ground outcomes.
Waste
The ACT No Waste by 2010 Waste Management Strategy was the guiding waste policy over the reporting period. Its successor, the Draft Sustainable Waste Strategy 2010-2025 (DECCEW 2010a), was open for public comment until the end of February 2011 and is currently being considered by the ACT Government for possible adoption by the end of 2011. The draft strategy focuses on managing organic and business/construction waste. Further, it incorporates targets of "over 80% resource recovery by 2015 and over 90% resource recovery by 2025" (DECCEW 2010a).
Initiatives put in place for waste management in the ACT over the reporting period have included:
- business and industry programs: ACTSmart Business, ACTSmart Office and ACTSmart Public Event programs, School Programs and community programs;
- methane gas capture, to produce electricity at landfill sites;
- Plastic Shopping Bags Ban Act (ACT) 2010 passed in December 2010, and commenced on 1 November 2011 (DECCEW 2010b);
- action on electronic waste (E-waste); in 2010 the ACT became the first jurisdiction to divert televisions and computers from landfill;
- waste harvesting and thermal conversion research, at the Fenner School of Environment and Society at the Australian National University; and
- in 2010, the ACT Government's pre-feasibility assessment of a thermal conversion facility for the ACT.
As in previous reporting periods, the largest component of the increase in waste to landfill is waste from construction, demolition, commercial and industrial enterprises. Despite recommendations in the 2007-08 State of the Environment Report, there has been little action to increase the diversion of organic materials from landfill. These two sectors require particular focus in the future.
The ACT has led the way nationally in the diversion of electronic waste to landfill. In 2010, the ACT became the first jurisdiction to divert televisions and computers from landfill. A National Television and Computer Product Stewardship Scheme is expected to commence at the end of 2011 (DSEWPaC 2011)
Despite extensive educational programs, provision of well-supported waste disposal and recycling facilities and the adoption of innovative technologies, waste generation, including both waste to landfill and resource recovery, has increased. Increasing rates of consumption challenge the aim of reducing waste in the ACT. To date there has been little focus on this aspect of waste management.
Other waste management challenges include enhancing data collection systems, extending waste recovery and recycling initiatives particularly in relation to green and food waste, and developing methods for carbon-neutral waste management. To develop and implement such strategies the ACT Government needs to work collaboratively with the community, businesses and government agencies.
Heritage
Initiatives developed by the ACT Government to protect heritage values and manage registered historic heritage places in the ACT include:
- free heritage and architectural guidance on renovating or extending a heritage building;
- guidelines for assessing development applications; and
- environmental impact assessment for heritage-listed places or objects subject to development proposals.
However, resourcing capacity limits ACT Heritage in its monitoring of compliance so there is little assessment of the effectiveness of these initiatives. In addition, many services are advisory in nature or enacted in response to development, rather than providing proactive and strategic direction to heritage protection and conservation. The Marshall Report (Marshall 2010) found that audit, compliance and enforcement are weak elements of the Heritage Act.
In February 2012 the Register of the National Estate becomes obsolete (DSEWPaC 2008). If nationally listed heritage places within the ACT are to be protected, they will need to be incorporated into the ACT Heritage Register. The Government has been in discussion with the National Capital Authority regarding this issue. A strategic approach needs to be taken to identify and protect heritage places and objects prior to development, rather than in response to it, which has largely been the case in the past.
Community engagement
Available data indicate that while many people are making changes to reduce resource use, action is less likely where a change involves a direct cost to individuals. This is evident in the low take-up rate of GreenPower and the increase in the ecological footprint as mentioned above. Reducing the impacts of individual consumption of resources is one of the key challenges in making the ACT more sustainable into the future.
Transport is another area in which a relatively low proportion of ACT residents is adopting sustainable practices. The Time to Talk community engagement project conducted in 2010 by the ACT Government found that ACT residents who responded are looking for transport options that are more sustainable than private vehicles; they are supportive of the development of bus shuttle services, transport corridors, light rail, and safe walking and cycling options (ACT Government 2010a).
Natural hazards
In the ACT, the Department of Territory and Municipal Services (TAMS), through its Parks, Conservation and Lands Branch, is responsible for managing 73% of the land area and for providing fire suppression capability through the Parks Rural Fire Brigade (ACT Government 2009b).
Over this reporting period considerable progress has been made in improving planning and systems for managing natural resources and mitigating potential hazards.
Nationally, in 2009, the Council of Australian Governments (COAG) adopted a "whole-of-nation resilience-based approach to disaster management, which recognises that a national, coordinated and cooperative effort is needed to enhance Australia's capacity to withstand and recover from emergencies and disasters" (COAG 2009:ii). This is reflected in the ACT Natural Resource Management (NRM) Plan, produced by the ACT NRM Council (ACTNRMC 2009). The Council is a partnership comprising representatives of ACT communities and the ACT and Australian governments.
As mentioned above, the Strategic Bushfire Management Plan for the ACT (ACT Government 2009b), prepared under the Emergencies Act 2004, provides the framework for fire management in the ACT. It integrates ecological needs and the safety of the community. The Plan defines guidelines for managing bushfire fuel, and for fire management zones and mapping.
The ACT Planning and Land Authority also has a plan for managing bushfire at the urban interface with bushland and in new urban growth areas. This plan aims to balance bushfire risk mitigation and the planning tradition of Canberra, in particular noting the large non-urban space in the ACT.
The 2006-07 ACT State of the Environment Report recommended determining the long-term land use of all forestry land burned in the 2003 bushfire where that use was not already defined (ACT 2008). Some of this land has been rezoned for water catchment, residential or recreation use; for example, the National Arboretum Canberra, and the new suburbs along the Molonglo River. The areas where land use is still undecided have been replanted with pine to retard erosion until the ACT Government determines the future of forestry and the land it occupies. At present there are no proposals to change the existing uses of land currently zoned for forestry (OCSE 2010).
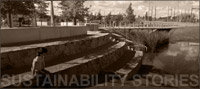
Strategies for managing urban flooding include detention basins and wetlands, located near recreational playing fields in new and some older suburbs, and a growing use of water sensitive urban design. Water sensitive urban design is intended to reduce the negative impacts of stormwater on waterbodies, and protect aquatic ecosystems through collecting, filtering and using stormwater close to where it falls as rain.
During the reporting period a number of wetlands were constructed in the urban area with the aim of providing a range of benefits including enhanced wildlife habitats, and with a particular focus on flood and stormwater protection and water quality improvements (see Water quality indicator cluster paper). New constructed wetlands are planned for Gungahlin in 2010-2012. It is too early to assess the wetlands' effectiveness in relation to flood protection. In 2010, an analysis rated the ACT's stormwater infrastructure at C+, an improvement from its C rating in 2005 (Engineers Australia 2010).
Emerging issues [top ]
Despite the many positive aspects contributing to Canberra's rating as a highly liveable city, the ACT is facing a number of future challenges. Further information on future scenarios and implications for sustainability can be found in the Driving Forces and Horizon Scanning papers.
The population of the ACT is predicted to rise to over 450,000 by 2030. Further, while the population of the ACT is currently younger than the national average, it is ageing more rapidly (Table 5). This demographic change is expected to be spread unevenly across the ACT. Populations in areas such as Tuggeranong, currently with a relatively young population, are projected to decline by 2016. Areas such as Woden Valley are projected to experience minor growth but a loss of people under 45 years of age (Jackson 2008).
Table 5. Comparison of ACT population projections for 2011 and 2030
| Year | Male | Female | Total persons | Aged 0-14 years | Aged 15-64 years | Aged 65+ years | Median age (years) |
|---|---|---|---|---|---|---|---|
| 2011 | 181,133 | 182,631 | 363,764 | 18.3% | 71.0% | 10.7% | 33.9 |
| 2030 | 229,410 | 223,933 | 453,343 | 18.0% | 65.3% | 16.7% | 37.5 |
Source: ACT Government 2010e
With this population growth and demographic changes, there will be increased demand for housing, government and other services. More flexible options in housing various forms will be needed to suit the diverse needs of young families, Canberra's large student population, older people and the growing number of one-person households. Greater numbers of apartment blocks are being built in Civic and the town centres, but a gap remains in the supply of intermediate-level smaller free-standing dwellings and town-house developments. With the increasing costs of land development and housing, the challenge to provide affordable housing in close proximity to employment, shops, medical, recreational and other community facilities will continue.
In addition, alternatives to private vehicles to link people to retail, employment, recreational and other services will be essential for promoting a sustainable and liveable Canberra of the future. Such changes will require collaborative strategic planning that brings together knowledge and expertise across a wide range of public, private and community sectors to address the social, environmental and economic challenges these changes will bring. Few forums currently exist for this kind of ongoing collaboration across sectors.
The ageing of the population also has implications for employment. There will be fewer people at labour-market entry age (15-64 years) relative to those at or approaching retirement. Against this background, it is of concern that ACT Government budget projections include only modest (2%) increases in spending on transport, recreational facilities, housing and community amenities and social and welfare services, although spending on health is understandably projected to increase by 4% by 2050 (ACT Government 2010d).
Population growth will also increase rates of consumption of products and services, which are closely related to Canberra's large and growing ecological footprint and associated levels of waste generation. While recycling appears to be largely embedded in Canberrans' behaviour, reducing consumption and waste generation is increasingly important if waste to landfill and demand for recycling services are to be contained.
Populations in the nearby NSW local government areas of Cooma-Monaro, Palerang, Queanbeyan, Yass Valley and Goulburn-Mulwaree are also projected to increase from a total of 465 700 persons in 2011 to 577 900 in 2031 (ACT Government 2010c). One aspect of that growth will be the numbers of people travelling into Canberra from these regional centres for work and to access various services. In 2010, 25 000-30 000 people travelled from interstate to Canberra each day to work. More than 75% of these workers live in the commuter belt that includes Queanbeyan and the semi-rural areas surrounding Canberra (RDA ACT 2010). With the expectation that commuting numbers will continue to trend upwards, the demand for transport and other infrastructure can also be expected to increase.
The need to reduce greenhouse gases by encouraging less reliance on motor vehicles will become even more important into the future. Rising fuel prices could stimulate development of a more environmentally sustainable city - one where efficient and economically attractive alternative transport options are integrated with the private motor vehicle. However, such price rises will place additional burdens on the more vulnerable sections of the community. Creative thinking is needed, to find ways of connecting appropriate and affordable public transport options with non-work travel as well as employment-related travel. Cities such as Copenhagen have demonstrated the effectiveness of increasing investment in cycling and walking infrastructure (Infrastructure Australia 2009). The key to the success of these international "best practice" cities has been the development of specific measureable policies, cross-integration of relevant government agencies, and major investments into infrastructure and education (Infrastructure Australia 2009:2).
The capacity of a community to respond to the impacts of extreme weather events depends on its resilience. Although historically the ACT has suffered relatively few natural disasters, climate change is predicted to result in more frequent and intense bushfires, heatwaves and storms. These are likely to bring greater risk to community safety and the security of infrastructure. Potential impacts need to be factored into planning for urban development, green infrastructure management, provision of emergency and healthcare services. Community education programs to build awareness, capacity and resilience will also be needed.
Regional planning initiatives need continued and increased support. ACT border does not delineate potential vulnerabilities which are likely to be increased by the predicted climate change. These, and other cross-border issues, can be addressed effectively by close liaison, cooperation and strategic planning between the ACT Government and the planners and decision-makers in surrounding regional jurisdictions as well as the NSW and Commonwealth Governments. Extended use of electronic and other media to inform, educate and build cooperative, supportive and resilient communities that are able to deal with such events will become increasingly important.
A key determinant of Canberra developing as a sustainable city will be the capacity of the people to work cooperatively with one another and to build greater resilience to be able to respond to future changes and challenges. With its highly educated and well-resourced population, numerous teaching and research institutions and active environmental groups, the ACT is well placed for this kind of collaboration to occur across the community.
Recommendations [top ]
-
Finalise and implement the draft ACT Planning Strategy to provide an integrated approach to future landscape planning. Particular attention should be paid to:
- determining indicators and measures for urban quality in the ACT that includes the benefits provided by green infrastructure and access to open space; and
- developing greenfield and infill targets, which take into account both the need for public open space and the passive benefits of green infrastructure, as well as strengthening a sense of community and self containment.
- Develop adaptable housing strategies to address the needs of changing population demographics into the future.
-
Finalise and implement the draft Sustainable Transport Action Plan to provide an integrated approach to transport and urban planning. In doing so:
- obtain additional non-work related travel data, similar to the annual Sydney Household Travel Survey, to ensure a more complete understanding of Canberra's transport habits;
- focus on strategies and targets to improve access to sustainable forms of transport outside of transport corridors;
-
develop targets for:
- reducing greenhouse gas emssions from transport;
- increase sustainable transport usage for non-work travel to complement the exisiting targets for work travel;
- track progress towards Sustainable Transport targets on an annual basis.
-
Finalise and implement a new ACT Waste Management Strategy with a focus on reducing waste generation; in particular:
- examine and implement options for diverting wastes from landfill to higher order beneficial reuse opportunities. These actions should be measured, recorded and reported publicly.
- focusing community education on the link between consumption and waste; and
- targeting specific programs to reduce waste from the construction and demolition, and commercial and industrial sectors.
-
Strengthen heritage protection in the ACT by:
- developing an action plan for heritage which addresses the backlog of heritage nominations and recognises key future places for protection.
- strengthening audit, compliance and enforcement processes in line with recommendations of the Marshall report
- developing a memorandum of understanding with the Australian Government to protect assets, subject to Australian Government planning approvals, on the ACT Heritage Register;
- Promote ACT heritage values as a part of the Canberra 2013 Centenary celebrations.
- Align and integrate climate adaptation planning and disaster risk management where appropriate. This should include lessons learned from changes to fire management.
- In collaboration with NSW Government and local councils, develop a regional approach to planning and risk management to address future challenges of population and climate change.
-
Strengthen community engagement in sustainability by:
- Undertaking research on attitudes to sustainability and consumption patterns and behaviours. This could be done through regular, comparable, community surveys similar to the annual NSW ‘Who cares about the environment?’ with the outcomes informing focus areas for community engagement.
-
Fostering behavioural change through community engagement to reduce our ecological footprint with a particular focus on:
- sustainable transport; and
- impacts of consumption
Footnote [top ]
1. The 1967 Y-Plan was the key strategic plan for Canberra until the 2004 ACTPLA Spatial Plan. The Y-Plan provided for Canberra to grow through the creation of separate districts in the form of a "Y"
References [top ]
ABS 2008a. Canberra: A Social Atlas, 2006 Census of Population and Housing. Cat.No. 2030.8 - Australian Bureau of Statistics. Australian Government. Canberra. http://www.abs.gov.au/AUSSTATS/subscriber.nsf/log?openagent&20308_2006.pdf&2030.8&Publication&F084CC2518A2F7C3CA25740E0079DE65&&2006&17.03.2008&Latest (accessed 21/7/11)
ABS 2008b. Multi-Purpose Household Survey: Environmental Views and Behaviour Study. Cat. No. 4626.0.55.001. Australian Bureau of Statistics. Australian Government. Canberra. http://www.abs.gov.au/AUSSTATS/abs@.nsf/Lookup/4626.0.55.001Explanatory%20Notes12007-08%20(2nd%20issue)?OpenDocument (accessed 25/8/11)
ABS 2010a. Australian Social Trends - December 2010. Cat. No. 4102.0. Australian Bureau of Statistics. Australian Government. Canberra. http://www.abs.gov.au/ausstats/SUBSCRIBER.NSF/log?openagent&41020_housing_indicators_2010.xls&4102.0&Data%20Cubes&6F6EA92192980447CA2577F80010DCA0&0&Dec%202010&14.12.2010 (accessed 7/11/11)
ABS 2010b. Environmental Awareness and Action. Cat No. 4102.0. Australian Bureau of Statistics. Australian Goverment. Canberra. http://www.ausstats.abs.gov.au/Ausstats/subscriber.nsf/0/3FC4355B8BA3308BCA2577510019F919/$File/41020_environmentalawareness.pdf (accessed 26/8/11)
ACT Government 2004a. The Sustainable Transport Plan for the ACT. Canberra. http://www.tams.act.gov.au/__data/assets/pdf_file/0010/167941/Sustainable_Transplan_Plan.pdf (accessed 5/6/11)
ACT Government 2004b. Think Water, Act Water. Canberra. http://www.thinkwater.act.gov.au/more_information/publications.shtml#strategy (accessed 11/4/11)
ACT Government 2009. Strategic Bushfire Management Plan for the ACT. Version 2. Canberra. http://www.esa.act.gov.au/ESAWebsite/content_esa/bushfires/before_a_bushfire/act_sbmp/sbmp_downloads/act_sbmp_plan_text_web.pdf (accessed 14/1/11)
ACT Government 2010a. Time To Talk: Canberra 2030 Outcomes Report. Canberra. http://timetotalk.act.gov.au/storage/78d10e40d957379825347909b6e2bfd9.Time%20to%20talk%20-%20web%20version.pdf (accessed 26/8/11)
ACT Government 2010b. Time to Talk: Canberra 2030 - Getting Around. Canberra. http://timetotalk.act.gov.au/files/download/?id=158 (accessed 21/11/11)
ACT Government 2010c. Time to Talk: Canberra 2030 - Population. Canberra. http://timetotalk.act.gov.au/storage/bf77c700a50698a0a623f9ab9c7d2310.31-08%20Population.pdf (accessed 9/8/11)
ACT Government 2010d. Population Ageing in the ACT: Issues and Analysis. Canberra. http://www.cmd.act.gov.au/__data/assets/pdf_file/0008/154475/population-ageing-ACT.pdf (accessed 18/9/11)
ACT Government 2010e. ACT Population Projections: 2009 to 2059. Canberra. http://www.cmd.act.gov.au/policystrategic/actstats/projections/act (accessed 25/8/11)
ACT Government 2011. Draft ACT Planning Strategy - Planning for a Sustainable City. Canberra. http://timetotalk.act.gov.au/storage/1222_PLANNING_STRATEGY_TAGGED_PDF_FINAL.pdf (accessed 17/11/11)
ACTPLA 2004. Canberra Spatial Plan. ACT Planning and Land Authority. Canberra. http://apps.actpla.act.gov.au/spatialplan/index.html (accessed 17/11/11)
ACTPLA 2007. Canberra At the 2006 Census: Population and Housing. ACT Planning and Land Authority. ACT Government. Canberra. http://www.actpla.act.gov.au/__data/assets/pdf_file/0007/7675/Canberra_at_2006_Census.pdf (accessed 15/8/11)
ACTPLA 2008. Territory Plan - Part B9. ACT Planning and Land Authority. ACT Government. Canberra. http://apps.actpla.act.gov.au/tplan/index.htm (accessed 5/7/11)
ACTPLA 2011. Population and Residential Density in Canberra. ACT Planning and Land Authority. ACT Government. Canberra. http://www.actpla.act.gov.au/__data/assets/pdf_file/0005/23648/Population_Density_2011.pdf (accessed 18/11/11)
COAG 2009. National Strategy for Disaster Resilience: Building Our Nation's Resilience to Disasters. Council of Australian Governments. Canberra. http://www.coag.gov.au/coag_meeting_outcomes/2011-02-13/docs/national_strategy_disaster_resilience.pdf (accessed 23/8/11)
Commonwealth of Australia 2011 Australian Capital Territory Implementation Plan - 2011-2012. National Partnership Agreement on Disaster Resilience. http://www.federalfinancialrelations.gov.au/content/national_partnership_agreements/environment/natural_disaster_resilience/ACT_11-12_2.pdf (accessed 18/9/11)
CommSec 2009. Australian Homes Are Biggest In the World 30 November. Economic Insights. http://images.comsec.com.au/ipo/UploadedImages/craigjames3f6189175551497fada1a4769f74d09c.pdf (accessed 9/11/11)
DECCEW 2010a. Draft Sustainable Waste Strategy 2010-2025. Department of the Environment, Climate Change, Energy and Water. ACT Government. Canberra. http://www.environment.act.gov.au/__data/assets/pdf_file/0009/210501/SustainableWaste_Strategy_WEB.pdf (accessed 18/9/11)
DECCEW 2010b. Media Release -Plastic Bag Ban Passed by Assembly. Department of Environment, Climate Change, Energy and Water. ACT Government. Canberra. http://www.environment.act.gov.au/__data/assets/pdf_file/0006/214296/MIN_187_1210_Plastic_bag_ban_passed_by_Assembly.pdf (accessed 27/5/11)
DECCEW 2010c. Executive Summary: An Evaluation Report of the Australian Sustainable Schools Initiative ACT 2010. June/July 2010. Department of the Environment, Climate Change, Energy and Water. ACT Government. Canberra. http://www.sustainableschools.act.gov.au/__data/assets/pdf_file/0005/222809/Attachment_4_-_Evaluation.pdf (accessed 25/8/11)
Dey, C. 2010. The 2008-09 Ecological Footprint of the Population of the ACT. Integrated Sustainability Analysis Research Group. The University of Sydney. Sydney. http://www.environmentcommissioner.act.gov.au/__data/assets/pdf_file/0015/211182/ACT_Ecological_Footprint_08-09_final_report.pdf (accessed 17/11/11)
DSEWPaC 2008. Register of the National Estate. Department of Sustainability, Environment, Water, Population and Communities. Australian Government. Canberra. http://www.environment.gov.au/heritage/places/rne/index.html (accessed 17/9/11)
DSEWPaC 2011. National Television and Computer Product Stewardship Scheme. National Waste Policy Fact Sheet. Department of Sustainability Environment, Water, Population and Communities
Engineers Australia 2010. Infrastructure Report 2010: Water. Canberra. http://www.engineersaustralia.org.au/shadomx/apps/fms/fmsdownload.cfm?file_uuid=C8F26346-DB84-45EF-E104-B53E726D4A61&siteName=ieaust (accessed 18/4/2011)
ESDD 2011. Transport for Canberra 2011-2031- Draft for Public Comment. Environment and Sustainable Development Directorate. ACT Government. Canberra. http://www.timetotalk.act.gov.au/storage/Transport%20Policy%2014%20October%20Full.pdf (accessed 10/11/11)
Heuris Partners 2010. ACT Greenhouse Gas Emissions: Existing Policy Baseline Projections To 2050 - Research Report. Heuris Partners. Canberra. http://www.environment.act.gov.au/__data/assets/pdf_file/0008/187217/ACT_Greenhouse_Gas_Emissions.pdf#ACT%20Greenhouse%20Gas%20Emissions (accessed 7/11/11)
ICRC 2011. ACT Greenhouse Gas Inventory Report for 2008-09. Independent Competition and Regulatory Commission. Canberra. http://www.icrc.act.gov.au/__data/assets/pdf_file/0009/235719/ACT_Greenhouse_Gas_Inventory_Report_2009_Final.pdf (accessed 11/10/11)Intergovernmental Panel on Climate Change (IPCC). 2001. IPCC Third Assessment Report (IPCC, 2001 a,b,c): Annex B Glossary of Terms, http://www.ipcc.ch/pdf/glossary/tar-ipcc-terms-en.pdf (accessed 19/6/11)
Infrastructure Australia 2009. Cycling Infrastructure for Australian Cities. Major Cities Unit. Australian Government. Canberra. http://www.infrastructureaustralia.gov.au/publications/files/Cycling_Infrastructure_Background_Paper_16Mar09_WEB.pdf (accessed 17/11/11)
Jackson. N. 2008. Population Change and Sustainable Futures: Imagining the ACT. Paper commissioned by the ACT Government. Canberra. http://www.actpla.act.gov.au/__data/assets/pdf_file/0011/12431/Paper_-_Natalie_Jackson.pdf (accessed 12/10/11)
Maddew.R. 2011. Could Canberra be Australia's Greenest City? Australian Broadcasting Corporation. Canberra. http://www.abc.net.au/environment/articles/2011/03/31/3178495.htm (accessed 20/9/11)
Marshall, D. 2010. ACT Heritage Act Review. ACT Heritage. ACT Government. Canberra. http://www.cmd.act.gov.au/__data/assets/pdf_file/0019/154315/reduced_ACT_Heritage_Act_Review_4Aug10.pdf (accessed 3/5/11)
Mees, P., Sorupia, E. and Stone, J. 2007. Travel to Work in Australian Capital Cities 1976-2006: An Analysis of Census Data. Australasian Centre for the Governance and Management of Urban Transport. University of Melbourne. Melbourne. http://www.abp.unimelb.edu.au/gamut/pdf/travel-to-work.pdf (accessed 17/11/11)
OCSE 2010. Annual Report 2009-10. Office of the Commissioner for Sustainability and the Environment. Canberra. http://www.environmentcommissioner.act.gov.au/__data/assets/pdf_file/0015/205125/OCSE_annual_report_2009-10_final.pdf (accessed 28/08/2011)
OCSE 2011a. Report on the Investigation into the Government's Tree Management Practices and the Renewal of Canberra's Urban Forest. Office of the Commissioner of Sustainability and the Environment. ACT Government. Canberra. http://www.environmentcommissioner.act.gov.au/__data/assets/pdf_file/0006/219354/OCSE_TreeInvestigation_Part1_ReportV5_28February2011.pdf (accessed 17/11/11)
OCSE 2011b. Report on Canberra Nature Park (Nature Reserves); Molonglo River Corridor (Nature Reserves) and Googong Foreshores Investigation. Office of the Commissioner for Sustainability and the Environment. Canberra. http://www.envcomm.act.gov.au/investigations/nature_reserves_investigation (accessed 23/8/11)
PCL 2009. Facts at a Glance 2009. Parks, Conservation and Lands. ACT Government. Canberra. http://www.tams.act.gov.au/__data/assets/pdf_file/0020/166061/PCLFacts_2009web.pdf (accessed 18/8/11)
RDA ACT 2010. ACT Strategic Regional Plan 2010. Regional Development Australia ACT. Canberra. http://rdaact.org.au/wp-content/uploads/2011/03/RDA_ACT_regional_plan_20102.pdf (accessed 18/8/11)
TAMS 2011. Annual Report 2010-2011. Territory and Municipal Services. ACT Government. Canberra. http://www.tams.act.gov.au/__data/assets/pdf_file/0007/233179/Volume_1_10-11.pdf (accessed 21/10/11)
Webb, B. 2011. Impacts of Climate on the Canberra Nature Park: Risks and Responses. Report for the ACT Office of the Commissioner for Sustainability and the Environment. Canberra. http://www.envcomm.act.gov.au/__data/assets/pdf_file/0004/220477/OCSE_ANU_paper_climate_CNP.pdf (accessed 1/12/11)
Other data sources
In addition to these published reports, data for this paper were also sourced from:
- ACT Department of Land and Property Services (LAPS) -now part of the Economic Development Directorate (EDD)
- ACT Department of Territory and Municipal Services - now Territory and Municipal Services Directorate (TAMSD)
- ACT Heritage - formerly part of Chief Minister's Department, now part of the Environment and Sustainable Development Directorate (ESDD)


Share this page: