


ACT State of the Environment Report 2011
Accurate, timely & accessible information for the community regarding the condition of the environment, underlying pressures, and sustainability trends.
THEME: Land and Water
Indicator cluster: Water supply
This indicator cluster focuses on the supply and use of potable water for ACT, and related impacts such as on environmental assets. The indicators for this cluster are:
- Dam storage (C) - Drinking water storage levels;
- Dam water quality (C) - Dam water-quality prior to treatment;
- Drinking water quality (C) - Treated drinking water quality;
- Water use (P) - Water use by sector;
- Environmental flows (I) - Including volume, quality, nature, regime, timing and effects of dam releases;
- New water supplies (R) - New sources of water supply;
- Water demand management (R) - Effectiveness of water demand-management; and
- Environmental flow management (R) - Effectiveness of implementation of environmental flow guidelines.
Condition indicators (C) present data that tell us the state of the environment at any particular time.
Pressure indicators (P) present data about the main human activities that could potentially adversely affect the condition of the environment.
Impact indicators (I) present data on the effect that environmental changes have on environmental or human health.
Response indicators (R) present data about the main things we are doing to alleviate pressures, or to improve the condition of the environment.
Summary [top  ]
]
The ACT relies on a range of water-supply sources including dams, rivers, groundwater, rainwater tanks, stormwater harvesting, and recycled water.
During the reporting period, like much of south-eastern Australia, the ACT continued to experience severe drought until 2010-11 when there was significant rainfall. Since 2007-08, water storage levels have increased from less than 40% to 100% capacity. Above average rainfall between June and December 2010 led to significant inflows into the storages, making them more than 80% full for the first time since 2000. The water quality from these storages was good in each year of the reporting period, meeting the standards in the Australian Drinking Water Guidelines.
In response to the drought and the consequent reduced inflows into the ACT's water-supply storages, the ACT Government endorsed water restrictions and a number of water conservation measures, and developed new water-supply augmentation projects. There was also a continued focus on water-demand management.
Introduction [top ]
The Water supply indicator cluster for the reporting period includes 8 indicators that collectively report on water supply, water use, drinking water quality, environmental flows and demand management. While the indicator cluster focuses on 2007-11, it needs to be considered in the context of the decade-long drought in eastern Australia, which ended in 2010 (BoM 2011). As with many cities and regions, the ACT is taking an integrated approach to water supply and demand management, with further investment in both traditional and alternative water supply sources.
Condition indicators [top ]
Dam storage
The ACT draws water from 3 separate catchments (Figure 1) and associated infrastructure:
- the Cotter River catchment and its 3 reservoirs: the Cotter, the Bendora and the Corin;
- the Queanbeyan River catchment, which supplies the water held by Googong Dam in NSW; and
- the Murrumbidgee River catchment, via Cotter Pump Station rather than a reservoir.
The 4 reservoirs have a combined storage capacity of 207 GL (ACTEW 2011a).
Figure 1. Water supply network and dam catchments that provide water to the ACT
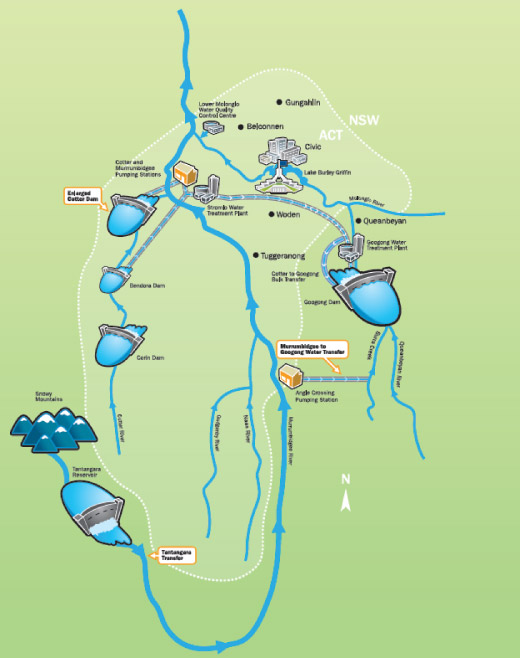
Source: map courtesy of ACTEW Corporation
Note: map includes approved infrastructure still under construction
Since 2007-08, water storage levels have increased from less than 40% to 100% capacity (Figure 2). Above average rainfall between June and December 2010 (Figure 3) led to significant inflows into the storages, making them more than 80% full for the first time since 2000. Between October and December in 2010, the Cotter Reservoir overflowed on 6 different occasions for a total of 36 days.
Figure 2: Water storage levels between January 2007 and March 2011
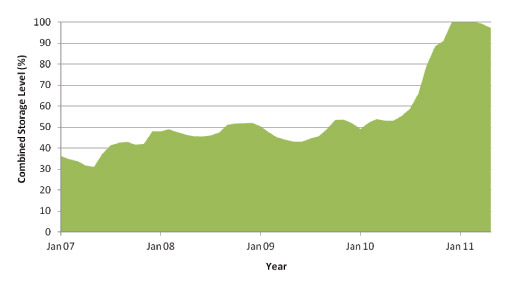
Source: ACTEW 2011a
Figure 3. Trends in rainfall at Canberra Airport 2008-2010
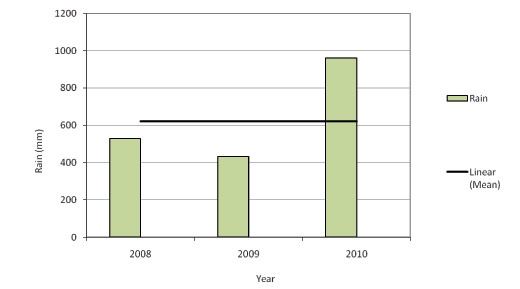
Source: Davis and Lindesay 2011
Between 2007 and 2009, water storage levels for the ACT were kept low by inflows that were much smaller than the historical average. Table 1 shows that an annual average of 70 GL of water flowed into the storages during 2005-2010, compared to an annual average since records began of 228 GL (ACTEW 2011a).
Climate-change predictions of increased air temperatures and reduced rainfall and runoff in the region are likely to challenge future water supply for the ACT. Based on advice from CSIRO, ACTEW is using inflow reductions of 50% of long-term average in its water-planning scenario modelling (ACTEW 2011b). The Water Security for the ACT and Region report (ACTEW 2007) estimated average annual inflows of approximately 105 GL to the 3 main dams. This estimate is significantly lower than the average annual inflows estimated by CSIRO research in 2005 (132 GL per year) and the historical average annual inflows (Table 1).
For more information see the Climate vulnerability indicator cluster.
Table 1. Average water inflows into water storages prior to June 2010
| Reservoir |
Average annual inflow, ML (1928-2009) |
Average annual inflow, ML (2000-2010)1 |
Average annual inflow, ML (2005-2010)1 |
|---|---|---|---|
| Corin | 59 | 37 | 29 |
| Bendora | 38 | 18 | 14 |
| Cotter | 39 | 17 | 12 |
| Googong | 92 | 16 | 16 |
| All reservoirs | 228 | 88 | 70 |
Source: ACTEW 2011a
Notes: 1 - Average inflow into water storages calculated at June 2010. Inflows have since increased with significant rainfall.
Dam water-quality
Dam water-quality before treatment is strongly dependent on the quality of the surface waters that flow into the storages.
ActewAGL, which operates the ACT water-supply infrastructure, has an extensive program of monitoring the reservoir water quality for microorganisms, blue-green algae and pesticides. Overall, the water quality within the reservoirs over the reporting period was good (ActewAGL 2010a). This is an improvement on the previous reporting period, when dam water quality was affected by sediment and debris from the 2003 bushfires. However, concentrations of blue-green algae were higher in the Googong Reservoir over the current reporting period. As a result, additional activated carbon treatment was applied to the water to remove potential toxins, odour and taste. The untreated water quality in the Cotter River catchment is generally better because of the protection of the catchment from human-based land uses (ActewAGL 2010a). Further information on the health risks posed by blue-green algae is presented in the Water quality indicator cluster.
Water from the Upper Murrumbidgee River, while not in a reservoir, is now an important part of the overall ACT water supply network. The water is directly used for drinking by the populations of Cooma-Monaro, ACT and Queanbeyan. Water quality in the Upper Murrumbidgee River varies considerably, mostly because of sediment inflows and the resulting turbidity. Lower treatment costs and better quality drinking water should result if the turbidity can be reduced or prevented.
Drinking water quality
Water is treated at 2 water treatment plants before it is supplied for use in the ACT:
- the Mount Stromlo Water Treatment Plant treats water from the Cotter River reservoirs and the Murrumbidgee River; and
- the Googong Water Treatment Plant treats water from Googong Reservoir on the Queanbeyan River.
Both of these water treatment plants are able to treat enough water to supply the daily average summer demand for Canberra and Queanbeyan. This is necessary to ensure that water can continue to be provided to the ACT if either reservoir has significant water quality issues, such as blue-green algal blooms or sediment and turbidity from bushfires or erosion. Over the reporting period, the Mount Stromlo Water Treatment Plant supplied most of the water customers in ACT.
Water quality is monitored at the water treatment plants to ensure the drinking water meets the ACT Drinking Water Code of Practice 2007, which refers to the Australian Drinking Water Guidelines (NHMRC 2004), and is suitable for human consumption. In the Code of Practice, the concentration for each water quality characteristic is set to a level that does not pose a significant risk to human health from consumption of water.
Annex 1 outlines the monitoring results for quality of ACT drinking water during 2007-08 to 2009-10 (Tables A1-A3). The drinking water quality was good in each year of the reporting period. Drinking water quality was consistent across the parameters and met the standards in the Australian Drinking Water Guidelines. The pH varied between 6.2 and 9.2, but on average it was within the limits (6.5 to 8.5) in approximately 97% of samples.
The percentage of water samples with exceedances in total coliform bacteria was highest in 2007-08, when 1.6% did not meet the standard set in the Guidelines. However, none of the bacteria was identified as faecal coliform. In only one sample in 2008-09 were faecal coliforms detected (Annex 1, Tables A1, A2, A3). For more information on faecal coliform bacteria, see the Water quality indicator cluster.
Over the reporting period, there was an average of one complaint per 1000 properties each year regarding drinking water quality (ActewAGL 2010a), equivalent to approximately 137 complaints per year. The complaints have decreased significantly from the previous reporting period (for example, there were 792 complaints in 2005-06), when drinking water quality was extensively affected by debris in the storage dams following the 2003 bushfire.
Pressure indicators [top ]
Water use
As reported in the previous ACT State of the Environment Report, use of potable water in the ACT was severely affected by drought until 2010. The total potable water use decreased by approximately 11 GL between 2005-06 and 2009-10 (Figure 4). The lower water use was probably a result of water restrictions and permanent water conservation measures in ACT. The National Water Commission has observed (NWC 2011) a national decline in water use as a result of a number of factors, such as water restrictions, community education campaigns and an enduring community commitment to efficient water use.
With increased rainfall and removal of water restrictions in ACT, it will be interesting to see if water use increases again.
Figure 4. Total potable water use within the ACT
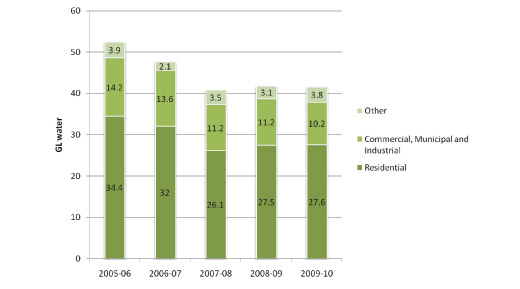
Source: based on data from ActewAGL 2008a, 2009a and 2010a, and Annex 1 Table A4
Notes: 1 - 'Other' includes the volume of water supplied to miscellaneous uses, including losses from the distribution network.
Most of the potable water in the ACT is used by households (58%) and industry (23%). Household and commercial water use during the drought decreased from an average of 240 kL/year in 2006-07 to 199 kL/year on average in 2009-10 (Table A4, Annex 1 ). This represents a 17% decrease in household consumption in 4 years. Overall, this reduction in household water use was greater than the national average reduction in residential water use (228 kL/year in 2003-04 to 192 kL/year in 2009-10; NWC 2011). Table 2 compares the average water consumption recorded in major cities around Australia during 2005-2010.
Table 2. Average residential water supplied (kL/property) to major cities by water supply companies
| 2005-06 | 2006-07 | 2007-08 | 2008-09 | 2009-10 | |
|---|---|---|---|---|---|
| Canberra (ACTEW) | 261 | 240 | 195 | 201 | 199 |
| Sydney (Sydney Water) | 203 | 199 | 182 | 198 | 205 |
| Perth (Water Corporation) | 268 | 281 | 268 | 277 | 276 |
| Adelaide (SA Water) | 233 | 235 | 195 | 190 | 191 |
| Melbourne (Yarra Valley Water) | 198 | 178 | 157 | 151 | 144 |
| Brisbane (SEQ Water) | 185 | 153 | 128 | 133 | 143 |
Source: NWC 2011
In the ACT, groundwater is also used as a water resource for rural communities and agriculture. For further information about groundwater, refer to the Groundwater indicator cluster.
Impact indicators [top ]
Environmental flows
Environmental flows are the flows of water in streams and rivers that are necessary to maintain the health and functions of aquatic ecosystems. Environmental flows are designed to mimic natural river flows. Unnatural flow patterns, especially over long periods of time, have the potential to adversely affect aquatic biodiversity and riparian vegetation. Flow regimes in working rivers have changed to suit human needs and agriculture based on introduced crops, often to the detriment of indigenous riverine flora and fauna adapted to the local conditions. In heavily used river systems such as in water supply catchments, environmental flows can be delivered in ways that protect specific components of the flow regime, to help keep stream ecosystems healthy (ACT Government 2006).
The ACT Environmental Flow Guidelines (ACT Government 2006) protect particular components of natural streamflow:
- baseflow;
- small floods (riffle maintenance flows);
- larger floods (pool or channel maintenance flows); and
- special purpose flows.
The baseflow is the flow component that a stream needs to support fish, plants and insects, and sustain water quality. In upland areas such as the ACT, it is contributed mostly by groundwater. The volumes of baseflow have been determined for each month for each stretch of stream or river in the ACT (ACT Government 2006).
Environmental flows in the ACT are provided through releases and spills from the reservoirs on dammed rivers, and on other rivers they are provided through restrictions on the amount of water that can be withdrawn. The total volume of water available for abstraction and use is limited by the ACT compliance to the Murray-Darling Basin Cap, and by the volume of water remaining after environmental flow volumes have been provided (ACT Government 2006).
Environmental flows required to be released from water storages in the ACT varied significantly over the reporting period. ACTEW has a Licence to Take Water (ActewAGL 2008b, 2009b, 2010b) that specifies the minimum volumes and timing of flows required to be released by each dam. The volume and timing of releases change with water supply levels (environmental flows can be larger when there are no water restrictions; smaller, more managed volumes were released during the different stages of water restrictions). The environmental flows downstream of each dam differ to reflect the varied aquatic values of downstream reaches of river. For example, the reach downstream of Bendora Dam is of a higher ecological value than the reach downstream of the Cotter Dam.
The total volume of water released from dams as environmental flows decreased from 131 GL in 2005-06 to 29 GL in 2007-08 as a result of the drought (Table 3). However, water released for environmental flows in 2010-11 has increased significantly because of the spills caused by flood flows in December 2010, and a rapid increase in water stored within the water supply system.
Table 3. Environmental flow volumes downstream of water supply dams
| 2005-06 | 2006-07 | 2007-08 | 2008-09 | 2009-10 | 2010-11 | |
|---|---|---|---|---|---|---|
| Releases and spills (ML) | 131,226 | 63,287 | 29,451 | 32,473 | 42,432 | 543,570 |
| Minimum required environmental flows (ML) | 23,859 | 24,383 | 22,505 | 20,794 | 22,572 | 49,260 |
Source: ActewAGL 2008a, 2009a, 2010a
Note: the volumes are the sums of volumes of water relating to the 4 water supply dams only (Corin, Bendora, Cotter and Googong) and are only the volumes leaving the water supply catchments, not the total of all the environmental flows in the ACT
Over the reporting period, monitoring data for water-supply catchments indicated that most reaches were in an impaired condition. For a short time, during extreme water scarcity, the reach downstream of the Cotter Dam was in a poor condition before improving to an impaired condition once flows returned to a higher level. ACTEW has complied with all the environmental flow conditions of its licence to take water. An adaptive management approach that balances ecological needs with human consumption needs has aimed to meet the critical needs of aquatic and riparian ecosystems during severe drought.
Response indicators [top ]
Policy framework
The ACT is within the Murray-Darling Basin and is subject to a limit, or 'cap', on the amount of surface water that can be taken (diverted) for consumption. The current cap on surface-water diversions across most of the Basin was set at a level based on the 1993-94 level of use and development. It may no longer be a sustainable level across the Basin as a whole. In addition, the existing cap does not limit the use of groundwater, which has been increasing across the Basin. The ACT has met its required cap to date.
Through a new Basin Plan the Murray-Darling Basin Authority (MDBA) is establishing new sustainable diversion limits on both surface and groundwater extractions in the Basin, with the aim of better reflecting more sustainable use. The new Basin Plan will also identify risks to Basin water resources, such as from climate change, and it will propose strategies to manage those risks. Examples may include a water quality and salinity management plan, and requirements that State water-resource plans will need to comply with if they are to be accredited under the Water Act 2007 (MDBA 2011).
In 2004, the ACT Government released its water resource strategy Think water, act water - a strategy for sustainable water resource management (ACT Government 2004). The strategy provides a framework for water resource management including security of supply, efficient use and management. A review of the Think water, act water strategy is currently underway. Measures implemented under the strategy are discussed below.
Water policy in the ACT is also guided by requirements set out in the national reforms embodied in the Intergovernmental Agreement on a National Water Initiative, of June 2004, and the Council of Australian Governments (COAG) water reform program of 2008.
Water security
The ACT has been investigating and developing new water supplies in response to increased climate variability, drought, increasing population and water demand. A number of water supply improvements have been implemented. The 3 major projects initiated during the reporting period are (ACTEW 2011c, ICRC 2011):
- Enlarged Cotter Dam - in October 2007, the ACT Government announced an expansion of the Cotter Reservoir from 4 GL to 78 GL to provide additional storage capacity;
- Murrumbidgee to Googong Water Transfer - this project includes pumping water from the Murrumbidgee River, near Angle Crossing south of Canberra, to Googong Reservoir to supplement the ACT water supply (ACTEW 2011c);
- Tantangara Transfer - ACTEW has purchased 4145 ML of high security water licences and 12,523 ML of general security water entitlements for the Tantangara Transfer project.
Reuse of water is another way of lessening the demand for fresh potable water, reducing the use of the ACT's stored water supplies and therefore potentially increasing the amount of water available for the environment. ActewAGL has operated 3 wastewater reuse projects in the ACT during the current reporting period (ActewAGL 2011):
- 195 ML/year of treated wastewater is reused from the LMWQCC and supplied for irrigating 100 hectares of nearby vineyards and 30 hectares of a golf course.
- Southwell Park Watermining Project, which supplied treated effluent for 10 hectares of sporting fields, but was decommissioned in 2011 because of high maintenance costs; and
- North Canberra Water Reuse Scheme, which supplies irrigation water to 7 sites totalling 70 hectares.
Other key water supply projects during the reporting period include (ICRC 2011):
- sourcing more than 15 GL of water from the Murrumbidgee River, which can account for up to 33% of water supplied to the ACT and Queanbeyan;
- upgrades to the north Canberra recycled water treatment facility - its capacity was increased to allow for a greater supply of recycled water to north Canberra;
- provision of recycled water from Lower Molonglo Water Quality Control Centre - via a new pump, pipeline and filling station, installed to access to recycled water from the treatment plant;
- district and large-customer metering - ACTEW continued to monitor and reduce water leakage from large customers, reducing leakage by 450 ML in 2008-09; and
- Canberra Integrated Urban Waterways project - which focuses on integrating stormwater and urban waterways, by investigating opportunities such as stormwater harvesting and injection to groundwater storages via managed aquifer recharge techniques.
Many of these projects have been completed during 2011, but with increased rainfall over the last year it will be some time before their impact on water security can be fully assessed. For further information on climate change adaptation, refer to the Adaptation indicator cluster in the Climate theme.
Water demand management
Water demand management is primarily concerned with the implementation of policies or measures to control or influence the amount of water used in ACT. The policies encourage efficient water use and minimal waste of water (ACT Auditor-General's Office 2010).
Throughout much of the reporting period, Stage 3 water restrictions were in place. These restrictions aimed to reduce water consumption by 35% compared to consumption under unrestricted demand (DECCEW 2010). Following the significant rainfall in 2010, the restrictions were reduced to Stage 2 (aiming to reduce water consumption by 25%), and on 1 November 2010 they were replaced by Permanent Water Conservation Measures.
Permanent Water Conservation Measures are designed to secure permanent water efficiencies without making unreasonable impositions on the lifestyle of ACT residents (DECCEW 2010). The main permanent water conservation measures are:
- restriction of watering of lawns and gardens to morning and evening hours (except in winter);
- banning of hosing of hard surfaces including driveways, paved areas and windows; and
- compulsory use of trigger hoses for car washing and watering lawns and gardens (DECCEW 2010).
The Think water, act water strategy set targets of 12% less per capita consumption of water by 2013 and 25% less by 2023, compared with 2003 levels. These targets are to be met through water efficiencies that reduce use, and partially replace use of mains water sources by recycling and use of stormwater and rainwater, and by recharging of aquifers. Think water, act water also set a target of increasing the use of reclaimed water (treated wastewater) from approximately 5% in 2003 to 20% in 2013.
Water efficiency programs
Since 2004, a range of residential water efficiency programs have been implemented under the Think water, act water strategy, including (DECCEW, 2010):
- showerhead rebate programs conducted by the ACT Government in 2004-05 and 2005-06 during which 10,953 rebates were issued for 3-star showerheads.
- the WaterSmart Homes Program offered to ACT residents from 2004 to 2007 to upgrade home plumbing, resulting in 7260 WaterSmart Home visits during 2004-2007;
- Dual Flush Toilet Rebate Program / ToiletSmart, which helped homeowners change to 3L/6L dual-flush toilet cisterns.
- a more efficient ToiletSmart program, offering $100 rebates (larger for pensioners) for homeowners to change from single-flush to 3L/4.5L dual-flush cisterns; this had brought the total number of replacements to 5860 by the end of March 2011;
- the GardenSmart Program, offered since December 2004, to help homeowners be more water-efficient in the garden, with rebates of up to $50 on selected water-saving products, which had issued 1980 rebates to the end of March 2011 and made 5956 GardenSmart visits;
- the Rainwater Tank Rebate scheme that had issued 1962 rebates for household rainwater tanks connected to the ACTEW water supply network, by the end of March 2011.
The ACT Government released the 2009 Demand Management Progress Report in 2010. This report examines the progress made towards meeting the Think water, act water strategy water efficiency targets from April 2004 to June 2009.
Table 4 summarises the calculated water savings attributable to demand management measures and permanent water conservation measures in the ACT from 2005-06 to 2008-09, as reported in the 2009 Demand Management Progress Report (DECCEW 2010). Over the period it can be seen that of the demand management strategies and programs, permanent water conservation measures (saving 5.45 GL in 2008-09) and information and awareness programs (saving 3.39 GL in 2008-09) are by far the most effective measures in contributing to water savings.
The residential water efficiency programs collectively accounted for approximately 1.22 GL (or around 11%) of demand management savings in 2008-09. Overall, Table 4 shows that in 2008-09 demand management and other water efficiency measures are credited with saving 11.36 GL of water, equating to 16.54% of the expected baseline consumption of the ACT community.
Based on projected consumption and water savings from demand management programs, DECCEW (DECCEW 2010) has reported that the 2013 targets outlined in Think water, act water can be easily met (12% reduction in per capita use of mains water). However, based on projected consumption and water savings, a reduction of 25% from baseline consumption by 2023 will be challenging to meet unless further demand management programs are implemented (DECCEW 2010).
Table 4. Effects of Think water, act water: water efficiency measures (GL), 2005-06 to 2008-09
| Water consumption | 2005-06 | 2006-07 | 2007-08 | 2008-09 |
|---|---|---|---|---|
| Expected baseline consumption | 66.31 | 66.76 | 67.73 | 68.71 |
| Actual consumption | 54.34 | 51.06 | 43.56 | 44.95 |
| Water savings | 11.97 | 15.70 | 24.17 | 23.76 |
| Percentage savings | 18% | 24% | 36% | 35% |
| Think water, act water strategies | ||||
| Permanent water conservation measures | 5.29 | 5.53 | 5.40 | 5.45 |
| Information and awareness | 3.30 | 3.33 | 3.36 | 3.39 |
| Water efficiency labelling and standards (WELS) | 0.08 | 0.16 | 0.25 | 0.33 |
| Water Sensitive Urban Design (WSUD) | 0.00 | 0.00 | 0.22 | 0.49 |
| New regulations | 0.15 | 0.20 | 0.20 | 0.20 |
| Think water, act water residential programs | ||||
| WaterSmart Homes | 0.12 | 0.15 | 0.16 | 0.16 |
| GardenSmart | 0.04 | 0.07 | 0.11 | 0.14 |
| ToiletSmart | 0.01 | 0.02 | 0.04 | 0.16 |
| Showerhead programs | 0.19 | 0.29 | 0.42 | 0.44 |
| Rainwater tank | 0.09 | 0.10 | 0.11 | 0.13 |
| Greywater hose giveaway | - | - | 0.19 | 0.19 |
| Think water, act water commercial and government programs | ||||
| Government and school irrigation | - | - | 0.17 | 0.27 |
| Think water, act water total water savings (GL) | 9.29 | 9.68 | 10.62 | 11.36 |
| Think water, act water total water savings (%) | 14.00% | 14.50% | 15.68% | 16.54% |
Source: DECCEW 2010
In addition to the demand management responses outlined above, ACTEW implemented a Large Customer Demand Management program in 2007. The program monitors the water use of the 100 largest water users within the ACT and enables leaks in the system to be identified and fixed.
Over the reporting period, the program has achieved water savings of approximately 600 ML per year and was awarded the 2010 National Program Innovation Award by the Australian Water Association (ActewAGL 2010a).
In 2010 the ACT Government engaged Hunter Water Australia to undertake an independent assessment of the implementation of the Think water, act water strategy and review any need to change targets. In general the report (Hunter Water 2010) concluded that:
- good progress had been made in meeting the objectives, with the majority of actions being either already completed or subject to ongoing review;
- the reclaimed water target of 20% by 2013 is not likely to be met based on current and committed reuse initiatives and should be reviewed in light of current commitments to supply augmentations;
- the reduction in per capita consumption of mains water by 12% by 2013 and 25% by 2023 is expected to be met based on current and committed initiatives and the best available data at this time.
The report recommended that the objectives of Think water, act water should be reviewed and possibly reset to reflect what has been achieved over the last years and where the ACT is now headed in terms of future water resource management and security (Hunter Water 2010).
Pricing
In February 1994, the Council of Australian Governments identified six major areas where the Australian water industry needed reform; among these was charging for water services. Following identification of reforms, a Council of Australian Governments agreement was reached that requires urban water prices to adopt consumption-based, full cost recovery pricing and removal or transparency of cross-subsidies. Prices are to reflect the volume of water supplied, encourage more economical water use and defer the need for costly infrastructure investments such as new dams.
The Independent Competition and Regulatory Commission (ICRC) is an ACT statutory body established to regulate prices, access to infrastructure services and other matters in relation to regulated industries, and to investigate competitive neutrality complaints and government-regulated activities. The Commission set out a price path to apply to water and wastewater tariffs from 1 July 2008 to 30 June 2012 and within this is a water abstraction charge (ICRC 2008). Water charges are mainly based on volumetric usage with a relatively smaller proportionate fixed charge. There is also a water abstraction charge which is a government charge on a volumetric basis to cover the environmental costs of providing water services; it includes a component to cover the scarcity value of water.
From 2007-08 to 2010-11, the fixed water charge has increased from $75.00 to $92.08. This includes the step increase to $85.00 in 2008-09 as part of the ICRC's 2008 price determination. For the reporting period, the fixed charge component has increased by approximately 23%, while the fixed sewerage charge has increased by approximately 25%.
With water restrictions and other measures in place, it is difficult to determine the impact of changes to water pricing on water demand and use.
Environmental flow management
To manage environmental flows in the ACT, the Government reviewed and released the 2006 Environmental Flow Guidelines (the Guidelines) (ACT Government 2006), to provide guidance on volumes and timings of environmental flows in the ACT, and the abstraction limits from the ACT waterways. The Guidelines are implemented in accordance with the ACT Water Resources Act 2007 which requires that water be provided to maintain river systems and associated ecosystem health.
The Guidelines apply a rules-based approach to the governance of environmental flows, whereby water is protected under legislation for the purposes of environmental flows. The management of environmental flows considers the complete river ecosystem and seeks to identify and imitate features of the flow regime, including the natural variability, seasonal variation, floods and intermittent dry periods (ACT Government 2006).
Over the reporting period ActewAGL reported (ActewAGL 2008b, 2009b, 2010b) that environmental flows release targets were generally achieved for all dams and abstraction requirements for the Murrumbidgee River. However, targets were not achieved in several months of 2007-08 for Bendora and Googong Dams. In February and June 2008 temporary changes to the licence were issued to reduce flows for research projects relating to the Enlarged Cotter Dam Project, and in December 2008 a 'Fish Habitat Study' was implemented. Although there was no change to the actual licence conditions, the operation of the Cotter Reservoir for the study was noted to be outside the licence requirements. Approval from EPA for these licence variations was given on 19 December 2008.
Some impact of the environmental flows in non-water-supply catchments can be inferred from the AUSRIVAS study reported in the in the Rivers, lakes and wetlands health indicator cluster. Each sampling site was selected based on potential impacts from the surrounding catchment and environmental flows and river regulation. Overall, the study found that, consistent with previous sampling undertaken on the rivers, the aquatic condition in ACT waterways in non-water-supply catchments was generally considered to be poor. However, this condition cannot solely be attributed to lack of environmental flow provisions but includes other catchment stressors.
Glossary [top ]
Activated carbon water treatment: use of adsorbent carbon products to remove organic pollutants from water
AUSRIVAS: Australian River Assessment System: a classification system that uses riverine aquatic macroinvertebrates to provide information about river health
Environmental flows: managed flows of water in streams and rivers that are designed to maintain aquatic ecosystems
Turbidity: a measure of the clarity or cloudiness of water affected by the presence of suspended material, such as silt and clay
References [top ]
ACT Auditor-General's Office 2010. Performance Audit Report, Water Demand Management: Administration of Selected Initiatives. Auditor-General's Office, Canberra. http://www.audit.act.gov.au/auditreports/reports2010/Water%20Demand%20Mgt%20-%20Final%20report.pdf (accessed 20/6/2011)
ACT Government 2004. Think water, act water - a strategy for sustainable water resource management (summary). Environment ACT, Canberra. http://www.thinkwater.act.gov.au/permanent_measures/the_act_water_strategy.shtml (accessed 20/06/11)
ACT Government 2006. Environmental Flow Guidelines 2006. Environment ACT, Canberra. http://www.environment.act.gov.au/__data/assets/pdf_file/0010/151948/Environmental_Flow_Guidelines_Jan2006.pdf (accessed 07/06/11)
ACTEW 2007. Water Security for the ACT and Region, Recommendations to the ACT Government, July 2007. ACTEW Corporation, Canberra. http://www.actew.com.au/News%20and%20Publications/Reports/Key%20Publications.aspx (accessed 25/11/11)
ACTEW 2011a. Water Storage Levels. ACTEW Corporation, Canberra. http://www.actew.com.au/water/damlevels.aspx (accessed 26/5/11)
ACTEW 2011b. What factors affect water supply? ACTEW Corporation, Canberra. http://www.actew.com.au/WaterSecurity/Research/responding_to_climate_change.aspx (accessed 7/6/11)
ACTEW 2011c. Water Security Program. ACTEW Corporation http://www.actew.com.au/WaterSecurity/MajorProjects/enlarging_cotter_dam.aspx (accessed 3/6/11)
ActewAGL 2008a. Annual Drinking Water Quality Report 2007-08. ActewAGL, Canberra.
ActewAGL 2008b. Licence WU67 - Environmental Flows Report. Annual Compliance Report: July 2007-June 2008. ActewAGL, Canberra.
ActewAGL 2009a. Annual Drinking Water Quality Report 2008-09. ActewAGL, Canberra.
ActewAGL 2009b. Licence WU67 - Environmental Flows Report. Annual Compliance Report: July 2008-June 2009. ActewAGL, Canberra.
ActewAGL 2010a. Annual Drinking Water Quality Report 2009-10. ActewAGL, Canberra.
ActewAGL 2010b. Licence WU67 - Environmental Flows Report. Annual Compliance Report:July 2009-June 2010. ActewAGL, Canberra.
ActewAGL 2011. Waste Water Re-use. http://www.actewagl.com.au/About-us/The-ActewAGL-network/Wastewater-network/Wastewater-re-use.aspx (accessed 23/10/11)
BoM 2011. Annual Australian Climate Statement 2010 http://www.bom.gov.au/announcements/media_releases/climate/change/20110105.shtml accessed 17/06/11
Davis, C. and Lindesay, J. 2011. Weather and Climate of the ACT 2007-11 and Decadal Trends. Report for the Office of the Commissioner for Sustainability and the Environment, Canberra
DECCEW 2010. Think water, act water: 2009 Progress Report. Department of the Environment, Climate Change, Energy and Water, Canberra. http://www.thinkwater.act.gov.au/permanent_measures/documents/2009ProgressReport1_web.pdf (accessed 24/11/11)
Hunter Water 2010. Review of the Implementation of Think water, act water, Final Report 26 July 2010. Hunter Water Australia Pty Ltd, Sydney.
ICRC 2008. Water and Wastewater Price Review: Final Report and Price Determination. Independent Competition and Regulatory Commission, Canberra. http://www.icrc.act.gov.au/__data/assets/pdf_file/0005/106916/Water__and__Wastewater_Price_Review_Final_Report_1of2008.pdf (accessed 20/6/11)
ICRC 2011. Licensed Electricity, Gas, Water and Sewerage Utilities: Compliance and performance report for 2008-09. Independent Competition and Regulatory Commission, Canberra. http://www.icrc.act.gov.au/__data/assets/pdf_file/0005/228776/Compliance_and_Performance_Report_2008-09.pdf (accessed 31/8/11)
MDBA 2011. The Basin Plan. Murray-Darling Basin Authority, Canberra. http://www.mdba.gov.au/basin_plan (accessed 24/11/11)
NHMRC 2004. Australian Drinking Water Guidelines. Australian Government National Health and Medical Research Council, Canberra. http://www.nhmrc.gov.au/publications/synopses/eh19syn.htm (accessed 31/5/11)
NWC 2011. The National Water Initiative - securing Australia's water future: 2011 assessment. National Water Commission, Canberra. http://www.nwc.gov.au/water-reform/assessing-progress/biennial-assessments/the-national-water-initiative-securing-australias-water-future-2011-assessment (accessed 24/11/11)
Other data sources [top ]
In addition to these published reports, data for this paper were also sourced from:
- ACTEW monitoring data 2011
Annex 1. Summary drinking water quality monitoring results, 2007-2010 [top ]
Table A1. Drinking water quality monitoring results, 2007-08
| Parameter | Target / Units | All data based on customers’ taps | |||||
|---|---|---|---|---|---|---|---|
| No. of samples | No. meeting target | %meeting target | Mean | Min | Max | ||
| pH | 6.5 to 8.5 | 958 | 927 | 96.8% | 7.9 | 7.1 | 9.2 |
| Alkalinity a | <200 mg/L | 275 | 275 | 100% | 40 | 18 | 72 |
| Hardness a | <200 mg/L | 239 | 239 | 100% | 47 | 28 | 72 |
| Turbidity | <5 NTU | 958 | 957 | 99.9% | 0.42 | <0.1 | 63 |
| Colour | <15 Pt-Co | 958 | 958 | 100% | 1.3 | <1 | 6 |
| Chlorine | <5 mg/L | 958 | 958 | 100% | 0.55 | <0.01 | 2 |
| Fluoride | <1.2 mg/L | 238 | 238 | 100% | 0.83 | 0.09 | 1.1 |
| THMs | <0.25 mg/L | 238 | 238 | 95th percentile = 0.098 mg/L | |||
| Aluminium | <0.2 mg/L | 239 | 239 | 100% | 0.013 | 0.013 | 0.069 |
| Iron | <0.3 mg/L | 958 | 957 | 99.9% | 0.022 | <0.02 | 4.5 |
| Manganese | <0.1 mg/L | 958 | 957 | 99.9% | 0.011 | <0.0005 | 0.23 |
| Copper | <2 mg/L | 958 | 958 | 100% | 0.022 | <0.001 | 0.77 |
| Lead | <0.01 mg/L | 958 | 958 | 100% | 0.0002 | <0.0002 | 0.0046 |
| Total coliforms | 0 cfu/100 mLb | 958 | 943 | 98.4% | <1 (median) | <1 | 3100 |
| Faecal coliforms | 0 cfu/100 mLc | 958 | 958 | 100% | <1 (median) | <1 | <1 |
Source: ActewAGL2008a.
Notes: a - measured as calcium carbonate (CaCO3) content; b - 95% of samples; c - 98% of samples
Key: cfu = colony-forming units; NTU = nephelometric turbidity units; Pt-Co = platinum-cobalt units; THMs = trihalomethanes (total)
Table A2. Drinking water quality monitoring results, 2008-09
| Parameter | Target / Units | All data based on customers’ taps | |||||
|---|---|---|---|---|---|---|---|
| No. of samples | No. meeting target | %meeting target | Mean | Min | Max | ||
| pH | 6.5 to 8.5 | 971 | 937 | 96.5% | 7.86 | 6.2 | 9 |
| Alkalinity a | <200 mg/L | 260 | 260 | 100% | 43.74 | 31 | 77 |
| Hardness a | <200 mg/L | 130 | 130 | 100% | 48.57 | 26 | 70 |
| Turbidity | <5 NTU | 522 | 520 | 99.7% | 0.39 | 0.1 | 8 |
| Colour | <15 Pt-Co | 535 | 535 | 100% | 1.04 | <1 | 5 |
| Chlorine (tot.) | <5 mg/L | 977 | 977 | 100% | 0.6 | <0.01 | 2.58 |
| Fluoride | <1.2 mg/L | 149 | 149 | 100% | 0.84 | 0.2 | 1 |
| THMs (tot.) | <0.25 mg/L | 238 | 238 | 95th percentile = 0.108 mg/L | |||
| Aluminium b | <0.2 mg/L | 127 | 127 | 100% | 0.045 | 0.021 | 0.210 |
| Iron | <0.3 mg/L | 301 | 300 | 99.7% | <0.045 | <0.02 | 0.41 |
| Manganese b | <0.1 mg/L | 394 | 391 | 99.2% | <0.02 | 0.0007 | 0.28 |
| Copper b | <2 mg/L | 392 | 392 | 100% | 0.012 | <0.001 | 0.38 |
| Lead b | <0.01 mg/L | 171 | 171 | 100% | 0.0003 | <0.0002 | 0.0061 |
| Total coliforms c | 0 cfu/100 mLb | 979 | 975 | 99.9% | 0.09 | <1 | 74 |
| Faecal coliforms d | 0 cfu/100 mLc | 975 | 974 | 99.9% | <1 | <1 | 50 |
Source: ActewAGL 2009a
Notes: a - measured as calcium carbonate (CaCO3) content; b - more than one set of results available. Those results with most samples reported; c - 95% of samples; d - 98% of samples
Key: cfu = colony-forming units; NTU = nephelometric turbidity units; Pt-Co = platinum-cobalt units;
THMs = trihalomethanes (total)
Table A3. Drinking water quality monitoring results, 2009-10
| Parameter | Target / Units | All data based on customers’ taps | |||||
|---|---|---|---|---|---|---|---|
| No. of samples | No. meeting target | %meeting target | Mean | Min | Max | ||
| pH | 6.5 to 8.5 | 979 | 962 | 98.3% | 7.8 | 7.1 | 8.9 |
| Alkalinity a | <200 mg/L | 255 | 255 | 100% | 39 | 28 | 59 |
| Hardness a | <200 mg/L | 120 | 120 | 100% | 45.1 | 31 | 70 |
| Turbidity | <5 NTU | 485 | 485 | 100% | 0.4 | 0.1 | 1.4 |
| Colour | <15 Pt-Co | 484 | 484 | 100% | 1 | <1 | 3 |
| Chlorine (tot.) | <5 mg/L | 976 | 976 | 100% | 0.66 | <0.01 | 1.69 |
| Fluoride | <1.2 mg/L | 120 | 120 | 100% | 0.69 | <0.05 | 1 |
| THMs | <0.25 mg/L | 241 | 241 | 95th percentile = 0.084 mg/L | |||
| Aluminium b | <0.2 mg/L | 120 | 120 | 100% | 0.04 | 0.02 | 0.11 |
| Iron | <0.3 mg/L | 239 | 239 | 100% | <0.02 | <0.02 | 0.06 |
| Manganese b | <0.1 mg/L | 438 | 438 | 100% | 0.0006 | 0.001 | 0.058 |
| Copper b | <2 mg/L | 359 | 359 | 100% | 0.027 | 0.002 | 0.41 |
| Lead c | <0.01 mg/L | 116 | 116 | 100% | 0.003 | <0.0002 | 0.0043 |
| Total coliforms d | 0 cfu/100 mLb | 981 | 975 | 99.4% | <1 | <1 | 19 |
| Faecal coliforms e | 0 cfu/100 mLc | 981 | 981 | 100% | <1 | <1 | <1 |
Source: ActewAGL 2010a
Notes: a - measured as calcium carbonate (CaCO3) content; b - more than one set of results available. Those results with most samples reported; c - more than one set of results available. Most extreme result reported;
d - 95% of samples; e - 98% of samples
Key: cfu = colony-forming units; NTU = nephelometric turbidity units; Pt-Co = platinum-cobalt units; THMs = trihalomethanes (total)
Table A4. Use of potable water supplied 2005-06 to 2009-10
| Potable water supply | 2005-06 | 2006-07 | 2007-08 | 2008-09 | 2009-10 |
|---|---|---|---|---|---|
| Volume of potable water supplied - residential (GL) | 34.4 | 32.0 | 26.1 | 27.5 | 27.6 |
| Volume of potable water supplied - commercial, municipal and industrial (GL) | 14.2 | 13.6 | 11.2 | 11.2 | 10.2 |
| Volume of potable water supplied - Other1 (GL) | 3.9 | 2.1 | 3.5 | 3.1 | 3.8 |
| Total urban water supplied (GL) | 52.5 | 47.7 | 40.7 | 41.8 | 41.6 |
| Average annual residential use (kL/property) | 261 | 240 | 195 | 201 | 199 |
| Volume of bulk water exports2 | 4.4 | 4.1 | 3.4 | 3.6 | 3.7 |
Source: ActewAGL 2008a, 2009a, 2010a
Notes: 1 - 'Other' includes the volume of water supplied to miscellaneous uses, including losses from the distribution network. 2 - 'Bulk water exports' are water exported and used outside of the ACT (Queanbeyan)


Share this page: