Snowy River
Indicator: Land Degradation
Results for this indicator are also available for [an error occurred while processing this directive]
What the results tell us for Snowy River
For the 2004-08 reporting period, currently low salinity hazards were identified, however salinity is expected to become a significant issue in the Shire in the future. Drought was experienced throughout the Shire for much of the period. Landuse in the Shire remained largely compatible with its capability class. Since the last reporting period there has been no noteworthy data released on erosion, acidic or sulphate soils.
Sustainability of landuse
See also: Landuse
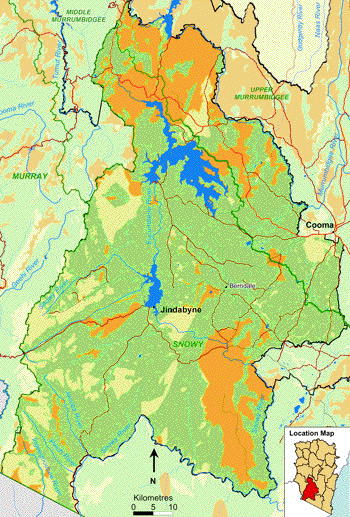
Land capability in the Snowy River Shire is predominately in favour of National Parks, with some grazing areas suitable for both grazing and cultivation. (Figure 1).
Figure 1. Land capability within Snowy River Shire
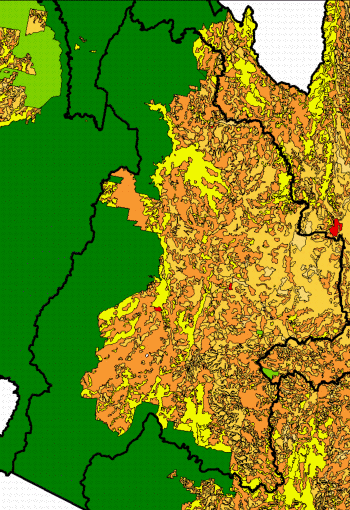
Source: NSW Department of Lands 2008
The majority of land in Snowy River Shire is under landuse types compatible with the land capability class (Table 1). Approximately 1.5% of the Shire has landuses not suited to land capabilities, therefore having the potential to cause erosion.
The Shire has 31% of land under grazing, 99% of this land is within its capability. The remainder of the grazing lands is in areas of high erosion risk if cleared; the Department of Lands recommends that these areas remain timbered.
Snowy River Shire has 1% of land classified under cropping, 97% of this land is not suitable for regular cultivation. Poor suitability for regular cultivation may be partially due to climatic variables as well as potential erosion. Another impact of this may include low crop yields.
Approximately 0.2% of the Shire has a land use classified as rural residential, only 1% of this land is not for this purpose. In addition 38 hectares of the land in Snowy River Shire is classified under horticulture, however 89% of this area is not suitable for regular cultivation. The area of land under land capability classes VII and VIII have a high erosion risk if cleared and the Department of Lands recommends that these areas be timber plantations.
| Landuse | Land Capability Class | |||||||
|---|---|---|---|---|---|---|---|---|
| Lands suitable for regular cultivation | Lands suitable for grazing—occasional cultivation | Lands suitable for grazing—no cultivation | Other lands | |||||
| I | II | III | IV | V | VI | VII | VIII | |
| Cropping | 138 | 85 | 3,028 | 1,225 | 2,422 | 82 | 6 | |
| Estimated grazing | 1,094 | 4,131 | 88,830 | 23,382 | 65,774 | 1,986 | 187 | |
| Horticulture | 0.1 | 34 | 4 | |||||
| Other plantations | 1 | 147 | 0.1 | |||||
| Rural residential | 400 | 43 | 547 | 2 | 6 | |||
| Totals (ha) | 1,232 | 4,216 | 92,259 | 24,684 | 68,894 | 2,070 | 199 | |
Types of land degradation
Erosion
The data available on erosion extent in Snowy River Shire is derived from surveys carried out between 1985 and 1992. These surveys indicated that about 1,420 kilometres of gully erosion and about 180 kilometres of streambank erosion were present in the Shire at that time, as well as extensive areas of moderate to minor sheet erosion.
Approximately 65% of the gully erosion measured in Snowy River Shire are classed as severe to extreme, and most gullies were less than three metres deep (Table 2). Most erosion gullies in Australia would have formed soon after the native vegetation was removed, and although these gullies have since stabilised, they are continuing to contribute sediment loads to streams (Hughes and Prosser 2003). In NSW overall, Edwards and Zierholz (2001) estimated that accelerated erosion rates were 10–50 times the natural rates.
Figure 2. Degree of erosion
Source: NSW Department of Lands 2008
It is expected that some of the erosion may have occurred within Snowy River Shire during the current reporting period due to the ongoing drought.
| Erosion type | Depth | Kilometres |
|---|---|---|
| Extreme gully erosion | greater than 6m deep | 339 |
| 3 to 6m deep | 164 | |
| 1.5 to 3m deep | 91 | |
| less than 1.5m deep | 8 | |
| Extreme gully erosion total | 602 | |
| Severe gully erosion | greater than 6m deep | 42 |
| 3 to 6m deep | 77 | |
| 1.5 to 3m deep | 139 | |
| less than 1.5m deep | 42 | |
| Severe gully erosion total | 300 | |
| Moderate gully erosion | greater than 6m deep | 16 |
| 3 to 6m deep | 79 | |
| 1.5 to 3m deep | 172 | |
| less than 1.5m deep | 118 | |
| Moderate gully erosion total | 385 | |
| Minor gully erosion | 3 to 6m deep | 3 |
| 1.5 to 3m deep | 38 | |
| less than 1.5m deep | 95 | |
| Minor gully erosion total | 136 | |
| Streambank erosion | greater than 6m deep | 53 |
| 3 to 6m deep | 78 | |
| 1.5 to 3m deep | 29 | |
| less than 1.5m deep | 19 | |
| Streambank erosion total | 179 |
Source: Department of Infrastructure, Planning and Natural Resources data from 1985 to 1992
| Major erosion type | Degree / type | Hectares |
|---|---|---|
| Mass movement | rock debris avalanche | 7 |
| slump | 1 | |
| soil debris avalanche | 3 | |
| Rill erosion | extreme rill erosion | 434 |
| severe rill erosion | 277 | |
| moderate rill erosion | 861 | |
| minor rill erosion | 750 | |
| Sheet erosion | extreme sheet erosion | 162 |
| severe sheet erosion | 91 | |
| moderate sheet erosion | 13,105 | |
| minor sheet erosion | 139,528 | |
Source: Department of Infrastructure, Planning and Natural Resources data from 1985 to 1992
Salinity
Salinity is anticipated to become a growing problem in Snowy River Shire. However, at present there are no significant areas of salinity in the Snowy River Shire. However by 2050 the salinity hazard is expected to form in the north of the Shire. (Figures 3 and 4) (AWR 2005).
Figure 3. Extent of salinity (2000)
Source: Australian National Resource Atlas 2001
Figure 4. Estimated Extent of salinity (2050)
Acid soils
Approximately 22% of surface soils within Snowy River Shire are classed as strongly acid (pH 3.5–5.5) in 2002 (DLWC, 2002b). These soils occur mainly around the Adaminaby, Lake Eucumbene and along the parts of the Snowy River and Matong Creek. Although many soils in high rainfall areas are naturally acid, the level of acidity in agricultural areas may be partially due to application of nitrogenous fertilizers, removal of produce, and build up of soil organic matter (Upjohn et al. 2005). Also approximately 36% of the Snowy River Shire’s soils are classed as high to critical risk of soil acidification (DLWC, 2002a). This included soils in agricultural areas within the Wullwye, Stony Creek and Eucumbene River catchments that were classed as slightly acid but had a high to critical risk of soil acidification.
Figure 5. Acidity of Soils in Snowy River Shire
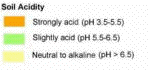
Source: NSW Department of Primary Industries 2008
Impacts of soil acidity can include reduced crop yields, poor establishment of or failure of perennial pastures, permanent degradation of soil if acidity leaches to deeper soils, increase in soil erosion and siltation and recharge of aquifers leading to dryland salinity (Upjohn et al., 2005).
Causes of land degradation
Land degradation can be caused directly by human activities, such as land clearing, over use of fertiliser and changing water tables. Indirect influences, can include flooding of overgrazed or over cultivated land with little ground cover and erosion by wind and water. Drought breaking rain may also cause erosion and can make up about 90% of the total soil loss in an area in a 20–30 year cycle (DPI 2005).
Drought and vegetation condition
According to a recent study by the Bureau of Meteorology (BoM) and the Commonwealth Scientific and Industrial Research Organisation (CSIRO) (BoM, CSIRO 2008) the frequency and extent of exceptionally hot years and exceptionally dry years in NSW are likely to increase in the future. The mean projections indicate that:
- by 2010-2040, exceptionally hot years are likely to affect about 60% of the region, and occur every 1.6 years on average;
- by 2010-2040, no change is likely in the frequency or areal extent of exceptionally low rainfall years; and
- by 2030, exceptionally low soil moisture years are likely to affect about 7% of the region and occur about once every 14 years on average.
As of September 2008 the Department of Primary Industry has classed 71.6% of NSW as ‘In drought’. This includes the Snowy River Shire.
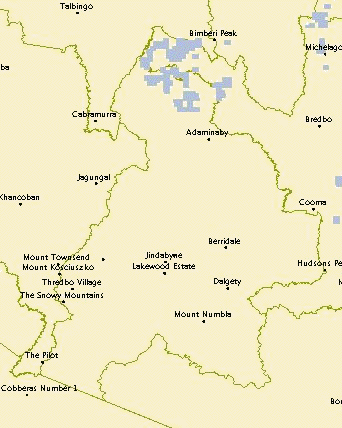
Figure 6. Drought declared areas
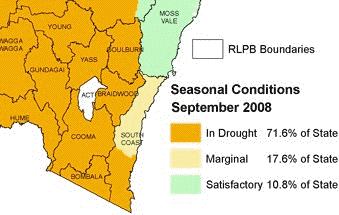
Source: NSW Department of Primary Industries 2008
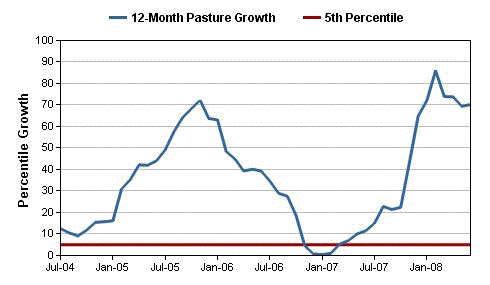
Over the reporting period the Cooma Rural Land Protection Board, the authority covering the Snowy River Shire, suffered extended periods of drought (Table 4) (DPI 2008). This is further illustrated in Figure 7 where the continuing drought period resulted in a near 0% pasture growth for a 3 month period between December 2006 to February 2007 (NAMS 2008).
| Months | Seasonal Conditions |
|---|---|
| September 2004 | Drought |
| December 2004 | Drought |
| March 2005 | Drought |
| June 2005 | Drought |
| September 2005 | Drought |
| December 2005 | Satisfactory |
| March 2006 | Satisfactory |
| June 2006 | Drought |
| September 2006 | Drought |
| December 2006 | Drought |
| March 2007 | Drought |
| June 2007 | Drought |
| September 2007 | Drought |
| December 2007 | Marginal |
| March 2008 | Satisfactory |
| June 2008 | Drought |
Figure 7: Pasture growth in the Snowy River Shire for the period 2004 to 2008
What is being done to improve land condition?
Snowy River Shire Council is located within the Southern Rivers Catchment Management Authority (CMA). The Southern Rivers CMA is responsible for planning natural resource and catchment management actions and projects in the Murray Catchment. However, as Snowy River Shire is a key stakeholder in the majority of the management actions identified by the CMA, it also has a key role in natural resource and catchment management in the local community.
Snowy River Shire also supports a number of landcare groups to undertake on-ground works to help reduce many land issues such as erosion. Support is provided to these groups in conjunction with the Southern Rivers CMA.
About the data
For the current reporting period there has been a lack of new soil data due to the relatively long intervals between soil studies. Given the relevancy of the information in the supplementary report, some sections have been retained for this report. Where material has been used from the Supplementary Report reference has been given to the report and original source.
References
Australian Water Resources (2000) National Land and Water Audit. www.nlwra.gov.au/
Australian Water Resources (2005) Land Salinity Maps. www.nlwra.gov.au/
BoM and CSIRO – see Bureau of Meteorology and the Commonwealth Scientific and Industrial Research Organisation
Bureau of Meteorology and the Commonwealth Scientific and Industrial Research Organisation (2008) An Assessment of the Impact of Climate Change on the Nature and Frequency of Exceptional Climatic Event.
Commonwealth of Australia (2005) National Action Plan for Salinity and Water Quality and Natural Heritage Trust Regional Programs Report 2003–04, Departments of the Environment and Heritage and Agriculture, Fisheries and Forestry, viewed 18 April 2005, http://www.nrm.gov.au/publications/regional-report/03-04/.
CRCCH—see Cooperative Research Centre for Catchment Hydrology
Department of Infrastructure, Planning and Natural Resources, NSW (2004a) 2003/04 Combined NSW Catchment Management Authorities Annual Report, Volume 1: CMA Activities and Achievements, Department of Infrastructure, Planning and Natural Resources, Sydney.
Department of Infrastructure, Planning and Natural Resources, NSW (2005) Meeting the Challenge: NSW Salinity Strategy Premier's Annual Report 2003–04. NSW Department of Infrastructure, Planning and Natural Resources, viewed 12 May 2006, http://www.dlwc.nsw.gov.au/salinity/pdf/2003_2004_salinity_annual_report.pdf
Department of Land and Water Conservation (NSW) (1999) Groundwater Quality Protection Policy, Department of land and Water Conservation, Sydney, on line at http://www.dnr.nsw.gov.au/water/pdf/nsw_state_groundwater_quality_policy.pdf.
Department of Land and Water Conservation, NSW (2000) Taking on the Challenge: The NSW Salinity Strategy, Department of Infrastructure, Planning and Natural Resources, viewed 4 May 2006, http://www.dlwc.nsw.gov.au/salinity/government/govt-docs.htm.
Department of Land and Water Conservation, NSW (2002) Soil Acidification Hazard Mapping , produced for the 2003 NSW State of the Environment Report, Department of Land and Water Conservation, Parramatta.
Australian National Resource Atlas Mapmaker facility http://www.anra.gov.au/mapmaker/mapservlet?app=anra
Department of Primary Industries, NSW (2005) Soil Management Following Drought, Agnote DPI 355, Third Edition, Department of Primary Industries, viewed 18 April 2006, http://www.agric.nsw.gov.au/reader/pasture-crops-recovery/dpi355.htm.
Department of Primary Industries, NSW (2006) Drought maps—areas of NSW suffering drought conditions, Department of Primary Industries, viewed 8 May 2006, http://www.agric.nsw.gov.au/reader/drt-area?picQuant=100.
Department of Primary Industries, NSW (2008) Drought maps and drought assistance eligibility status of RLPBs http://www.dpi.nsw.gov.au/agriculture/emergency/drought/situation/drought-maps
DIPNR—see Department of Infrastructure, Planning and Natural Resources, NSW
DLWC—see Department of Land and Water Conservation, NSW
DPI—see Department of Primary Industries, NSW
Edwards, K and Zierholz, C (2001) Soil Formation and Erosion Rates, in PEV Charman and BW Murphy (eds) Soils: Their Properties and Management, 2nd Edition, pp 39–58, Oxford University Press, Oxford, cited in Lu, H, Prosser, IP, Monn, CJ, Gallant, JC, Priestley, G and Stevenson, JG (2003) Predicting sheetwash and rill erosion over the Australian continent, Australian Journal of Soil Research Vol. 41, 1037–1062, viewed 3 May 2006, http://palaeoworks.anu.edu.au/pubs/AustJSS03.pdf.
Hughes, AO and Prosser, IP (2003) Gully and Riverbank Erosion Mapping for the Murray-Darling Basin, Technical Report 3/03, March 2003, CSIRO Land and Water, Canberra, viewed 26 April 2006, http://www.clw.csiro.au/publications/technical2003/tr3-03.pdf.
National Agricultural Monitoring System (Namms) (2008), Simulated Pasture Growth for Snowy River, http://www.nams.gov.au/
Upjohn, B., Fenton, G. and Conyers, M. (2005) Soil Acidity and Liming Agfact AC.19 3rd Edition. NSW Department of Primary Industries, viewed 17 July 2006, http://www.agric.nsw.gov.au/reader/soil-acid/2991-soil-acidity-and-liming-.pdf