Goulburn-Mulwaree
Please note: Text or data highlighted in this colour represent an update to this indicator for the period 2008/09. All rainfall figures have been updated on this page.
Rainfall Analysis
The main rainfall observing site used in this analysis was Kippilaw (Bureau of Meteorology Station No. 070055), which has records commencing in 1886. Kippilaw is 12.3 km from the centre of Goulburn. Data from nearby stations were used to calculate values for months with missing data at this site (see Appendix 2 for further information).
Note that in the following analyses rainfall totals for individual months or years (where the year is defined as the 12 months from July to June) are compared to the long-term average (or climatology) from 1961-1990. A 30-year period is used to calculate climatological averages to conform with World Meteorological Organisation practice; this takes into account year-to-year variations and less frequent events such as El Niño or La Niña. This particular 30-year period is used internationally as a standard climatological average period.
As shown in the table below, Kippilaw was drier than average in all five years in the period 2004/05-2008/09. The driest year was 2004/05, when rainfall was 20.1% below the long-term average at 545.2 mm for the year. The wettest year in the last four years was 2005/06, with 630.1 mm which is still 7.6 % below the average.
| Rainfall Statistics | Goulburn (Kippilaw) | ||||
|---|---|---|---|---|---|
2004/5 |
2005/6 |
2006/7 |
2007/8 |
2008/9 |
|
| Annual Total* (mm) | 545.2 |
630.1 |
557.2 |
608.0 |
628.3 |
| Anomaly (mm) | -137.0 |
-52.2 |
-125.1 |
-74.3 |
-54.0 |
| Anomaly (%) | -20.1 |
-7.6 |
-18.3 |
-10.9 |
-7.9 |
| Mean (1961-1990) (mm) | 682.3 |
||||
*Note: annual totals were calculated for the 12 months July-June.
Monthly Rainfall, 2004-2009
A comparison of monthly rainfall totals with the long-term monthly average rainfall at Kippilaw (Figure 1) shows large variations during this five year period. Rainfall was generally below average, with several short periods of above average rainfall. The wettest conditions were recorded in 2005/06, June 2007 and late 2007/early 2008. Conditions were driest in 2006 and in mid 2007. Rainfall during the November 2007-March 2008 and October 2008-December 2008 periods was most likely related to 2 La Nina events.
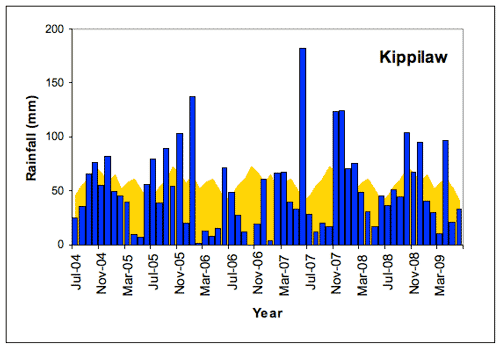 |
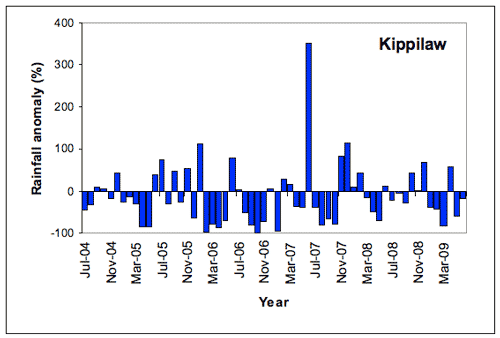
Of the 60 months in this period, 37 months (62% of the record) had below-average rainfall at Kippilaw (Figure 2). The most prolonged dry spell began in February 2006 and extended to October 2007 with another extensive dry period from March 2008-June 2009. Another short dry period occurred between January 2005 and May 2005. The generally dry period during the period February 2006 to October 2007 reflect the impact of the El Niño event of 2006/7. The driest month was October 2006 when no rainfall was recorded (long term average for October is 71.9 mm) while February 2006 only recorded 1.2 mm. There were several wet periods over the period but were of short duration. Rainfall was generally average during the periods August 2004 to November 2004, July 2005 to January 2006 and above average for the period November 2007 to February 2008 and November 2008 to January 2009. The wettest month was June 2007 with 181.8 mm (long term average for June is 40.4 mm). This was the second wettest June on record since 1886.
 |
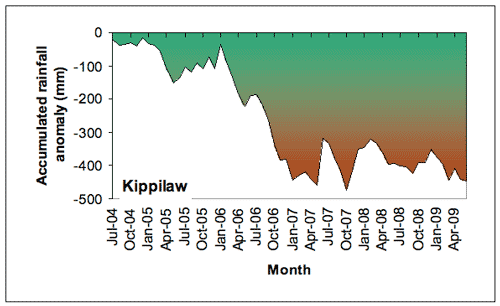
The result of the generally drier than average conditions at Kippilaw during 2004-2009 is reflected in Figure 3. The rainfall accumulation deficit was just below the norm up to January 2005 when it increased slightly through to January 2006. The deficit increased rapidly through 2006 and 2007 then has remained fairly flat through 2008 and 2009. The rapid drop during 2006/7 reflects the dry conditions due to the impact of the El Niño event during this period. The accumulated deficit for the five year period was 447.2 mm (66% of the Jul-Jun average rainfall).
 |
The climatological context for rainfall at Kippilaw
The long-term perspective
As is typical of the region, Kippilaw has experienced large fluctuations in annual (July-June) rainfall, including several extended periods of above- or below-average rainfall since records began in 1886. In general, annual rainfall was lower and less variable early in the 20th century, followed by a period of greater variability. Rainfall variability has been lower since about 1980 (Figure 4). The recent dry period is reflected in other parts of the long term record such as the late 19th and early part of the 20th Century and the period from the late 1920’s through to the end of World War II. To this point in time this recent dry period can only be considered as part of the long term variability in rainfall experienced in the region.
Rainfall in the late 19th and early 20th century was generally below average (to about 1950), with the exception of some wetter years in the 1920s and 1930s. Since then annual rainfall totals have been more variable.
- Several wetter-than-normal years around 1950 and 1960 produced a generally wetter period then.
- A generally drier period around 1980 was followed by some good rainfall years in the late 1980s. Since 1993 conditions have been generally drier than average.
The wettest year (July-June) on record was 1949/50 (1183 mm); the driest year was 1896/97 (346 mm).
![Figure 4. Annual (July-June) rainfall at Kippilaw from 1886/7 to 2008/9 depicted as deviations from the long-term mean. A 5-year running mean is superimposed to highlight wetter and drier periods. [Deviations were calculated as the difference between the rainfall for each year and the mean for the period 1961-1990 (scale in mm).]](../images/goulburn-mulwaree/rain04.gif) |
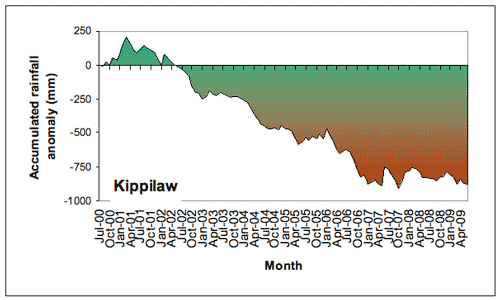
Accumulated rainfall anomalies since 2000 (Figure 5) indicates the dry period of 2006/7 is an extension of the dry period that commenced in 2002 and reflects the impacts of the two El Niño years of 2002-3 and 2006-7 without a compensating wet period. During the whole period there were 73 months (68%) of rainfall deficit and the total accumulated deficit was 879.5 mm (128 % of the average Jul-Jun rainfall).
 |
About the data