Tumut
Rainfall Analysis
The main rainfall observing sites used in this analysis were Tumut - Wattle St (Bureau of Meteorology Station No. 072044), which commenced in 1886; and Cabramurra (No. 072091), which closed in 1999 and was replaced by an automatic weather station (AWS). Data from nearby stations were used to calculate values for months with missing data at these sites (see Appendix 2 for further information). However, there are problems in developing a high quality continuous dataset for Cabramurra because the relationship between rainfall at the manual observing station and at the AWS is not particularly strong, despite the two sites being in close proximity.
Note that in the following analyses rainfall totals for individual months or years (where the year is defined as the 12 months from July to June) are compared to the long-term average (or climatology) from 1961-1990. A 30-year period is used to calculate climatological averages to conform with World Meteorological Organisation practice; this takes into account year-to-year variations and less frequent events such as El Niño or La Niña. This particular 30-year period is used internationally as a standard climatological average period.
As shown in the table below, Cabramurra appears to have had approximately average rainfall during 2004/05 and 2005/06, and below average rainfall in 2006/07 and 2007/08. Tumut was drier than average in all four years. The driest year at Cabramurra appears to have been 2006/07, when rainfall was approximately 37% below the long-term average. If the derived dataset for Cabramurra accurately reflects conditions there, then 2006/07 was one of the driest years on record. At Tumut, the driest year was 2006/07 when rainfall was 45.2% below average. This was the second driest year on record at Tumut. The wettest year in the last four years at Cabramurra was 2004/05, when rainfall was near average. At Tumut the wettest year was 2004/05 with rainfall 4.5% below average.
| Rainfall Statistics | Cabramurra | Tumut | ||||||
|---|---|---|---|---|---|---|---|---|
| Annual Total* (mm) | 2004/5 | 2005/6 | 2006/7 | 2007/8 | 2004/5 | 2005/6 | 2006/7 | 2007/8 |
| Anomaly (mm) | 5.3 | -0.9 | -597.0 | -471.0 | -42.8 | -117.2 | -367.7 | -153.6 |
| Anomaly (%) | 0.3 | -0.1 | -36.6 | -28.9 | -5.3 | -14.4 | -45.2 | -18.9 |
| Mean (1961-1990) (mm) | 1630.9 | 812.8 | ||||||
*Note: annual totals were calculated for the 12 months July-June.
Monthly Rainfall, 2004-2008
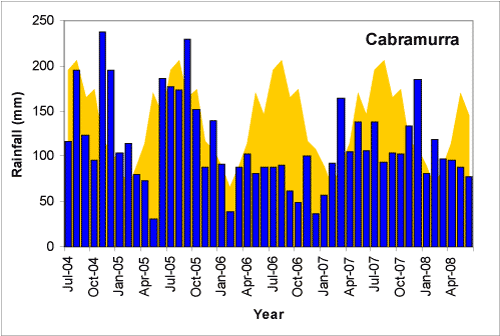
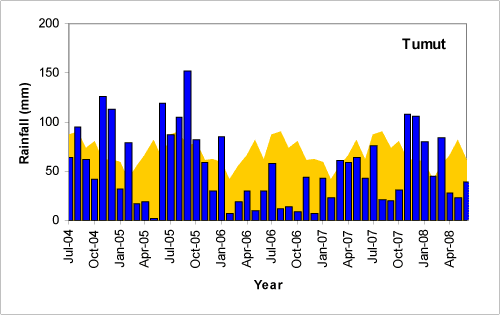
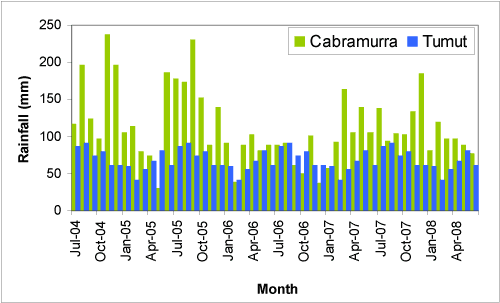
A comparison of monthly rainfall totals with the long-term monthly average rainfall at Cabramurra and at Tumut (Figure 1a and b) shows that the first half of the period was characterised by close to average rainfall, except for the dry autumn of 2005. The period from early 2006 to 2008 had generally below average rainfall, with only isolated months of average or above average rainfall. The wettest months occurred in the first part of the period and there were some particularly dry months during 2006/07. Although the monthly rainfall at Tumut is less than that at Cabramurra (Figure 2) and the average annual rainfall at Tumut is half that at Cabramurra (Table 1), the patterns of wetter and drier than average months through the reporting period are similar, indicating that the two stations are influenced by similar drivers of rainfall variability. The prolonged period of below-average rainfall during 2006/07 was associated with an El Niño event; the wet months in late 2007-early 2008 coincided with a La Niña event.
a b |
 |
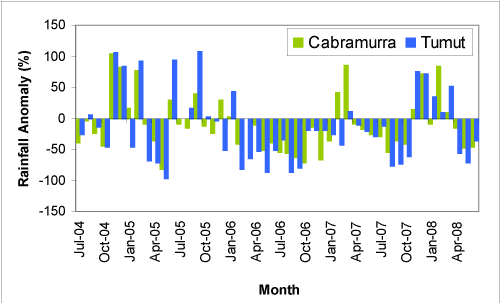
Of the 48 months in the reporting period, 33 (69% of the record) had below-average rainfall at Tumut and approximately 34 months (71%) at Cabramurra (Figure 3). The most prolonged dry spell in the region began in February 2006 and extended to October 2007. Throughout this period there were only four months of average or above average rainfall, reflecting the impact of the El Niño event of 2006/07 on the region. The autumns of 2005 and 2008 were also particularly dry at both locations. The driest individual month at both stations was May 2005, with 2.2 mm at Tumut (long term average for May is 80.7 mm) and around 30 mm at Cabramurra (long term average for May is 168.9 mm). Average or above average rainfall was experienced at both locations only in the periods November 2004 to February 2005, May to October 2005 and November 2007 to March 2008. The wettest individual month at Tumut was September 2005 with 152 mm (long term average 73.2 mm) followed by November 2004 with 125.6 mm. These months appear also to have been the wettest months at Cabramurra, with around 230 mm likely to have been recorded for both months (as these data are derived from nearby imperfectly matched locations it is difficult to say which was the wetter of the two). Rainfall totals in these months at Tumut were the 3rd highest for September and the 10th highest for November since 1886. Rainfall of around 230 mm at Cabramurra places November 2004 in the top three or four wettest Novembers since 1955.
 |
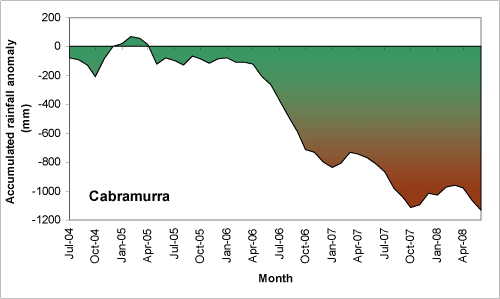
The results of the generally dry conditions during 2006/07 can be seen in Figure 4. Rainfall anomaly accumulation at both locations fluctuated around the norm in 2004 and 2005, followed by a rapid increase in the rainfall deficit during 2006/07 before flattening out in 2008. This increase in the rainfall deficit in 2006/07 again reflects the impact of the El Niño event in this period. The accumulated deficit in monthly rainfall totals at Tumut for this period was around 708 mm (87% of the Jul-Jun average) while at Cabramurra it was around 1130 mm (69% of the Jul-Jun average).
a
|
 b
b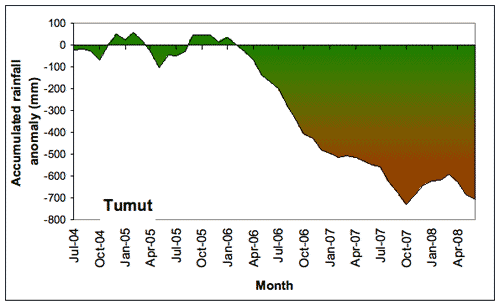
The climatological context for rainfall at Cabramurra and Tumut
The long-term perspective
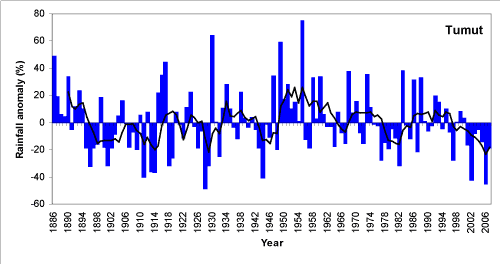
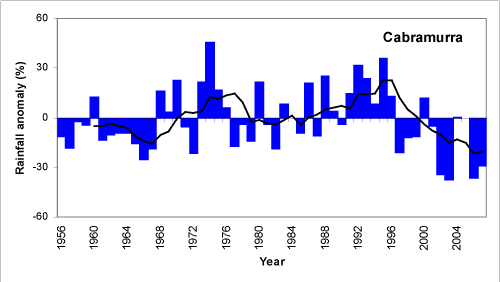
As is typical of the region, Cabramurra and Tumut have experienced large fluctuations in annual (July-June) rainfall, including several extended periods of above- and below-average rainfall since records began (in 1886 at Tumut, and in 1955 at Cabramurra). In general, annual rainfall was lower and less variable early in the 20th century, followed by a period of greater variability. Rainfall variability has been lower since about 1980 (Figures 5 and 6). At Tumut the recent dry period is similar to the dry periods experienced in the late 19th to early 20th centuries and in the late 1970s to early 1980s. To date the recent dry conditions appear to fall within the range of long term rainfall variability in the region. At Cabramurra the recent dry period is the driest on record; however, this observation must be interpreted with caution due to the short length of the record (which commenced in 1955) and the fact that the dataset for recent years contains interpolated data.
- Rainfall in the late 19th and early 20th century was generally below average (to about 1915), followed by a short wet period in the late 1910s. Since then annual rainfall totals have been more variable, until the mid 1980s.
- Several wetter-than-normal years in the 1950s produced a generally wetter period then.
- A consistently drier period around 1980 was followed by slightly above-average rainfall until the early 1990s. Since about 1995 conditions have been generally drier than, or close to average.
The wettest year (July-June) on record at Tumut was 1955/56 (1421 mm); the driest year was 1928/29 (419 mm).
- The shorter record at Cabramurra means that the same analysis is not possible for this station. Nevertheless, the Cabramurra record clearly shows similarities with the longer Tumut record.
- Cabramurra was more consistently drier than average in the 1960s than was the case at Tumut; both stations were wetter than normal in the 1970s.
- The early 1980s were less consistently dry at Cabramurra than at Tumut, and the early 1990s period of above-average rainfall more strongly expressed at Cabramurra. Since 1996 conditions have been generally drier than average at this station, and more strongly than at Tumut.
- It is unlikely that these differences are a result of the different record lengths, since the long-term average against which the anomalies are calculated is that for the period 1961-1990 in both cases.
The wettest year (July-June) on record at Cabramurra was 1974/75 (2372 mm) while the driest year appears to have been 2002/03 (closely followed by 2006/07). Since these figures are derived values, it is not possible to determine which was the record year.
 |
 |
The dry period that commenced in 2002 affected rainfall at both stations. While there are differences in the accumulated rainfall deficit between the two sites, the rates at which the deficits accumulated were similar. The periods of most rapid accumulation of negative rainfall anomalies were 2002/03 and 2006/07, both of which were El Niño years. During this eight-year period there were 65 months (68%) with rainfall deficits at Tumut and around 61 months (64%) at Cabramurra. The total rainfall deficits over this period were 1243 mm at Tumut (153% of Jul-Jun annual total) and around 1712 mm at Cabramurra (147% of Jul-Jun annual total).
a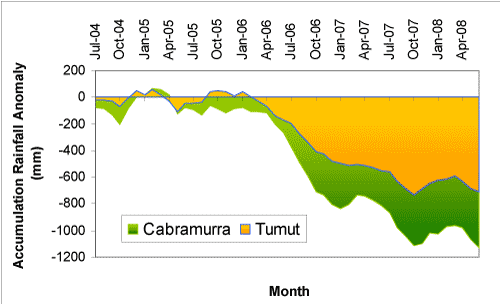 b b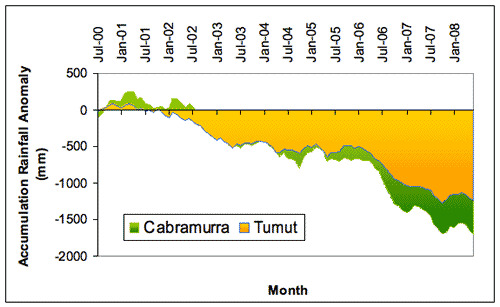 |
About the data
