Temperature Appendices
Please note: Text or data highlighted in this colour represent an update to this page for the period 2008/09. Figures 1 to 3 in Appendix 3 were added in this update.
Appendix 1: Temperature Analysis
All data used in this analysis were extracted from the Bureau of Meteorology Climate Database.
The analysis of regional temperatures surrounding the ACT is complicated by several factors, including
- Reduced coverage of observations. While the Bureau of Meteorology has many volunteer rainfall observers, there are not as many observers taking temperature readings across the region.
- Lack of long term records. Many locations have only short records and therefore cannot be used for analysis. It is considered that records over at least a 30-year period are needed to determine trends in temperature. Given the nature of the Bureau of Meteorology Co-operative Observer network, when one observer stopped taking records a new observer and new site would have to be found in the area. As this process could take some time there are generally no parallel observations that could be used to calibrate the date from the new site. Gaps in the records are common.
In several locations there are now automatic weather stations (AWSs) near the longer-term sites that can be used to fill gaps in the records with reasonable accuracy.
- Lack of continuous observations. As a result of observer changes, continuous temperature readings over the region are very limited. In fact there are only two sites that have long term continuous data in the Australian Capital Region: Canberra Airport and Moruya Heads. This lack of continuous data impacts considerably on the accuracy of calculations of trends and long-term averages for individual stations.
- Microclimates around each observation site may impact on observed trends. The position of the site with respect to surrounding obstructions such as trees and buildings can also affect the observations. These effects tend to impact on minimum temperatures more than on maximum temperatures.
The analysis produced for this report therefore cannot be considered definitive for any individual station apart from the two long term stations, Canberra Airport and Moruya Heads. However, when the observations at all sites are considered together some indication of temperature trends across the region is evident.
A summary of the data at all observation sites is given in Table A1.
| Site | Data Quality | Comments |
|---|---|---|
| Bombala | Good data at beginning and end. Most missing data 1986-1990. Some missing daily data 2005-2007 | Good data at beginning and end means that long term trends provide useful information. Data filled by comparison with AWS. |
| Canberra Airport | Excellent. No missing data. | BoM Climate Reference Station |
| Cooma | Good data set after 1973. Odd missing months from time to time. Some missing daily data 2005-2007. | Missing data should not impact on long term averages. Site position may be an issue. Data filled by comparison with AWS. |
| Goulburn | Good data from 1980. Most missing data 1970-1980. Some missing data 2005-2007. | Missing early data likely to affect 1975-2004 averages. Data filled by comparison with AWS. |
| Moruya Heads | Excellent. No missing Data | BoM Climate Reference Station |
| Taralga | Generally good data set with most missing data 1986-1990. No missing data 2005-2007 | Occasional missing months may affect long term averages. |
| Tumbarumba | Generally good data set apart from December 1975-79 and 1985-86. No missing data 2005-2007. | Loss of December data 1975-79 impacts on long term averages |
| Yass | Good data set. Occasional missing months. One or two missing days 2005-2007. No AWS available | Missing data unlikely to impact on long term averages. Monthly averages calculated without missing data. |
At Bombala, Cooma and Goulburn there are AWSs located at the nearby airports. Comparison of data for overlapping periods indicates that the correlations are extremely high for maximum temperatures and very high for minimum temperatures, as shown in Table A2. Linear regression was used to fill the gaps in the records for these locations.
| Site | Period of Overlap | MaxT R2 | MinT R2 |
|---|---|---|---|
| Goulburn | 1990-2008 | 0.9842 | 0.8813 |
| Bombala | 1992-2007 | 0.9296 | 0.8473 |
| Cooma | 1990-2008 | 0.9669 | 0.8504 |
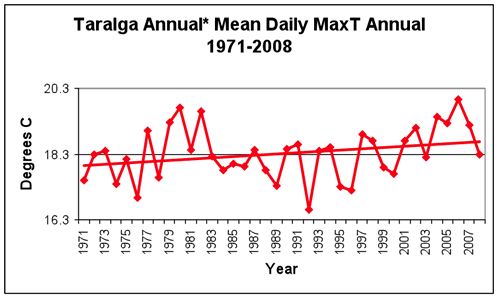
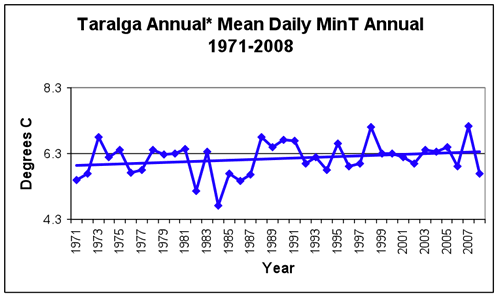
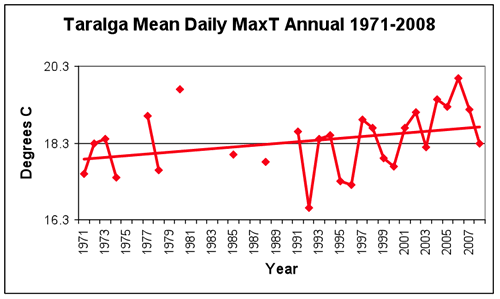
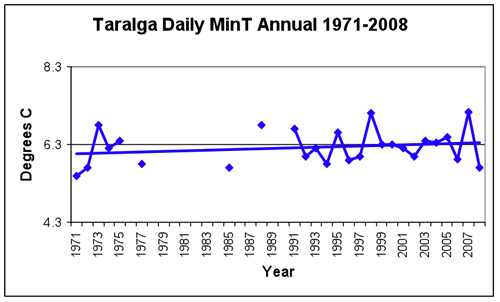
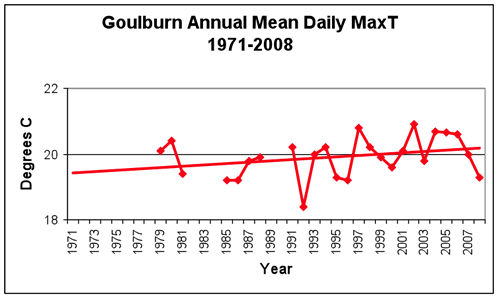
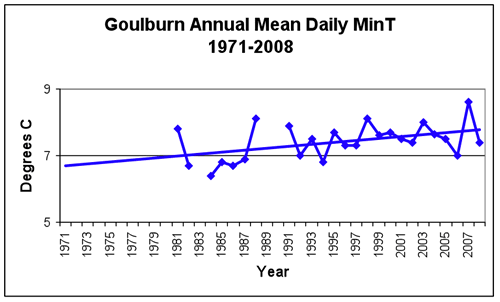
Appendix 3: Development of long term temperature records for Taralga and Goulburn
The proximity of Goulburn and Taralga leads to the possibility of developing a derived complete data set for mean daily maximum and minimum temperatures for the two sites.
Figure 1 indicates the relationships between the mean daily maximum and minimum temperatures for the months for which there are overlapping data over the 1971-2008 period.
|
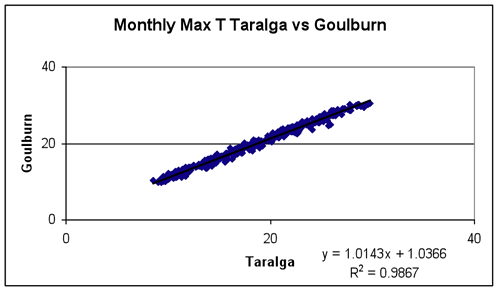
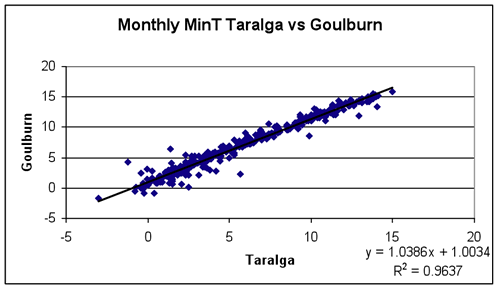
From these plots, it can be seen that there is a strong relationship between the temperatures at the two locations with R2 values for both the maximum and minimum temperatures exceeding 0.96.
Using the linear regression equations from these plots enables the calculation of monthly temperatures for both sites where observations from only one site are available. This has resulted in deriving an almost complete data set for both sites with only four remaining individual months of missing data. For these months, the long-term (30-year) mean daily maximum and minimum temperatures for each site were used to fill the gaps in order complete the data sets.
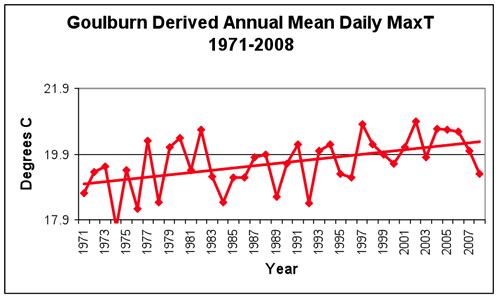
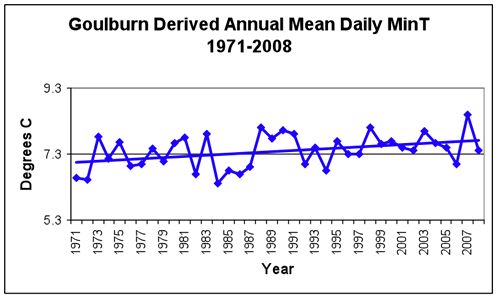
Figures 2 and 3 provide a comparison of the original and derived data sets for Goulburn and Taralga. The results of these comparisons support the overall increasing trends in temperatures that are suggested in the original data sets.
|
|