Gundagai
Indicator: Water Use
Results for this indicator are also available for [an error occurred while processing this directive]
What the results tell us about Gundagai
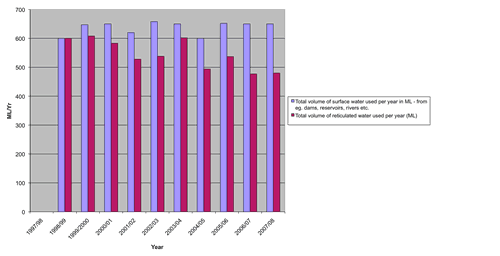
Gundagai Shire Council has adopted an effective response to the present drought, which has conserved approximately 20% of the reticulated water previously used. All the wastewater effluent is recycled for irrigation of recreational areas. Non-reticulated water and reticulated water use by rural/irrigation sectors has increased, resulting in overall water use remaining constant.
Supply- how much water could we have?
Gundagai draws its drinking water supply for the town from the Murrumbidgee River, which is processed at the treatment plant. The Murrumbidgee River is a major supply river to the irrigation areas downstream, and has high flows in summer due to water being released from Burrinjuck dam and from the Snowy system via Tumut River. The limitation on the volume drawn for the town supply is by licence, rather than by the river flow.
Consumption – how much water was used?
Total Use
Overall water use by the Council area was effectively constant from 2000 onwards at 600 to 650 ML/Yr. The use of reticulated water progressively dropped from 2003-04 as water restrictions were imposed. The overall reduction in reticulated water use between 2000-01 and 2007-08 was nearly 20%.
Non-reticulated water was used in rural industries, which in the Gundagai area include vineyards, horticulture and tree plantations. This increased from 67 ML/Yr in 2000-01 to 170 ML/Yr in 2007-08.
Figure 1. Total water use in Gundagai Shire Council area

Use by sector
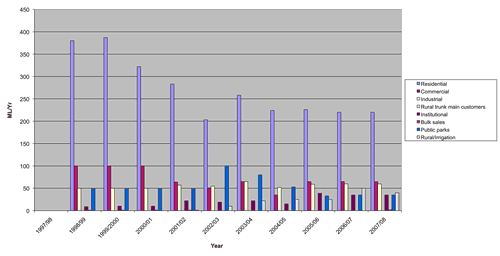
The domestic sector was the major user of reticulated water, as would be expected. Rural industry such as irrigation mainly uses untreated surface water or bore water. The rural/irrigation sector however increased its use of reticulated water from zero in 2000-01 to 50 ML/Yr in 2006-07. The commercial plus industrial sector’s use dropped from 150 ML/Yr in 2000-01 to 125 ML/Yr in 2007-08. In Gundagai this use includes the Gundagai Meat Processors.
Figure 2. Total water use by sector – Gundagai Shire Council area

Environmental flows
These are not relevant for Gundagai.
Managing water demand and use
Water conservation
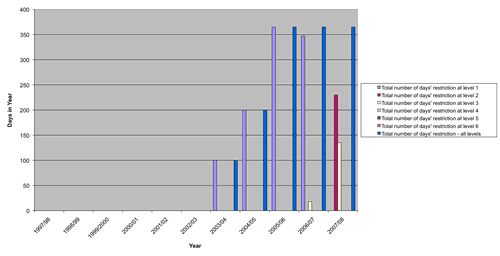
Gundagai Shire Council brought in area-wide water restrictions in 2003-04 with 100 days of Level 1 restrictions, with 200 days at Level 1 the following year. By 2005-06 this had increased to the whole year at Level 1, in response to the increasing drought conditions. Level 3 restrictions were briefly brought in 2007 and continued for 135 days into the 2007-08 year. The remainder of the year was at Level 2 restrictions. These restrictions were a community response to drought, not an obligatory reduction through lack of water.
Figure 3. Water restrictions in Gundagai Shire Council area

Recycling – making the drop go further
All the effluent from the wastewater treatment plant is re-used for watering recreational areas in and near the town. The output is 146 ML/Yr, saving a considerable volume of reticulated water. The effluent from Gundagai Meat processors is used to irrigate pastures. In this way no additional nutrients are added to the river.
Laws and policy
The Government of NSW undertakes water licensing. The Gundagai Shire Council area is located in the Murrumbidgee Catchment Management Area.
About the data
Quantitative data received from Gundagai Shire Council
