Bega Valley
Please note: Text or data highlighted in this colour represent an update to this indicator for the period 2008/09. All rainfall figures have been updated on this page.
Rainfall Analysis
The main rainfall observing sites used in this analysis were Bega - Newtown Road (Bureau of Meteorology Station No. 069002) and Eden Caravan Park (No. 069015). Data from other nearby stations were used to calculate values for months with missing data at these two sites (see Appendix 2 for further information).
Note that in the following analyses rainfall totals for individual months or years (where the year is defined as the 12 months from July to June) are compared to the long-term average (or climatology) from 1961-1990. A 30-year period is used to calculate climatological averages to conform with World Meteorological Organisation practice; this takes into account year-to-year variations and less frequent events such as El Niño or La Niña. This particular 30-year period is a standard climatological average period used internationally.
As shown in the table below, Bega and Eden were both drier than average in four of the five years in the period 2004/05-2008/09. The driest year at both Bega and Eden was 2008/09, when rainfall was 54.5% below the long-term average at Bega and 32.1% at Eden. It was the third driest year on record at Bega. The wettest year in the last five years was 2006/07 at Bega (5.7% above average rainfall) and 2005/6 at Eden (12.7% above average).
| Rainfall Statistics | Bega | Eden | ||||||||
|---|---|---|---|---|---|---|---|---|---|---|
2004/5 |
2005/6 |
2006/7 |
2007/8 |
2008/9 |
2004/5 |
2005/6 |
2006/7 |
2007/8 |
2008/9 |
|
| Annual Total* (mm) | 733.6 |
753.1 |
924.4 |
595.0 |
397.7 |
739.6 |
986.8 |
849.2 |
751.2 |
673.2 |
| Anomaly (mm) | -140.8 |
-121.4 |
49.9 |
-279.4 |
-476.8 |
-136.2 |
111.0 |
-26.6 |
-124.6 |
-202.6 |
| Anomaly (%) | -16.1 |
-13.9 |
5.7 |
-32.0 |
-23.1 |
-15.6 |
12.7 |
-3.0 |
-14.2 |
-54.5 |
| Mean (1961-1990) (mm) | 874.5 |
875.8 |
||||||||
*Note: annual totals were calculated for the 12 months July-June.
Monthly Rainfall, 2004-2009
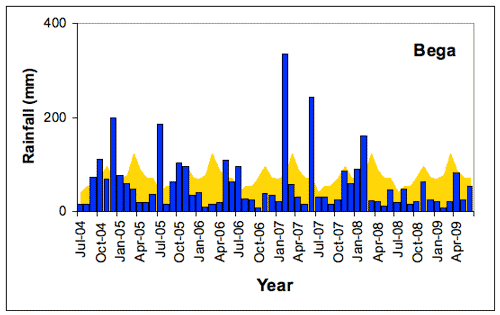
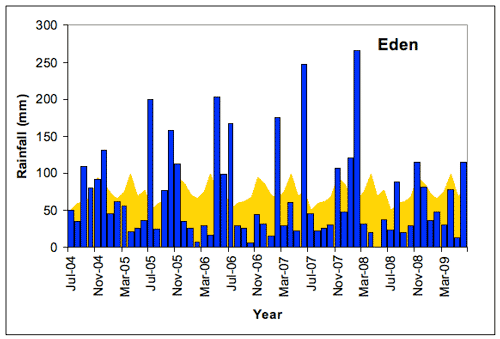
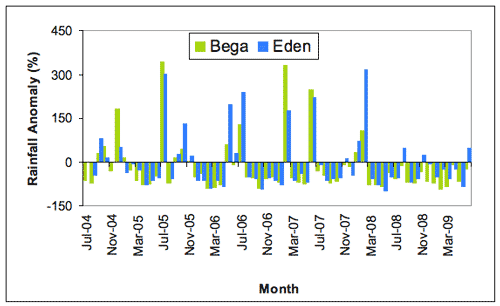
A comparison of monthly rainfall totals with the long-term monthly average rainfall over this period at Bega and at Eden (Figure 1a and b) shows that there have been a considerable number of months of below average rainfall interspersed with months of extremely heavy rainfall, particularly at Eden. The wettest months occurred mostly as a result of the development of East Coast Lows in the Tasman Sea which tended to affect Eden rather than Bega which is further inland. The wettest months occurred in February at Bega (334 mm) and in February 2008 at Eden (265.5 mm). The prolonged period of below-average rainfall in 2006-2007 was associated with an El Niño event that coincided with a negative phase of the Pacific Decadal Oscillation which tends to amplify the impacts of El Niño Southern Oscillation events on rainfall in eastern Australia.
Apart form the November 2007-January 2008 period, 2008/9 has been extremely dry in the region, particularly at Bega which is inland of the coast and there have been a complete absence of heavy rainfall events from East Coast Lows during this period. The impact of the coastal influence on rainfall at Eden is evident in that Eden has had more months with average or above average rainfall than Bega during this period. Rainfall during November 2007-January 2008 and again November-December 2008 was moist likely related to two La Nina events, although the impact of the 2008 La Niña event was extremely patchy across the region.
a b |
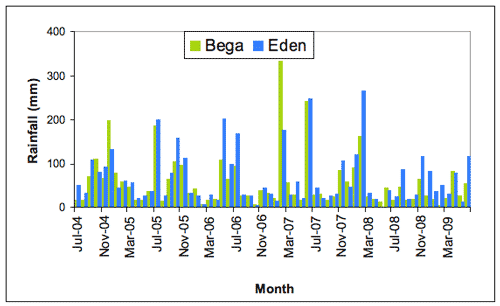 |
Of the 60 months in this period, 46 (77% of the record) had below-average rainfall at Bega, and 42 (70%) at Eden (Figure 3). In fact in the 2008/9 year, Bega did not have one month of above average rainfall and since July 2007 it has only recorded 2 months of above average rainfall. Late 2004 was around average with generally dry conditions then predominating for the rest of the period with Bega being drier than Eden. Figure 3 also indicates how correlated the rainfall between the two locations with Eden tending to have more rain in above average months and Bega tending to have less rain in below average months. The three year period 2006-2007 to 2008-2009 was particularly dry apart from the winter period 2006 and late spring/summer 2007-8. The driest individual month at Bega was February 2009 with 5.8 mm (long-term average 77.7 mm); at Eden it was May 2008 when no rain was recorded (long-term average 68.4 mm). The monthly rainfall total of 334 mm in February 2007 at Bega was the sixth wettest February on record at Bega since 1888 while the monthly rainfall total of 265.5 mm in February 2008 at Eden was the ninth wettest February on record since 1870.
 |
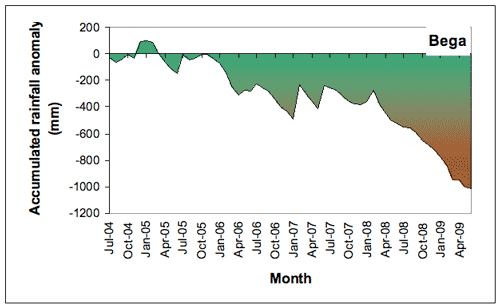
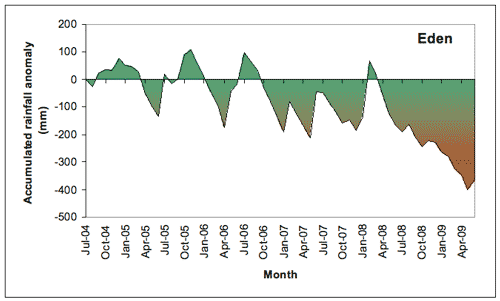
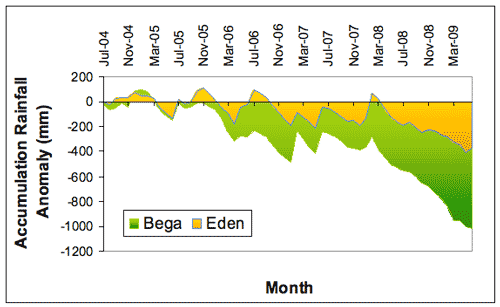
The results of the generally dry conditions at Bega, and the less severe rainfall deficits at Eden during the 2004-2009 period can be seen in Figure 4. Accumulated monthly rainfall totals at Bega commenced to go into deficit in October 2005. This deficit increased considerably during 2006, was halted in winter 2007 before increasing again late 2007 and considerably through 2008/9. At Eden, the deficit fluctuated around the norm for 2004-2005 to September 2006 after which it went into increased deficit which was eased from time to time with individual months of heavy rainfall, becoming positive in February 2008 before then increasing deficit again during the rest of 2008/9. The total deficits for the five year period were 1014.3 mm at Bega and 365.5 mm at Eden. These deficits represent 116% of the annual Jul-Jun rainfall at Bega and 42% at Eden.
a b |
The climatological context for rainfall at Bega and Eden
The long-term perspective
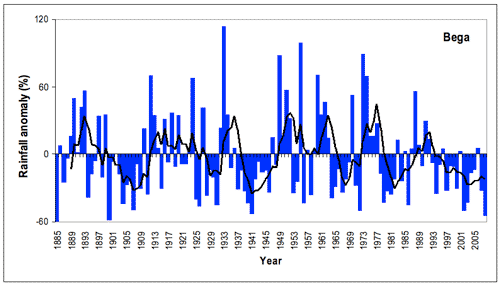
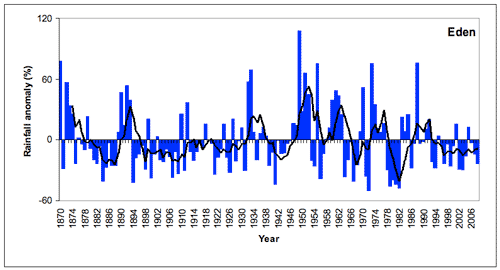
As is typical of the region, Bega and Eden have experienced large fluctuations in annual (July-June) rainfall, including several extended periods of above- and below-average rainfall since records began. In general, annual rainfall was lower and less variable early in the 20th century at Eden, followed by a period of greater variability (Figures 5 and 6). The dry period evident in the last part of the records at both Eden and Bega is reflected in other parts of the record such as the early 20th century and the period 1937-45, and therefore lies within the range of natural variability.
- Rainfall at Eden in the late 19th and early 20th century was generally below average (to about 1950), with the notable exception of a short wet period in the 1930s. Since then annual rainfall totals have been more variable.
- Several wetter-than-normal years around 1950 and 1960 produced generally wetter periods then.
- A generally drier period around 1980 was followed by slightly above-average rainfall until the early 1990s. Since 1993 conditions have been generally drier than average.
The wettest year (July-June) on record at Eden was 1948/49 (1819 mm); the driest year was 1993/94 (363 mm).
- Rainfall at Bega has been more variable than that at Eden, although the record reflects similar extended dry periods to those at Eden (around 1940, the late 1960s, and around 1980).
- Wetter conditions occurred around 1950, 1960 and in the mid-1979s.
- Since 1993 rainfall has generally been below average at Bega and considerably below average since 2001.
The wettest year (July-June) on record at Bega was 1933/34 (1867 mm); the driest year was 1885/86 (354 mm).
 |
 |
There is a distinct difference in the accumulated rainfall deficits between Bega and Eden in the 2004-2009 period (Figure 7a), particularly after October 2005. While dry conditions predominated through 2006/07, particularly at Bega, conditions were alleviated at Eden by heavy rainfall in some months. Wetter months had less effect on the accumulated deficit at Bega. During this 60-month period Eden received more rainfall than Bega in 42 months, while Bega received more rainfall than Eden in 18 months. Overall Eden received 596.3 mm of rain more than Bega over this time.
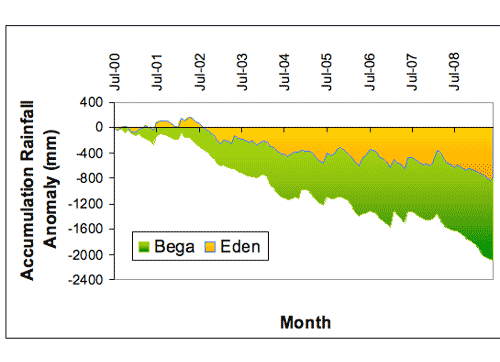
The extent of the persistent dry period over the region is evident in accumulated rainfall over the longer period 2000-2009(Figure 7b). The accumulated deficit that had developed between 2000 and 2004 continued to increase between 2004 and 2009, with the difference between the two sites also increasing. During this period Eden received more rainfall than Bega in 77 months (71%) while Bega received more rainfall in 30 months (28%). Overall Eden received 1209.6 mm of rain more than Bega over this whole period. The total deficits over this 9 year period are 2094.1 mm at Bega (239% of Jul-Jun annual total) and 790.1 mm at Eden (90% of Jul-Jun annual total).
One possible explanation for the difference in rainfall between the two locations is that there were two successive El Niño events during this period (2002/03 and 2006/07), without a compensating wet period between them. In dry years rainfall tends to be particularly impacted by local conditions. The coastal location of Eden means that it may receive rainfall from weather systems that are confined to the coast and do not penetrate inland to reach Bega. During generally wetter years more widespread rainfall may occur across the region.
a
b |
About the data