Regional Climate Overview
Weather and climate in the Australian Capital Region, 2004-2008
During the period under review conditions were generally drier and hotter than average across the Australian Capital Region. The smallest negative rainfall anomalies were recorded in most shires in 2004/05, when rainfall was close to or above average in some months (illustrated in Figure 1a). In the northern and western parts of the region the driest year was 2006/07 (Figure 1b), whereas in the southern and eastern shires 2007/08 was driest. Dry conditions were most severe in the north and west: Young recorded the lowest 12-month rainfall in more than 120 years in 2006/07, and in the same year rainfall in Harden (Murrumburrah) was the second lowest on record and in Boorowa it was third lowest on record.
a 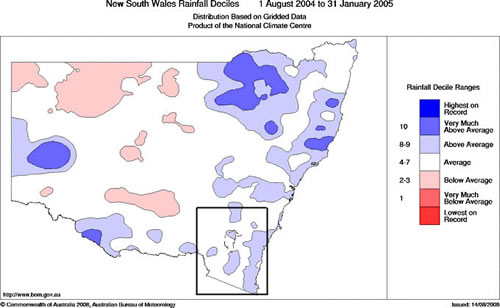 |
b 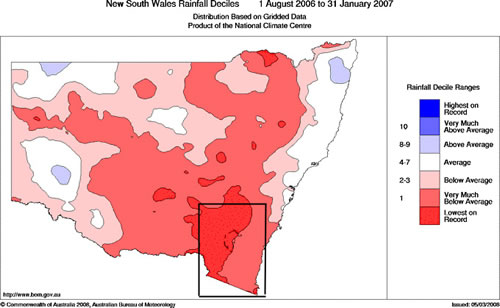 |
At the same time daytime maximum temperatures were above average, by around 8% in much of the region in 2006, and night-time minimum temperature were below average. This often indicates unusually cloud-free conditions, which allows the air near the surface to cool at night as there are no clouds to trap the outgoing heat. In 2007, by contrast, although maximum temperatures remained above average, minimum temperatures were substantially above average in several shires (by more than 20% in some instances). This suggests cloudier nights, in keeping with the smaller negative rainfall anomalies in those shires – there was more rain in 2007/08 than in 2006/07, although conditions remained drier than average. There was an El Niño event in 2006/07 that is associated with the dry conditions that year, and a La Niña event in late 2007/early 2008; La Niña events tend to coincide with increased rainfall, particularly in spring and early summer.
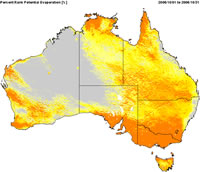
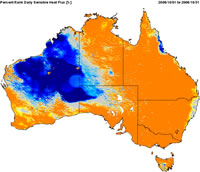
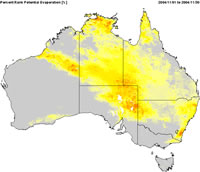
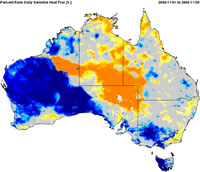
The combination of below-average rainfall and above-average temperatures frequently coincides with high potential evaporation (the amount of evaporation that would occur from an open water surface under given conditions), due to the reduced cloud cover and larger amounts of sunshine. This means that any available moisture in plants, soil and on the surface is more likely to be evaporated, leading to reduced amounts of soil moisture and less available water for plant growth and runoff into streams and water storages. When there is less moisture available in the environment this also leads to an increase in the amount of solar energy that goes into heating the air, rather than into evaporating moisture; this in turn raises temperatures during the day through what is called the sensible heat flux (the transfer of energy by warming the air). The result is that drier periods are also warmer.
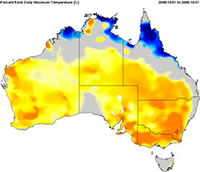
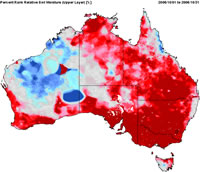
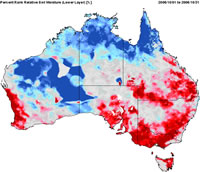
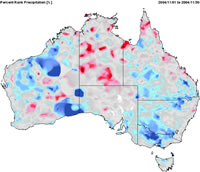
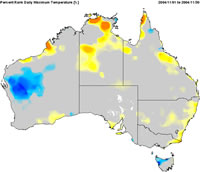
The combined effects of the dry, hot conditions in the observation period on soil moisture, which is vital for plant growth and water availability, are illustrated here in maps showing the relative magnitude of the anomalies of rainfall, daytime maximum temperature, potential evaporation, sensible heat flux, and upper and lower level soil moisture in October 2006 (a particularly dry month). These conditions are contrasted with those in the wetter month of November 2004. Extremely low rainfall and high temperatures across the Australian Capital Region in October 2006 are associated with very low values of soil moisture in both the upper and lower layers. In November 2004 the slightly wetter conditions and lower temperatures are linked to increased moisture in the upper layers of the soil. However, the lower layer soil moisture remains below average. This reflects the accumulated effects of the long period of below-average rainfall and drought in the region since around 2002.
The maps are from the Australian Water Availability Project, a joint project of the Bureau of Rural Sciences, CSIRO and the Bureau of Meteorology (http://www.csiro.au/awap). See the following references:
Raupach MR, PR Briggs, V Haverd, EA King, M Paget, CM Trudinger (2008a), Australian Water Availability Project (AWAP). CSIRO Marine and Atmospheric Research Component: Final Report for Phase 3.
Raupach MR, PR Briggs, V Haverd, EA King, M Paget, CM Trudinger (2008b), Australian Water Availability Project. CSIRO Marine and Atmospheric Research, Canberra, Australia. <http://www.csiro.au/awap>. Accessed 15 November 2008.
| October 2006 | |
|---|---|
Rainfall (% rank) 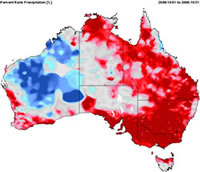
|
Maximum Temperature (% rank)
|
Potential Evaporation (% rank)
|
Sensible Heat Flux (% rank)
|
Soil Moisture - Upper (% rank)
|
Soil Moisture - Lower (% rank)
|
Rainfall and soil moisture: red = low; temperature, evaporation & heat flux: orange = high
| November 2004 | |
|---|---|
Rainfall (% rank)
 |
Maximum Temperature (% rank)
|
Potential Evaporation (% rank)
|
Sensible Heat Flux (% rank)
|
Soil Moisture - Upper (% rank)
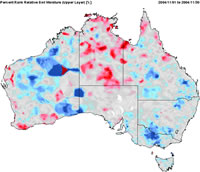
|
Soil Moisture - Lower (% rank)
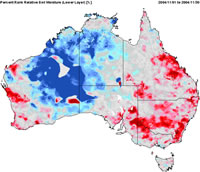
|
Rainfall and soil moisture: red = low; temperature, evaporation & heat flux: orange = high